
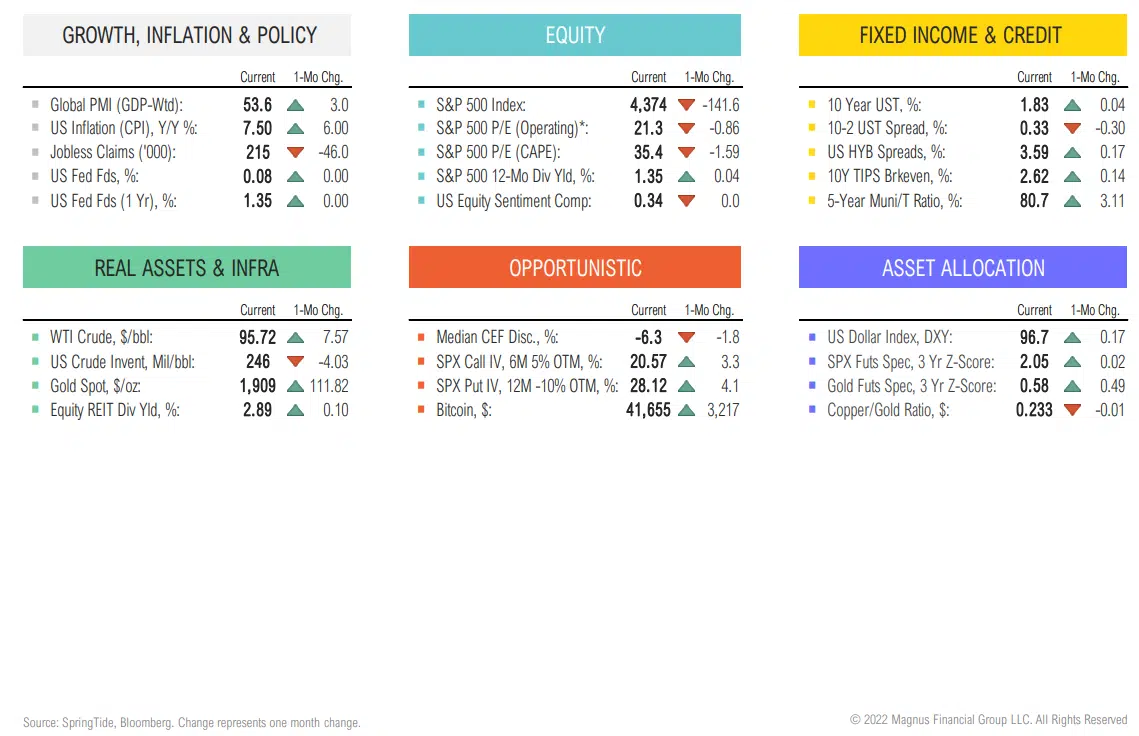
Market Dashboard
SUMMARY
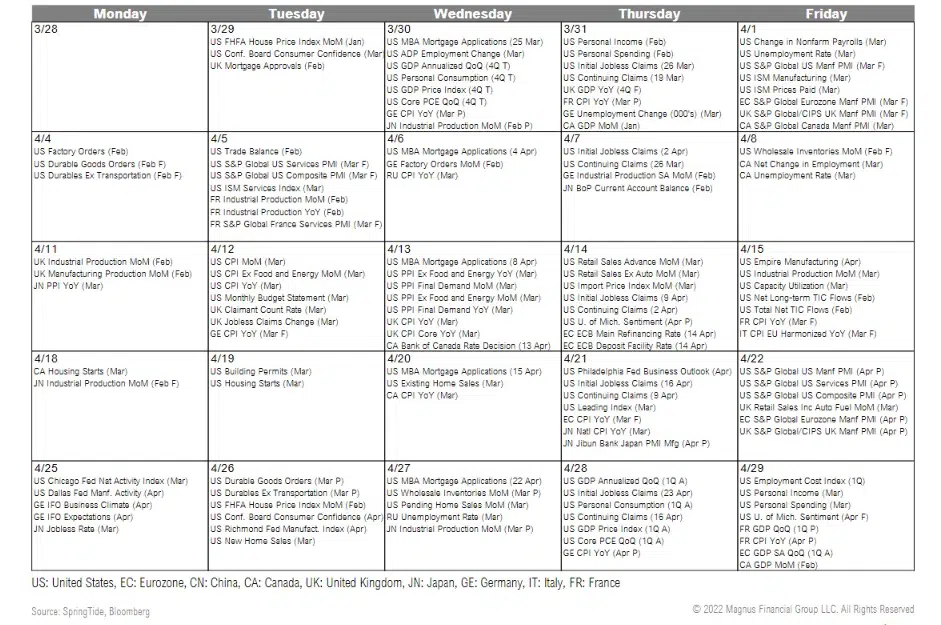
ECONOMIC CALENDAR
CYCLE QUADRANTS
Consensus expected growth and inflation to decelerate in 2022; however, after invasion of Ukraine, stagflation may be base case
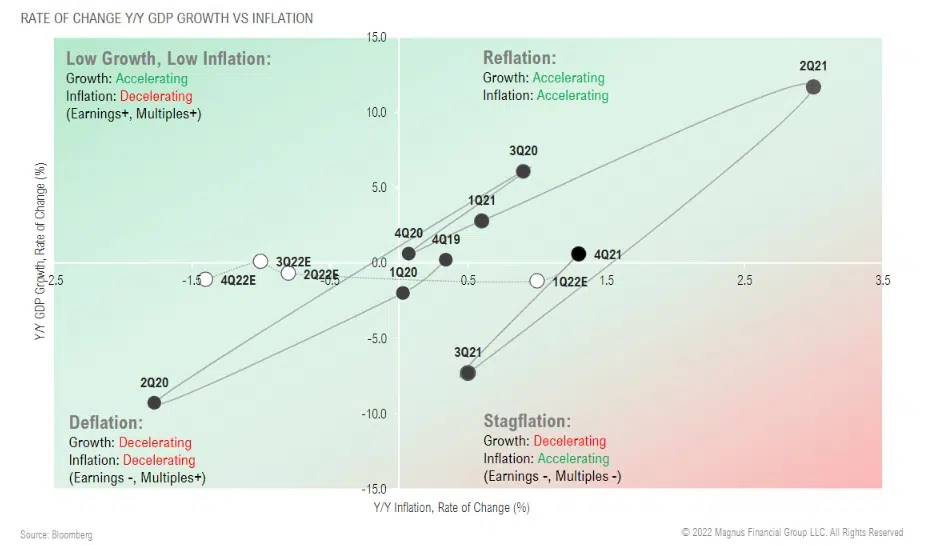
Consensus expected growth and inflation to decelerate in 2022; however, after invasion of Ukraine, stagflation may be base case
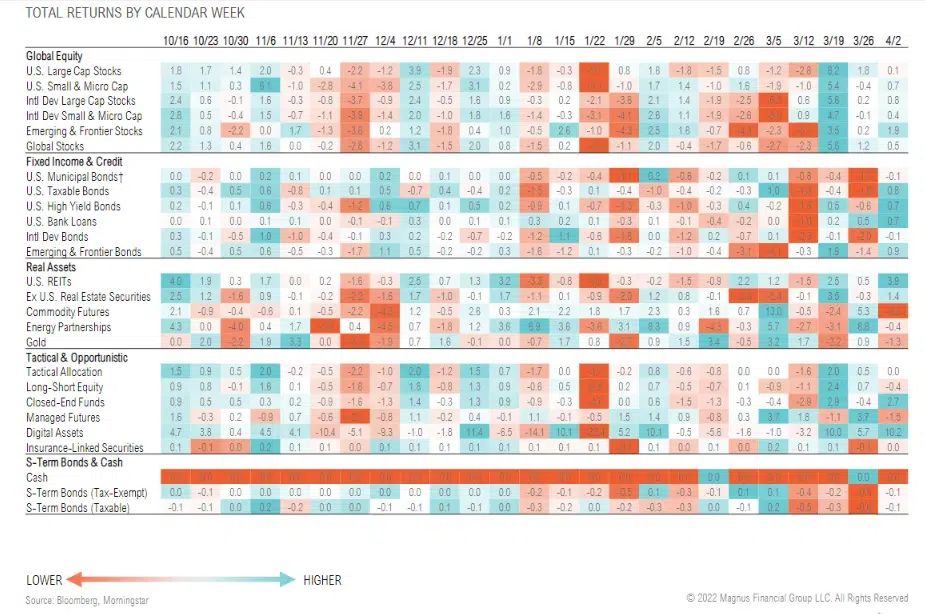
WEEKLY ASSET CLASS RETURNS
GROWTH, INFLATION & POLICY
Global manufacturing activity stalled in March; emerging markets slipped below 50 (contraction) after rebounding in February

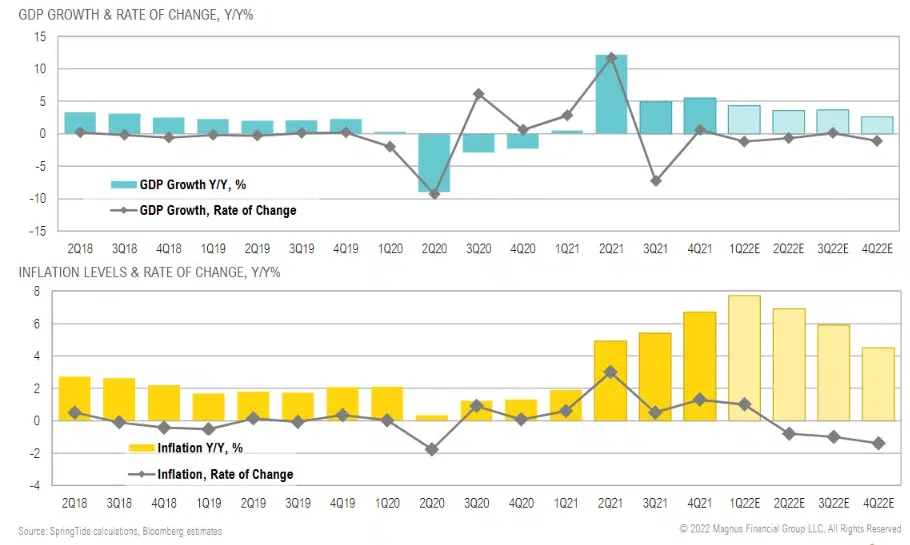
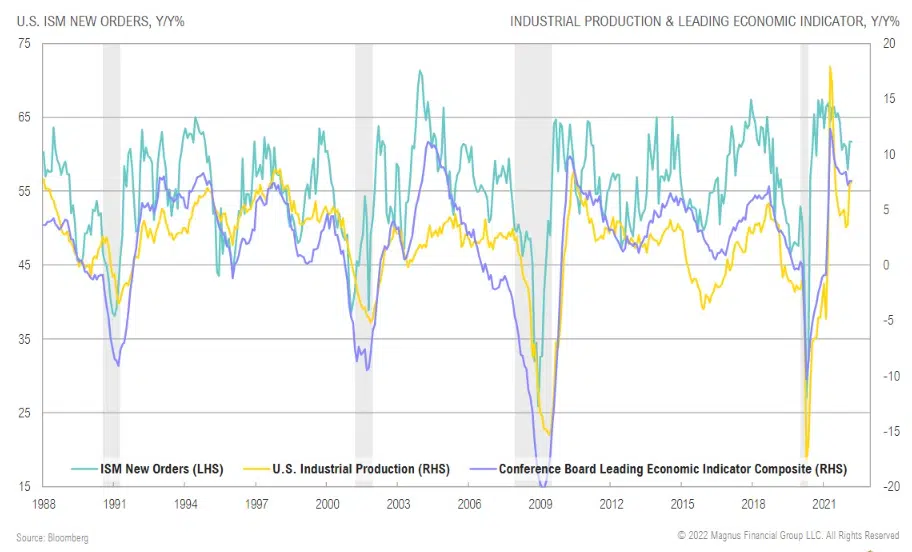
Industrial production and leading indicators peaked as growth in the U.S. slowed in 3Q; indicators continue to trend lower
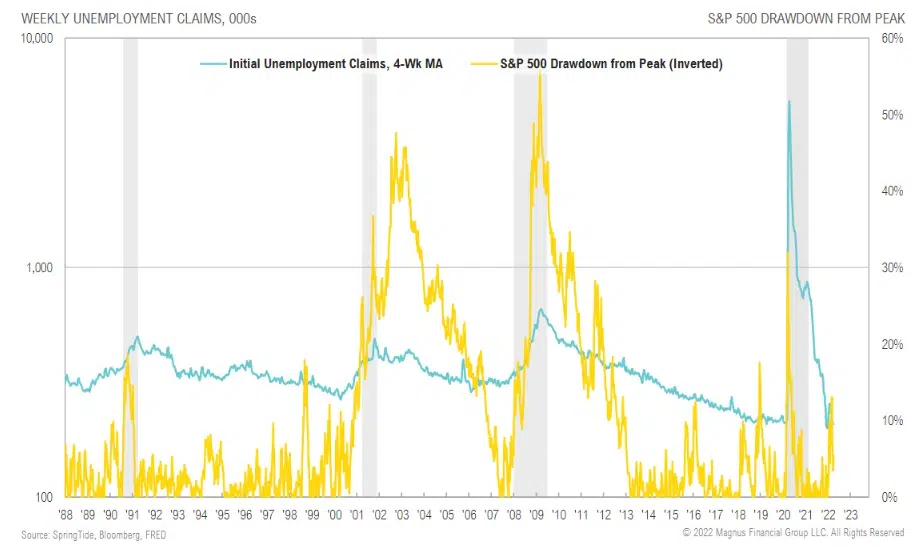
Unemployment claims have again dropped to near 200k; stocks are 5% off all-time highs
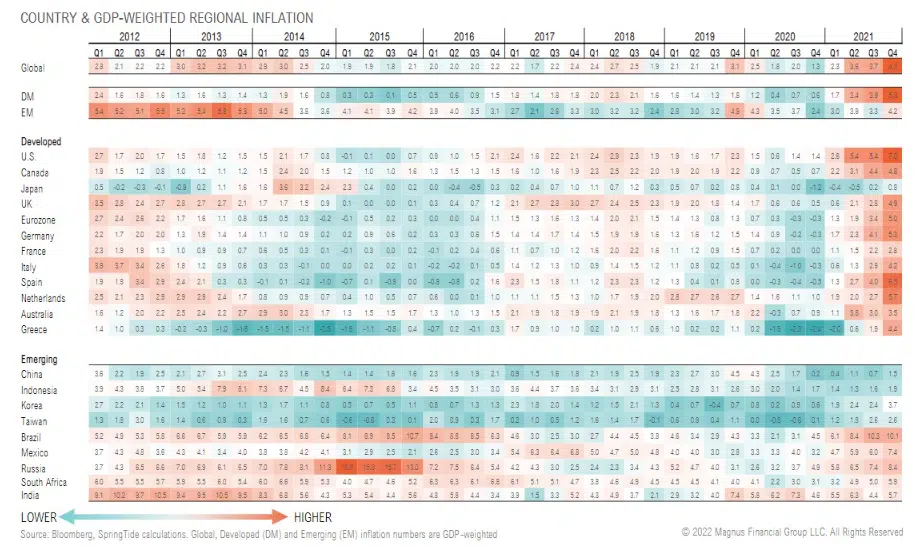
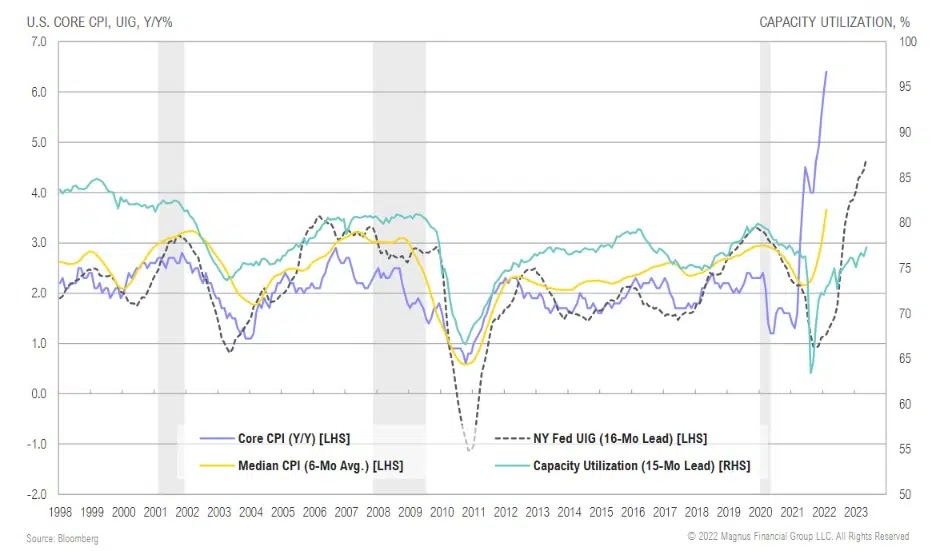
Pre-Russian invasion, global inflation was already at a decade high due to higher commodity input costs, labor tightness, housing prices, supply chain bottlenecks, etc.
Inflation may continue to accelerate based on capacity utilization and other leading indicators trending higher
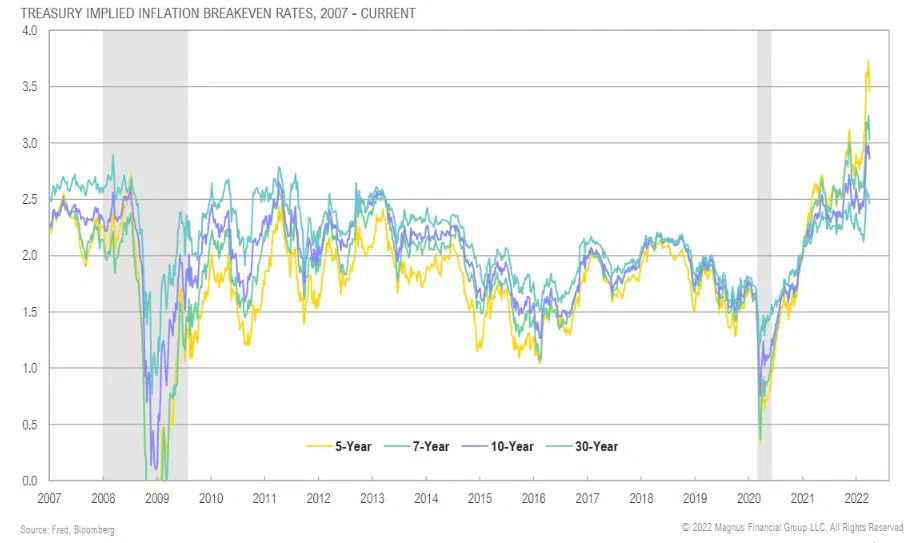
Intermediate-term inflation expectations breaking out to multi-decade highs as Fed’s obtuse policy stance is stoking bond vigilantes
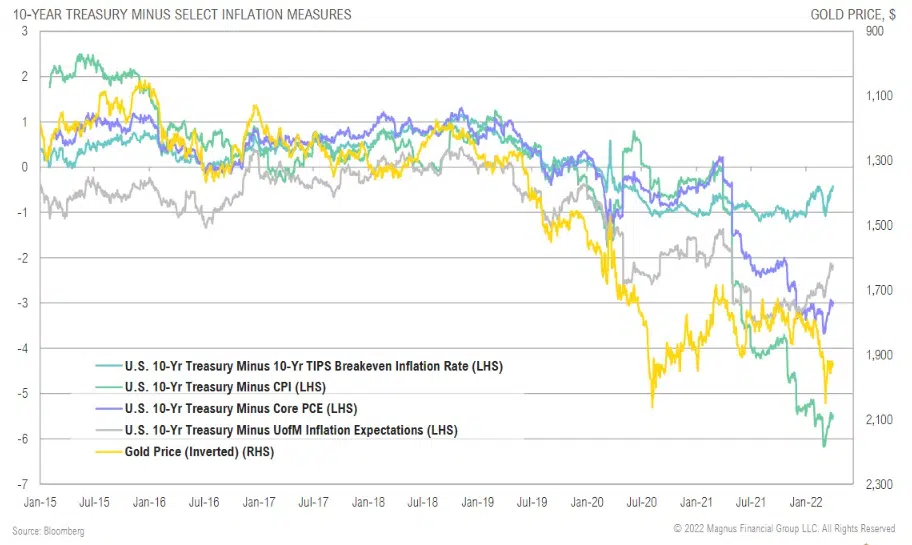
Real yields have remained deeply negative; gold has started to catch up as inflation expectations move back higher and geopolitical risks materialize
Relative rate expectation differences of U.S. vs. Europe and Japan are still dramatic, supporting the U.S. dollar, but note how market now pricing in rate cuts after 2023
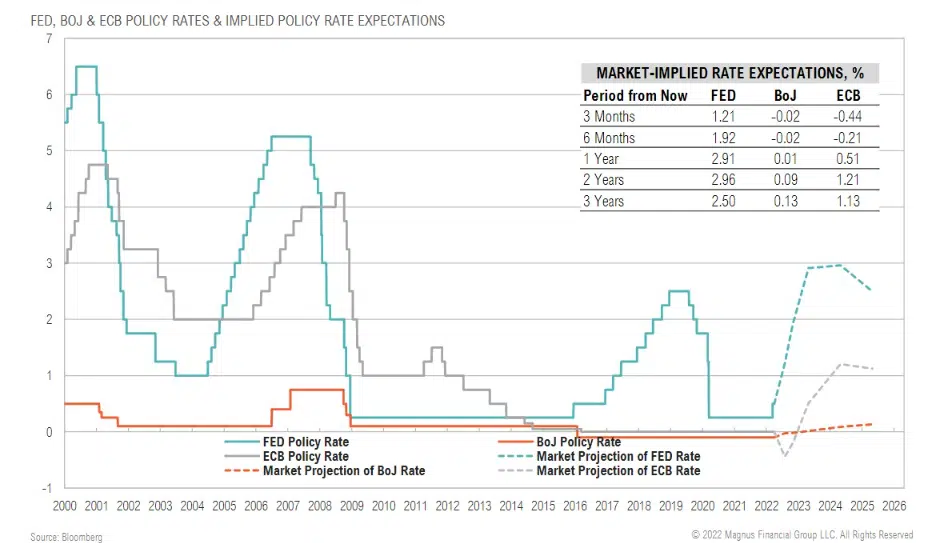
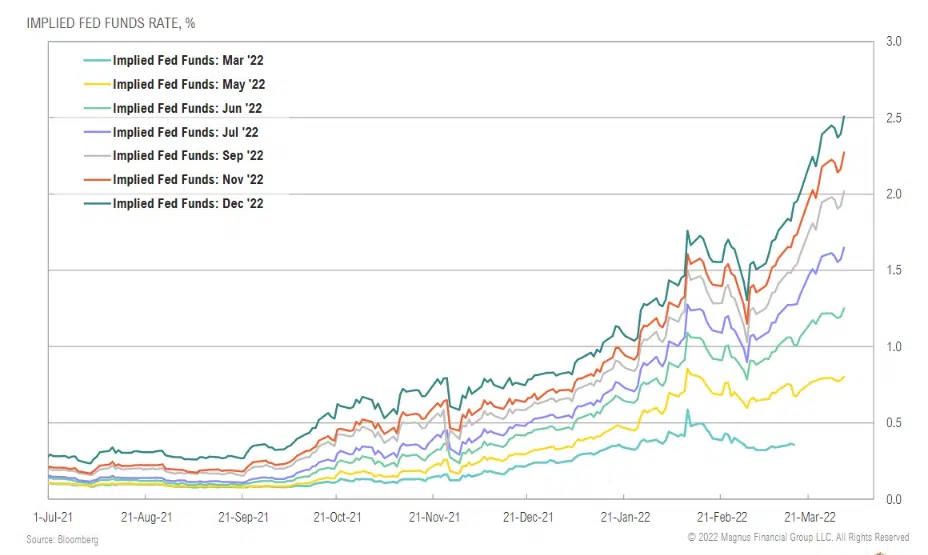
The market is now pricing in 10 rate hikes in 2022 (9 more), up from 6 expected at the start of March
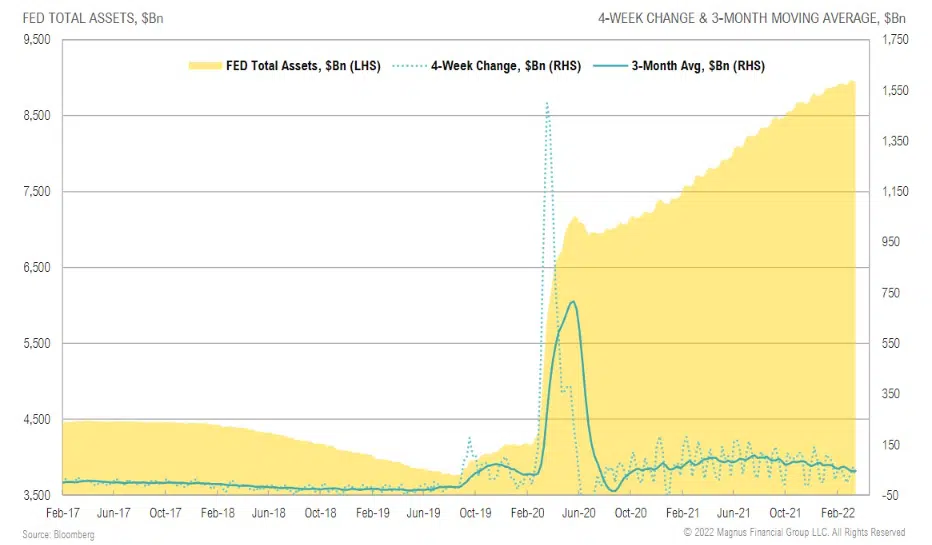
Despite talk of QT, the Fed has remained obtusely loose with a 3-month average increase of $45 billion, bringing balance sheet to $9 trillion
EQUITY
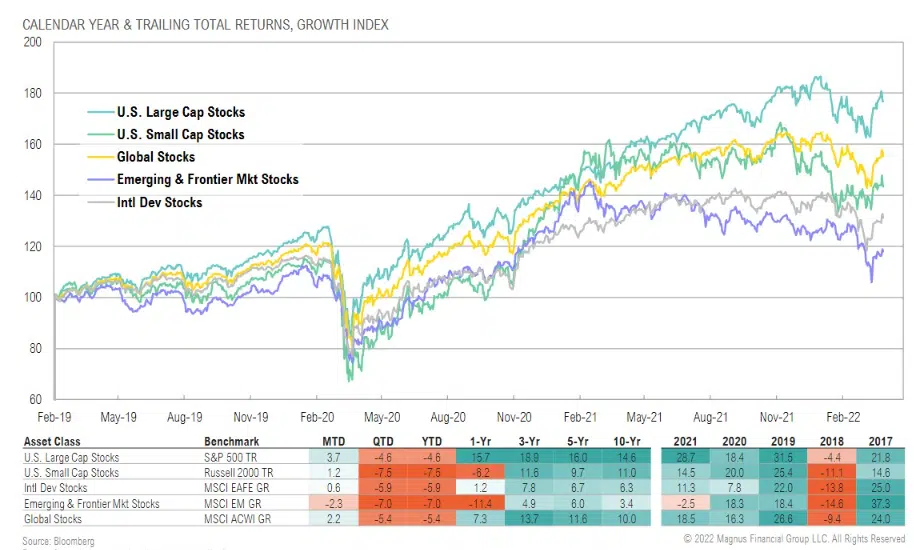
US large cap stocks rebounded by 3.7% after declining in February; U.S. small caps gained 1.2%
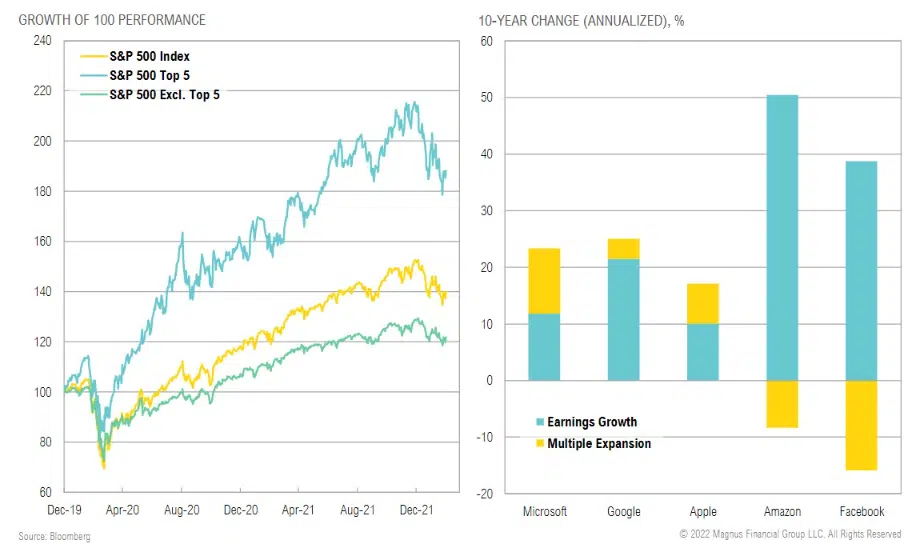
GAMMA (formerly FAAMG) outperformed the S&P 500 ex-GAMMA by 2.2% in March; Top 5 shares have trailed the broader market by 3.8% YTD
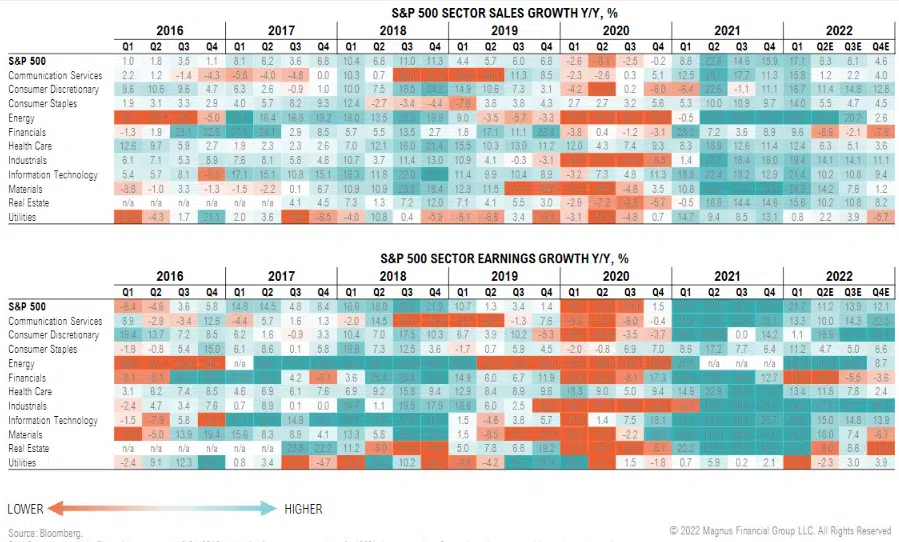
GLOBAL EARNINGS CALENDAR

Sales and earnings growth expected to decelerate but remain strong in 2022; impact of Ukraine conflict-related inflation a wild card
The VIX has dropped below 20 after peaking at >36, suggesting the post-invasion panic has cleared and complacency has returned
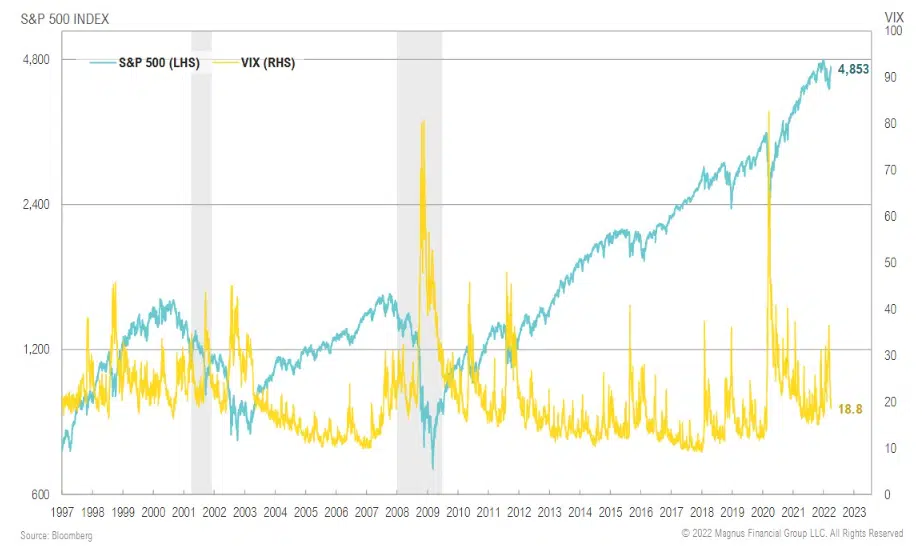
Despite headlines, unprecedented policy support helped 2021 become one of the least volatile years for stocks in half a century; no surprise that 2022 is off to a rockier start
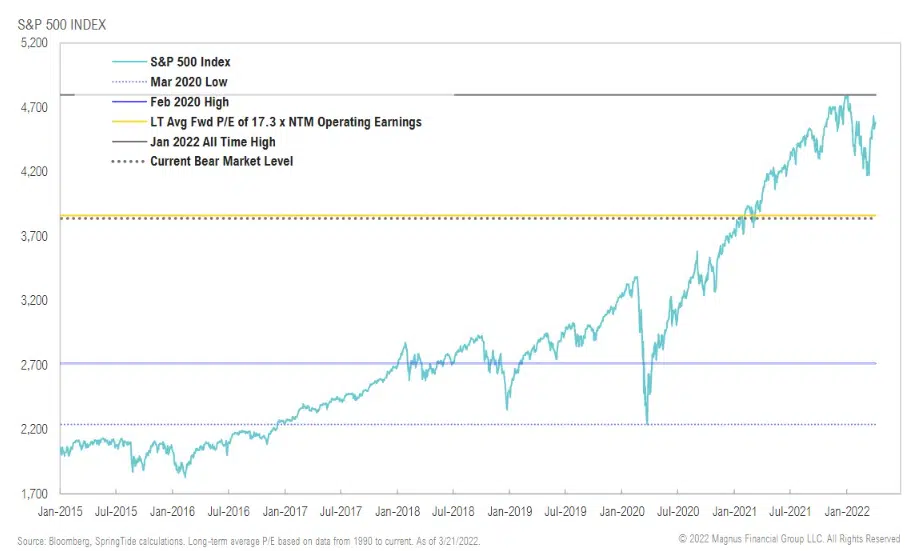
Current drawdown vs. historic bear markets
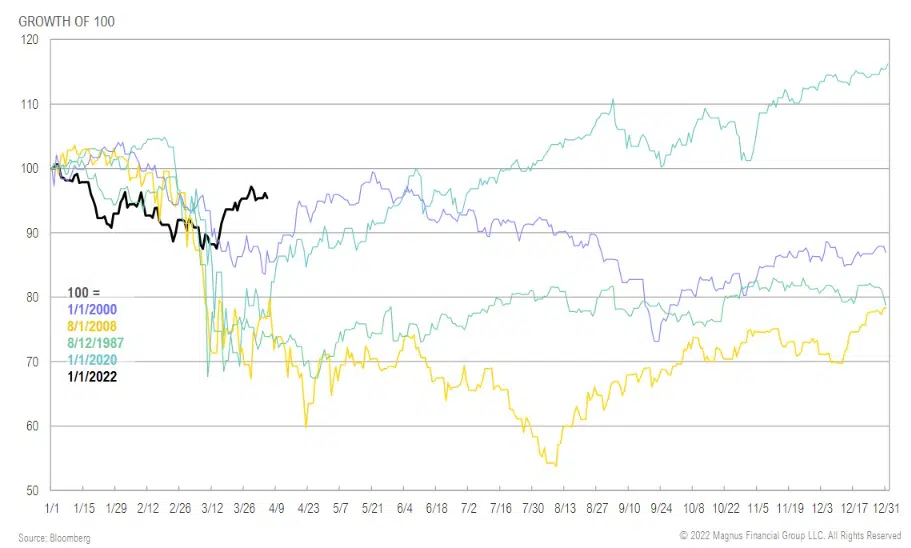
Markets have pulled back from ATH’s, but are still a long way from bear market levels; interestingly, bear market line is equal to long-term average market valuation
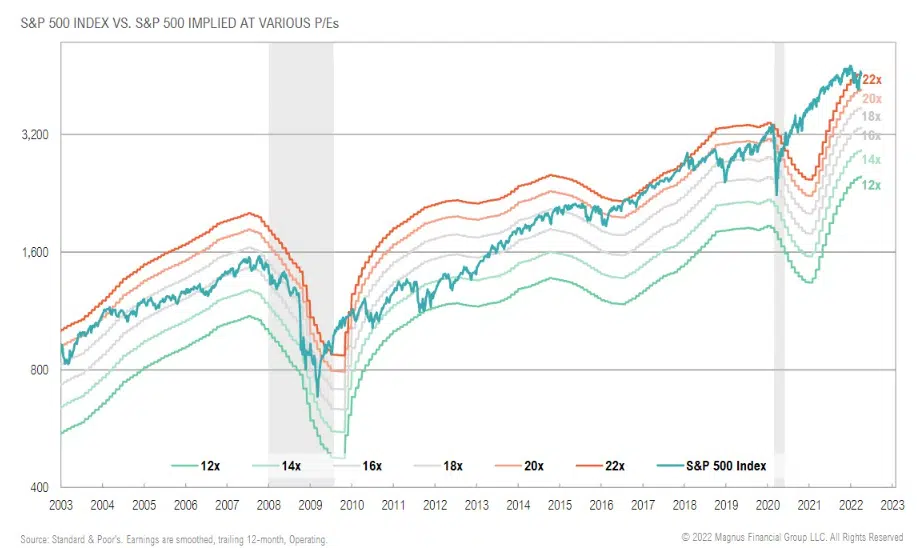
U.S. equity valuations remain very stretched, but earnings growth closed the gap dramatically since the start of the 2021
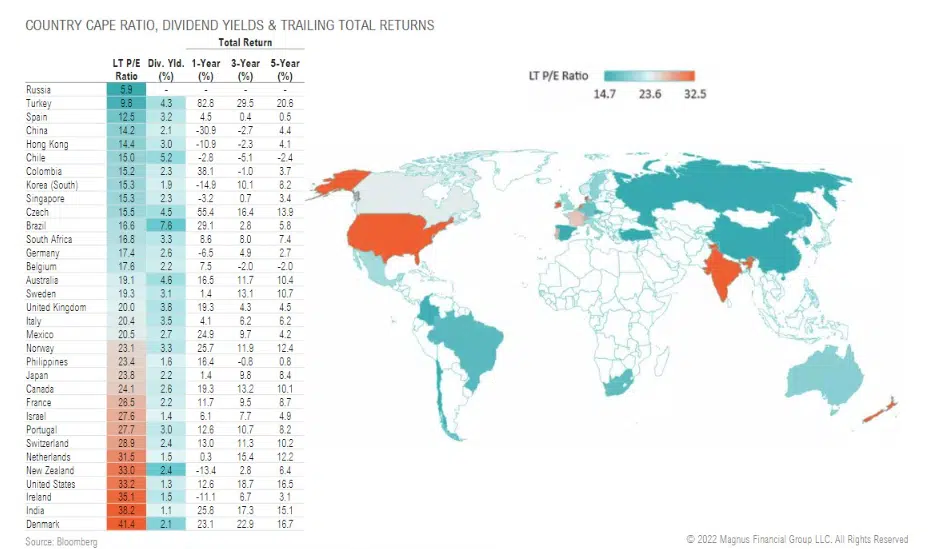
Cyclically-adjusted P/E (CAPE) multiples by country; >5% yields in Brazil and Chile, Russian markets are effectively closed for offshore investors
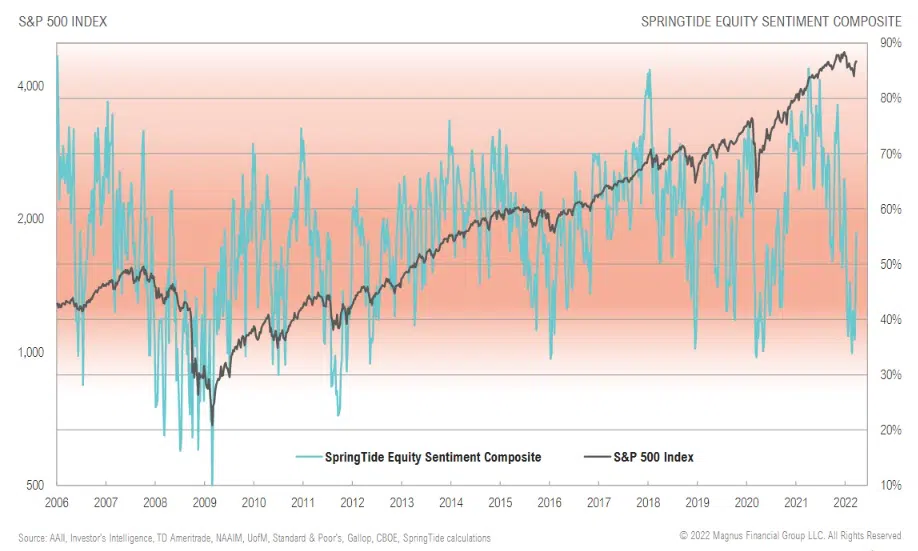
U.S. equity sentiment has rebounded to 56% from below 40% in February, room for upside, but also potentially a sign of growing complacency
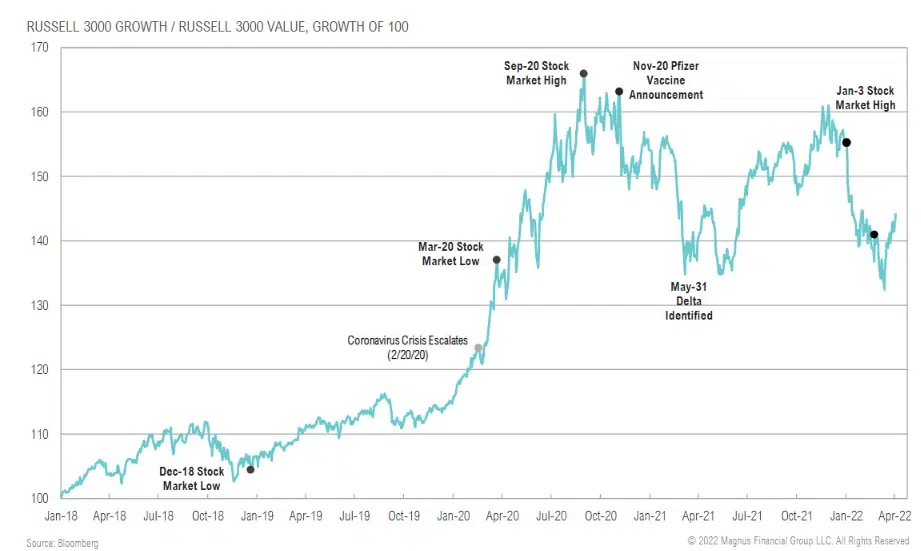
Value outperformed growth post vax announcements; growth’s 2H21 outperformance nearly retraced that lost ground but has since rolled over as rising rates take over as primary driver
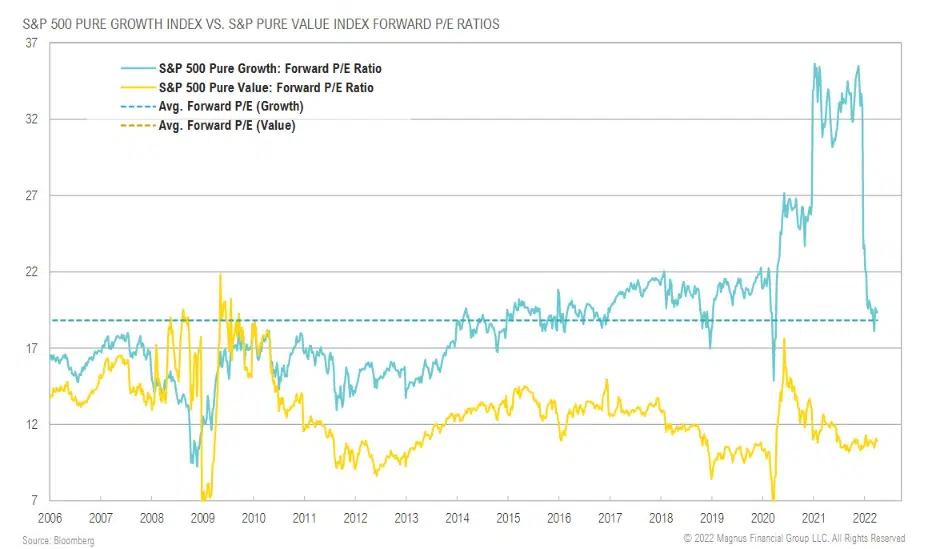
Growth valuations nearing down, but still above 15-year average; value remains relatively cheap
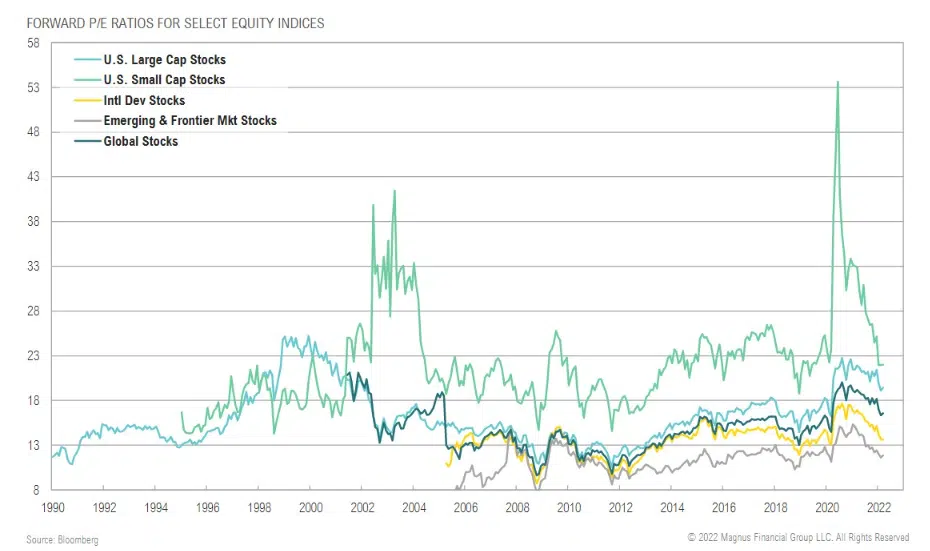
EM equities remain relatively cheap vs. developed markets, but “value trap” risk remains due to geopolitics, global energy “crisis”
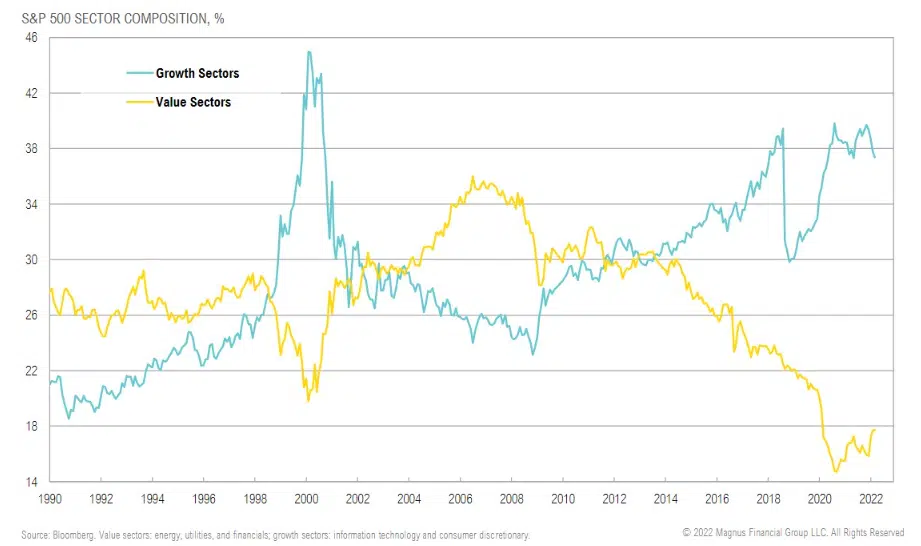
The weight of technology and consumer discretionary stocks in the S&P 500 has dropped to 37% but still near historical highs
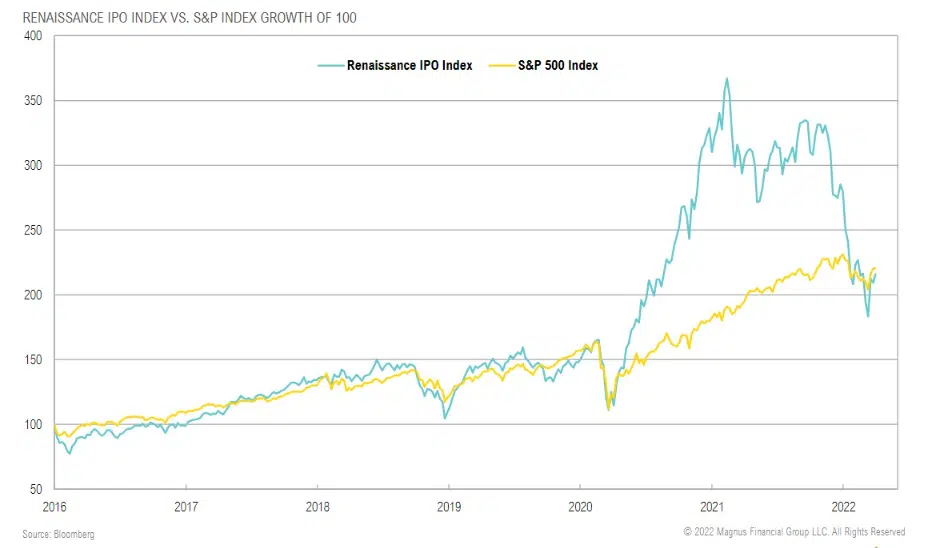
Renaissance IPO Index has had a modest rebound but remains 41% off ATH; S&P 500 has retraced 4.6% since the start of the year
FIXED INCOME & CREDIT
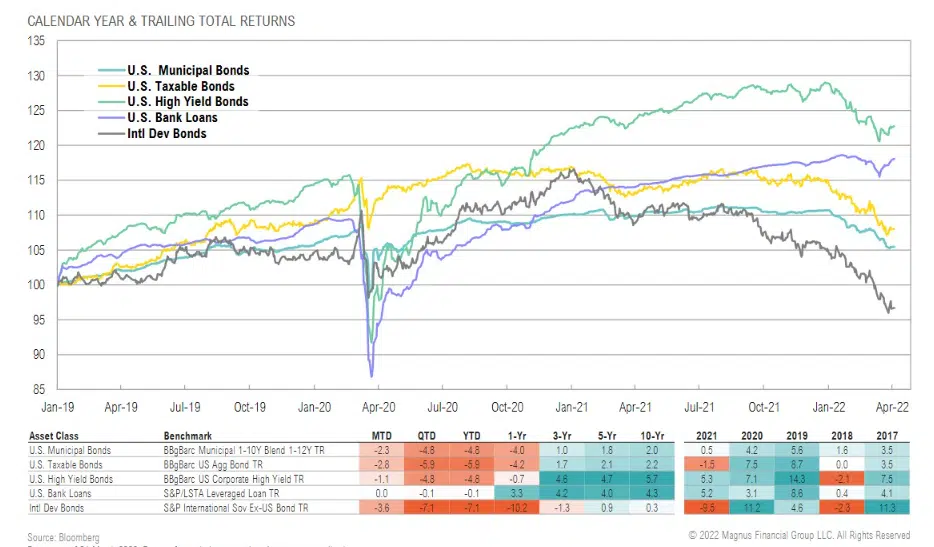
Most U.S. fixed income and credit asset classes were down in March, U.S. high yield fairing relatively well; international developed bonds worst performer
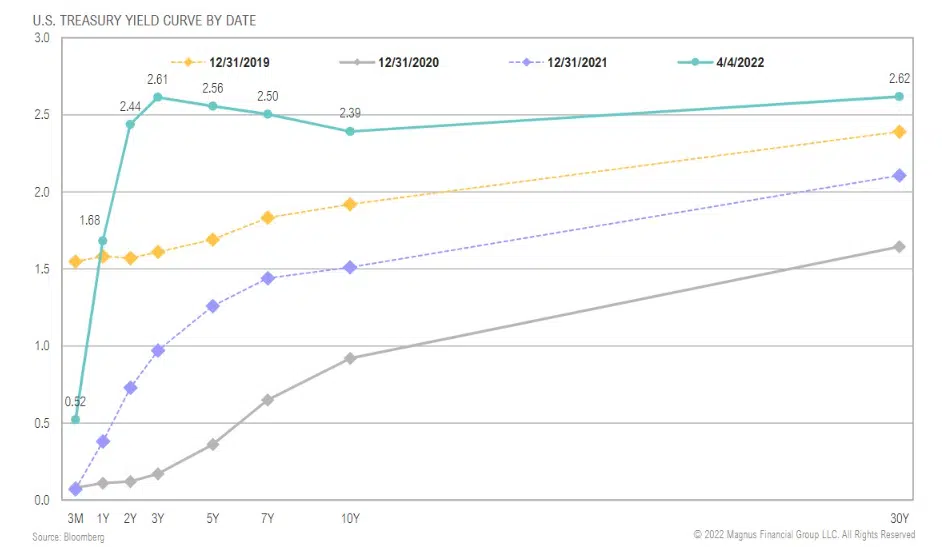
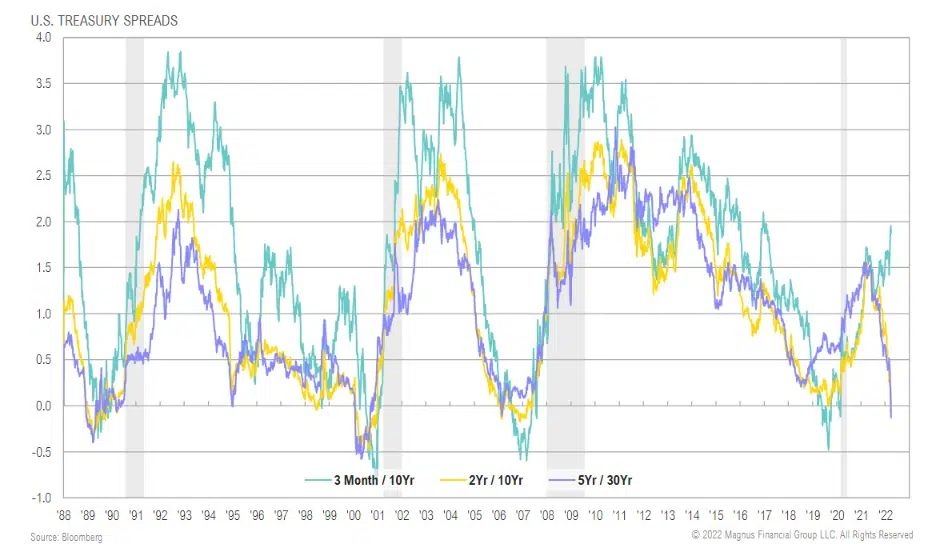
Parts of the Treasury yield curve have inverted as expected rate hikes have pulled up short rates at the expense of longer-term growth
Parts of the Treasury yield curve have inverted as expected rate hikes have pulled up short rates at the expense of longer-term growth
5-year/ 30-year Treasury spread cratering on rate hike > subsequent slowdown expectations
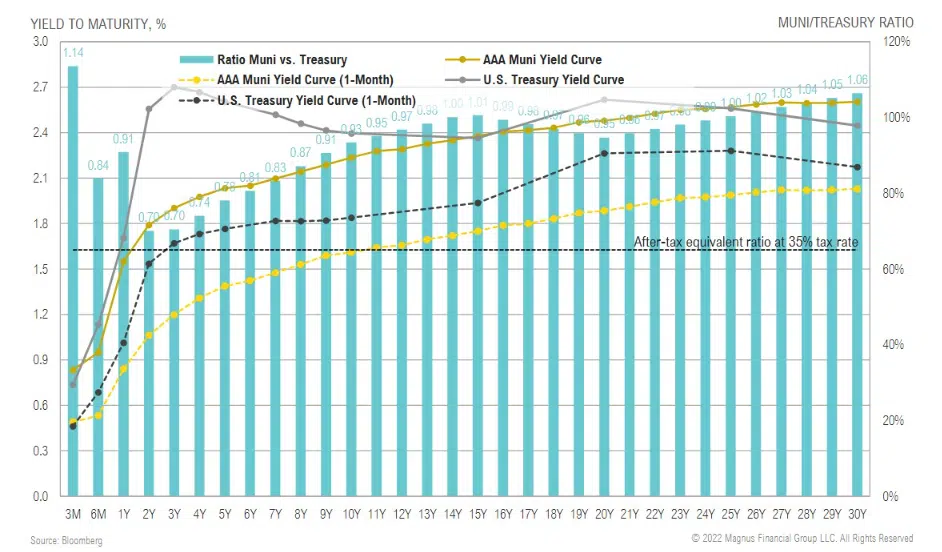
Muni-Treasury ratio: short-term municipal bond yields are looking relatively attractive compared to taxable bonds
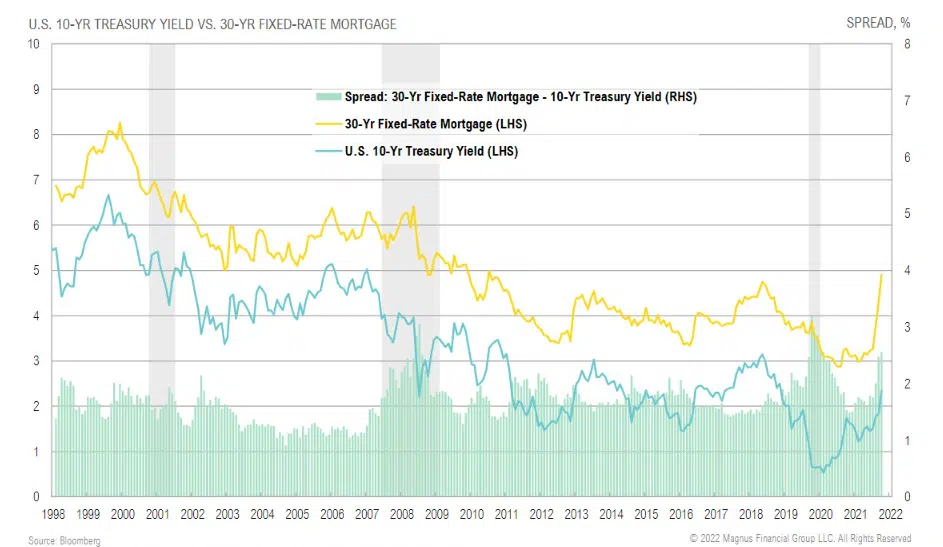
30-year fixed mortgage rates jumped in March as mortgage rate spreads vs. 10-year Treasury widened
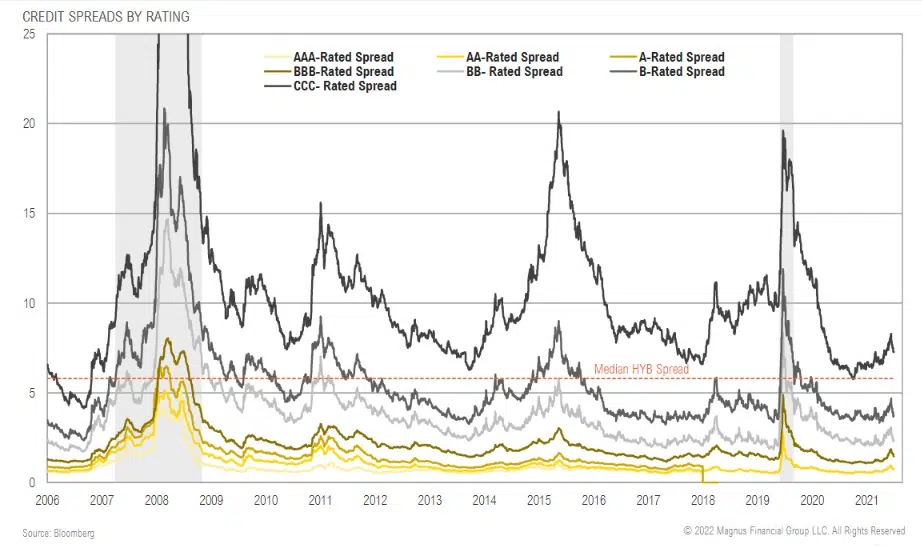
Credit spreads near median across most sectors as almost all pain in credit has been due to duration component (not spread widening)
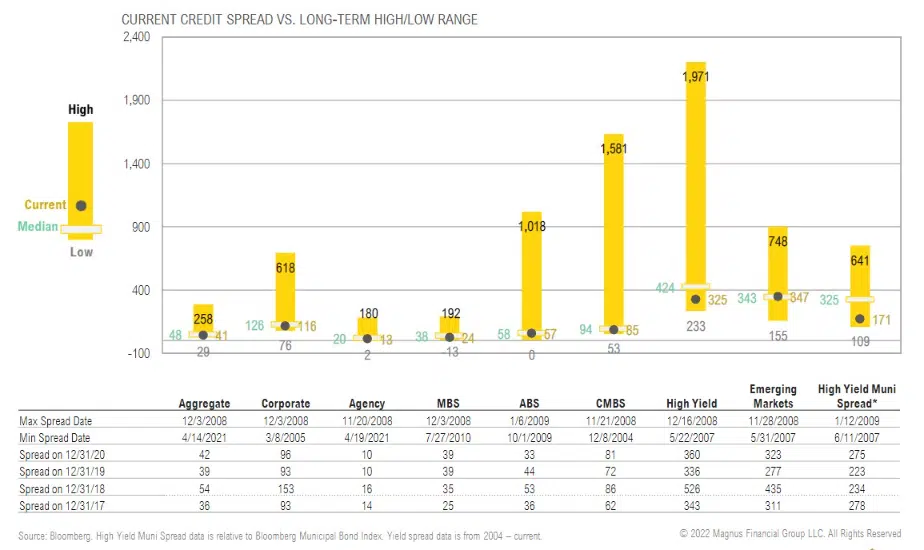
Credit spreads tightened in March after modest widening in February; markets grappling with when and by how much inflation and higher rates will crimp growth
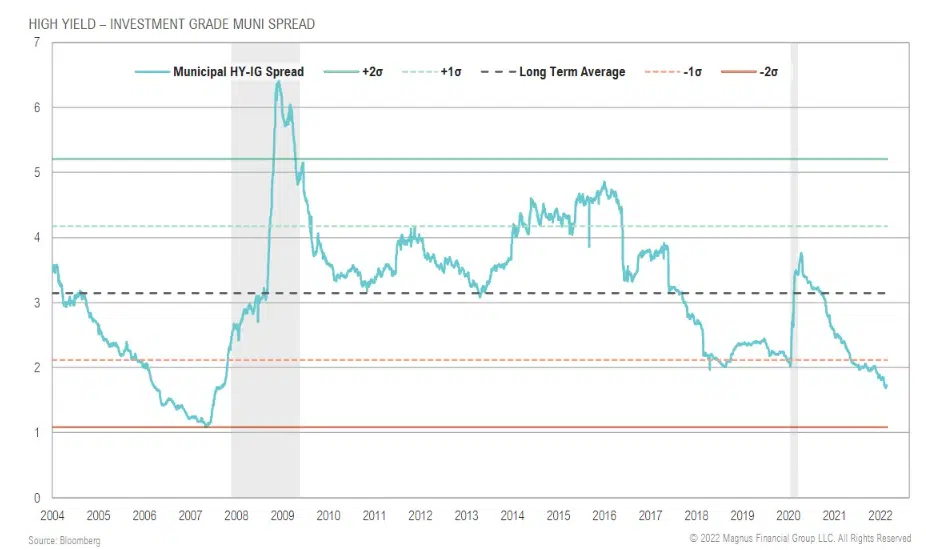
High yield-to-investment grade munispreads near tightest levels since 2007
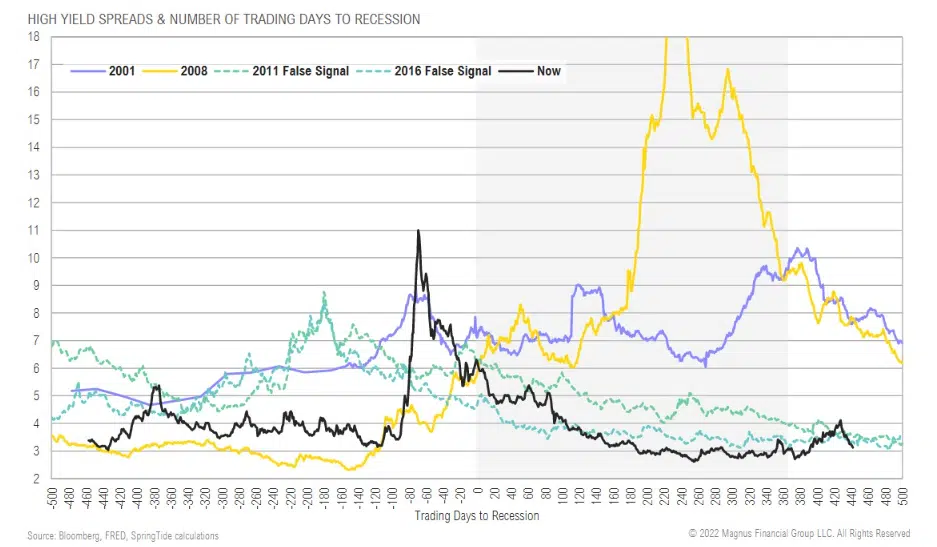
High yield spreads through the COVID-19 crisis highlight the episodic nature of volatility with an active Fed put, which may not be in place during next crisis
REAL ASSETS & INFRASTRUCTURE
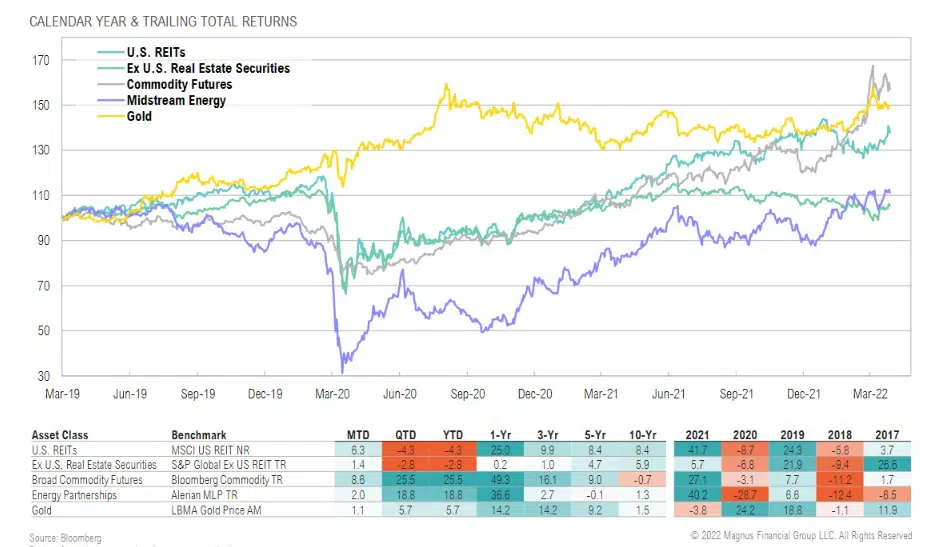
Commodities and U.S. REITS outperformed in March; U.S. REITs have struggled along with risk assets more broadly ytd
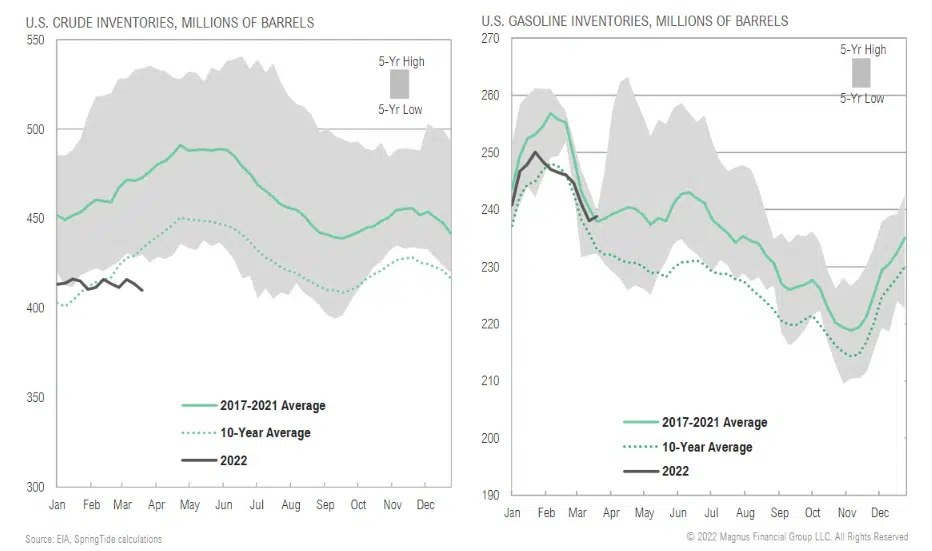
Crude oil inventories remain well below long-term averages while gasoline inventories are roughly in line with average
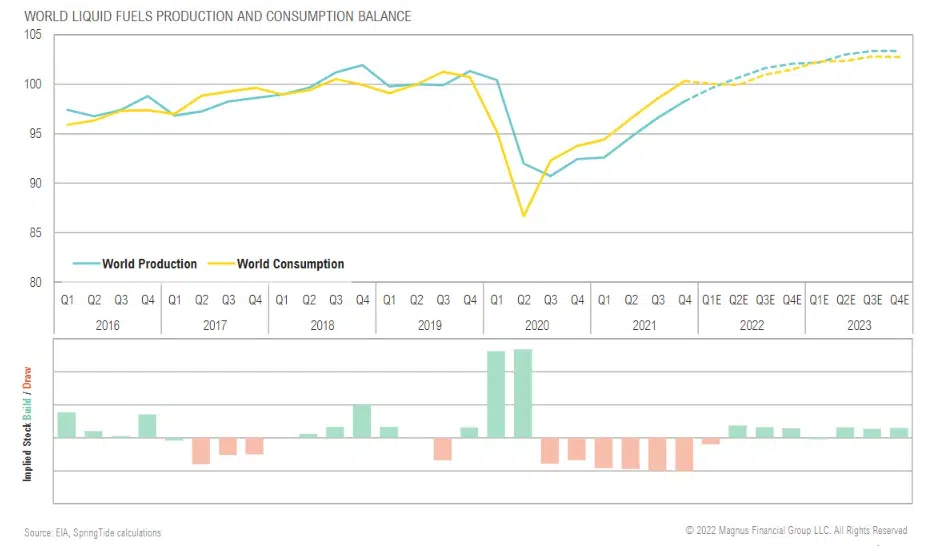
As expected, snapback in energy consumption is outpacing production; production expected to match consumption later in 2022 per EIA, but this remains to be seen
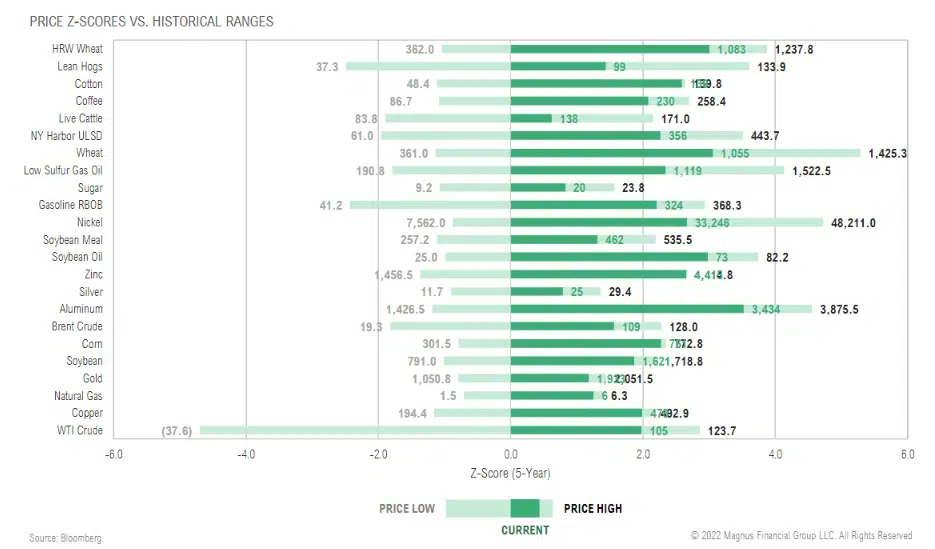
Several commodities hit new all-time highs following Russia’s invasion of Ukraine given their importance to global supply of energy and food
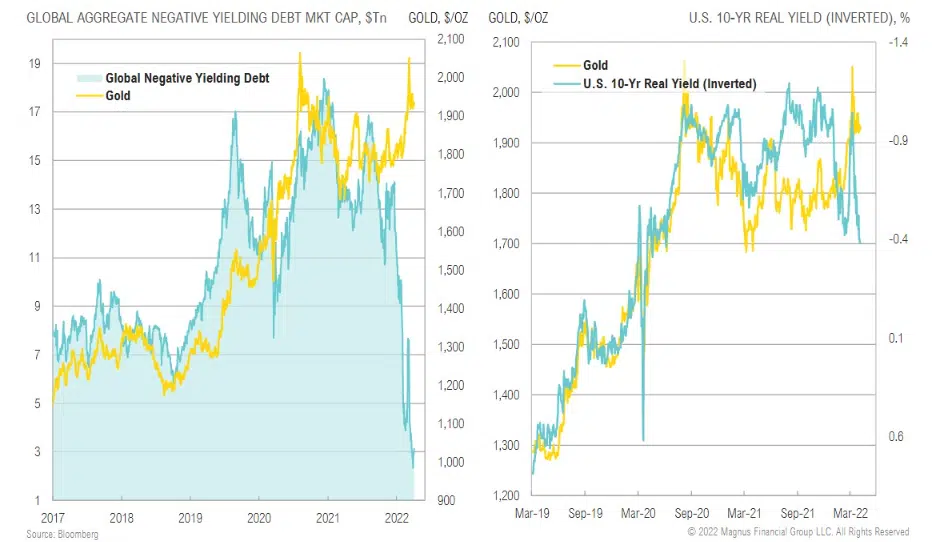
Real yields have remained deeply negative despite nominal increases in rates; gold has broken out, potentially as concerns about longer-term financial repression trump the spike in rates globally
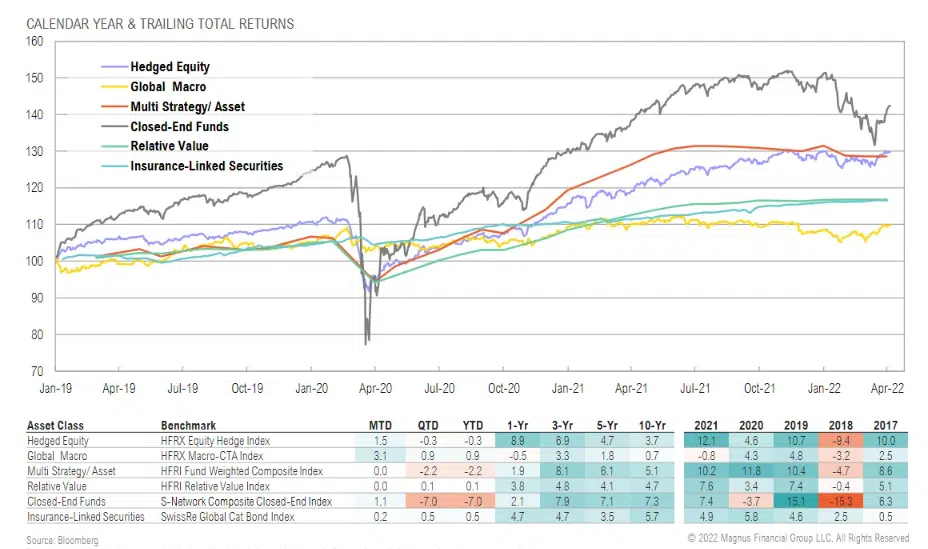
OPPORTUNISTIC
Solid returns from global macro and closed-end funds in March
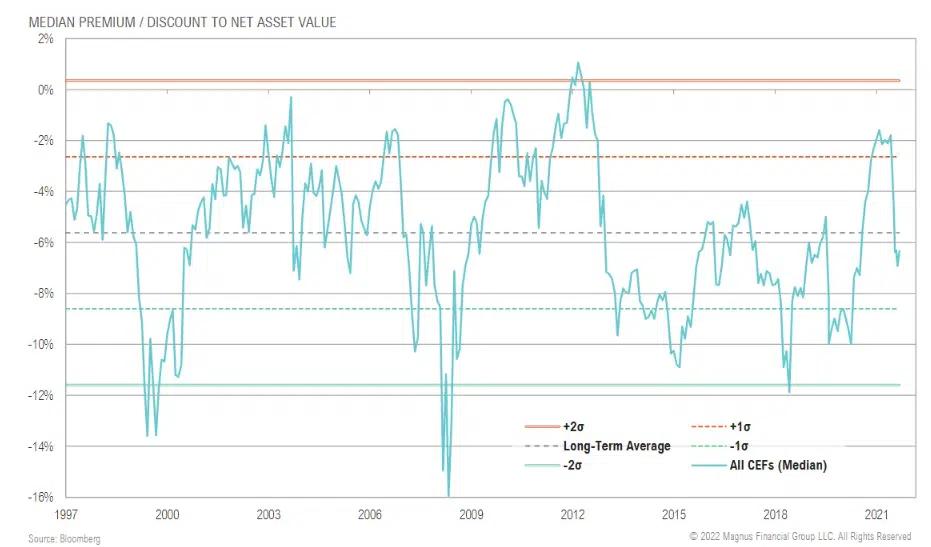
CEF discounts were unchanged month over month at -6.3%, but widened to >7% intramonth
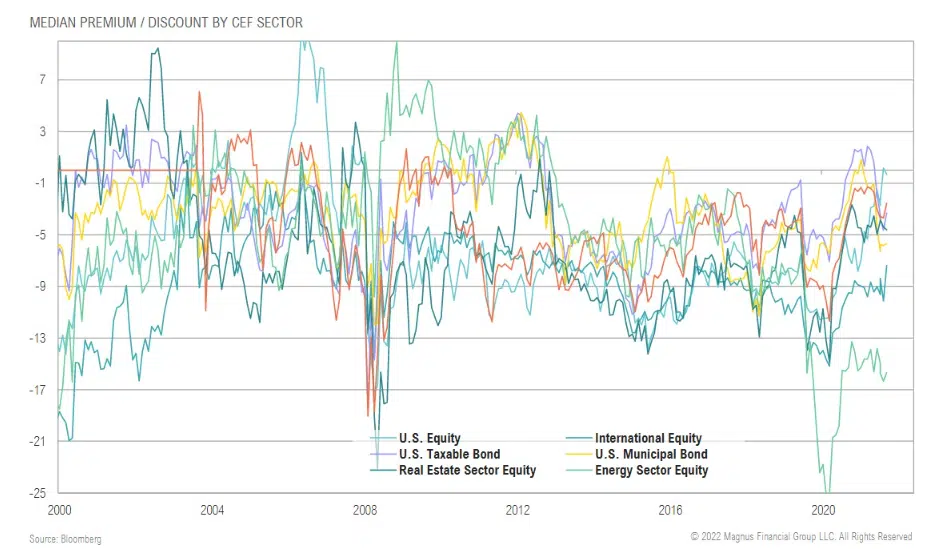
CEF discounts mixed by sector; taxable bond CEFs still no longer trading at a premium while energy sector discounts remains stubbornly wide
ASSET ALLOCATION
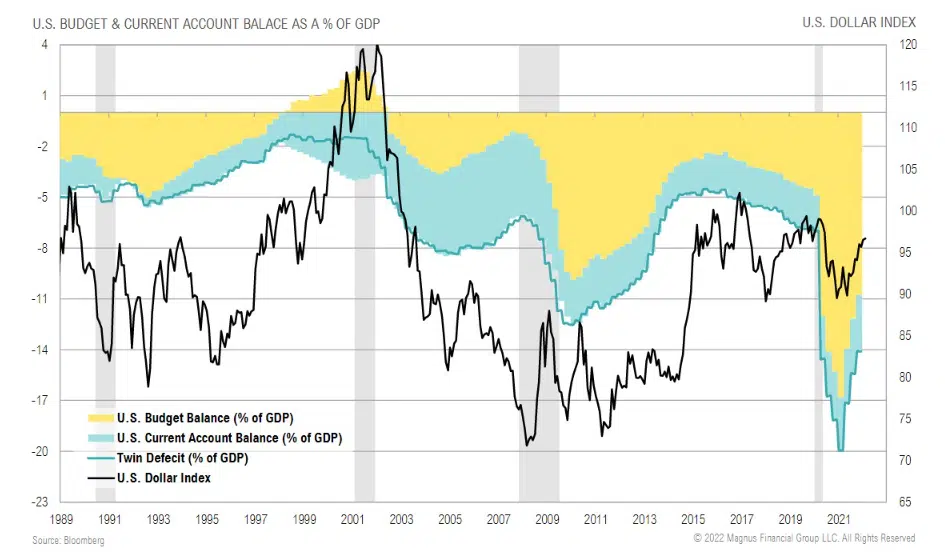
U.S. Dollar strength driven by relative real yields and safe-haven bid due to Russian invasion of Ukraine
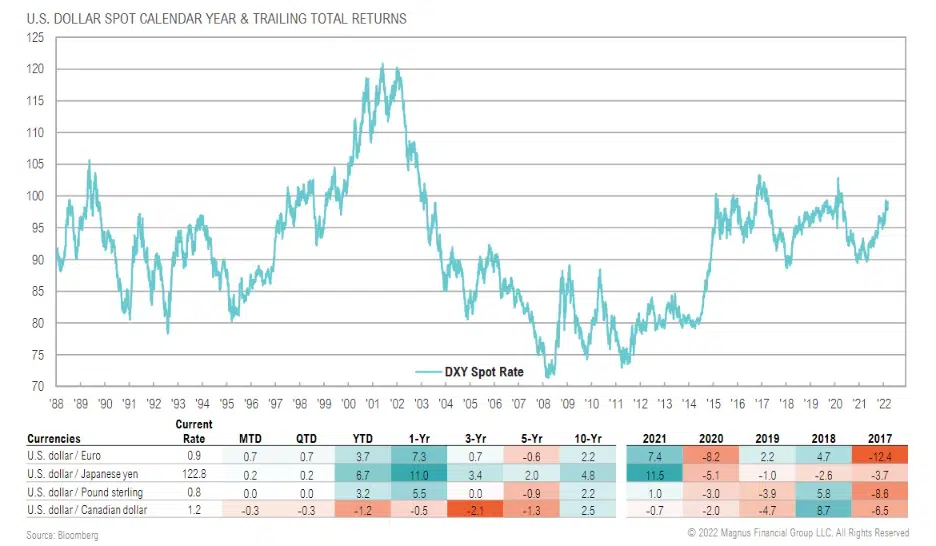
U.S. Dollar strength driven by relative real yields and safe-haven bid due to Russian invasion of Ukraine
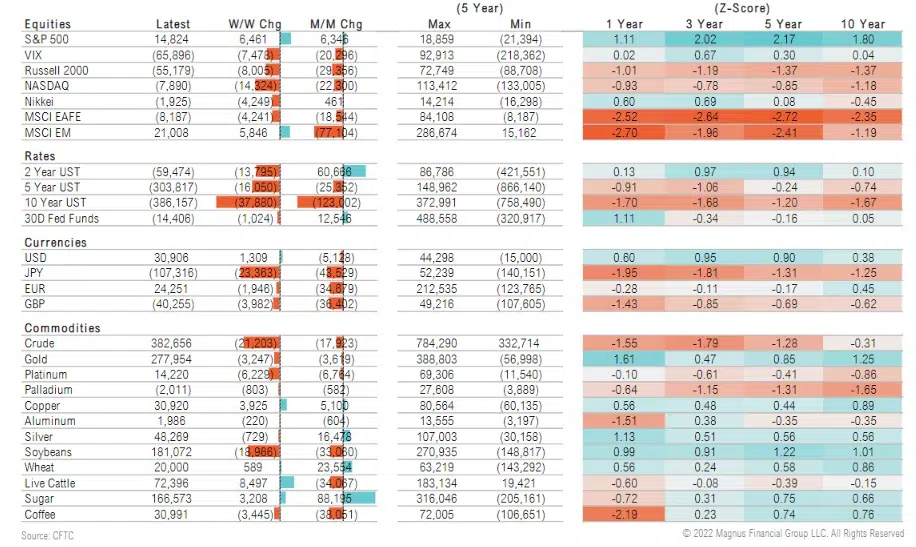
Futures spec positioning shows large increase in bullish bets in commodities and bearish bets in bonds
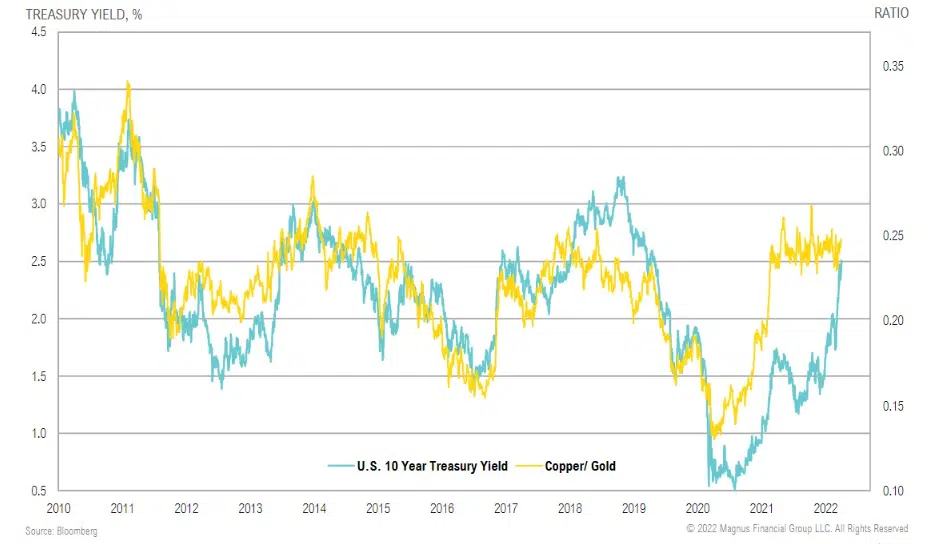
10-year Treasury closed the gap with copper/gold ratio; no clear signal from here, but could suggest rate increases will slow, roll over
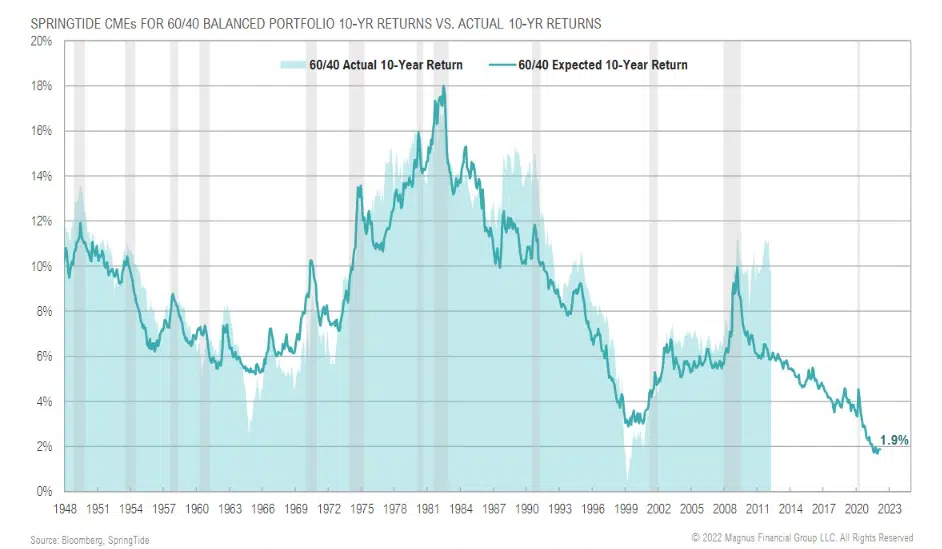
Expected returns for passive 60/40 portfolio picked up modestly, but remain near all-time low
INDEX DEFINITIONS
S&P 500 Index: Widely regarded as the best single gauge of the U.S. equities market. The index includes a representative sample of 500 leading companies in leading industries of the U.S. economy. The S&P 500 Index focuses on the large-cap segment of the market; however, since it includes a significant portion of the total value of the market, it also represents the market.
MSCI ACWI: (ACWI: All Country World Index) a free float-adjusted market capitalization weighted index that is designed to measure the equity market performance of developed and emerging markets.
MSCI EAFE Index: (EAFE: Europe, Australasia, Far East) a free float-adjusted market capitalization index that is designed to measure the equity market performance of developed markets, excluding the US & Canada.
MSCI EAFE Small Cap Index: (EAFE: Europe, Australasia, Far East) a free floatad justed market capitalization index that is designed to measure the small cap equity market performance of developed markets, excluding the US & Canada.
MSCI EM Index: A free float-adjusted market capitalization index that is designed to measure equity market performance in the global emerging markets.
Russell 1000 Index: Measures the performance of the 1,000 largest companies in the Russell 3000.
Russell 2000 Index: Measures the performance of the 2,000 smallest companies in the Russell 3000 Index.
Russell 3000 Index: Measures the performance of the 3,000 largest U.S. companies based on total market capitalization.
Cambridge Associates U.S. Global Buyout and Growth Index: Based on data compiled from 1,768 global (U.S. & ex – U.S.) buyout and growth equity funds, including fully liquidated partnerships, formed between 1986 and 2013.
Cambridge Associates Private Equity Index: Based on data compiled from 1,468 U.S. private equity funds (buyout, growth equity, private equity energy and subordinated capital funds), including fully liquidated partnerships, formed between 1986 and 2017.
Cambridge Associates Venture Capital Index: Based on data compiled from 1,807 US venture capital funds (1,161 early stage, 210 late & expansion stage, and 436 multistage funds), including fully liquidated partnerships, formed between 1981 and 2018.
Bloomberg Barclays U.S. Aggregate Bond Index: A broad-based flagship benchmark that measures the investment grade, US dollar-denominated, fixedrate taxable bond market. The index includes Treasuries, government related and corporate securities, MBS (agency fixed-rate pass-throughs), ABS and CMBS (agency and non-agency).
Bloomberg Barclays Global Aggregate Index: A multi-currency measure of global investment grade debt from twenty-four local currency markets. This benchmark includes treasury, government-related, corporate and securitized fixed-rate bonds from both developed and emerging markets issuers.
Bloomberg Barclays Global Aggregate ex-USD Index: A multi-currency measure of investment grade debt from 24 local currency markets. This benchmark includes treasury, government-related, corporate and securitized fixed-rate bonds from both developed and emerging markets issuers. Bonds issued in USD are excluded.
Bloomberg Barclays Municipal Index: Consists of a broad selection of investment- grade general obligation and revenue bonds of maturities ranging from one year to 30 years. It is an unmanaged index representative of the taxexempt bond market.
Bloomberg Barclays US High Yield Index: Covers the universe of fixed rate, non-investment grade debt. Eurobonds and debt issues from countries designated as emerging markets (sovereign rating of Baa1/BBB+/BBB+ and below using the middle of Moody’s, S&P, and Fitch) are excluded, but Canadian and global bonds (SEC registered) of issuers in non-EMG countries are included.
Bloomberg Barclays 1-3 Month U.S. Treasury Bill Index: Includes all publicly issued zero-coupon US Treasury Bills that have a remaining maturity of less than 3 months and more than 1 month, are rated investment grade, and have $250 million or more of outstanding face value. In addition, the securities must be denominated in U.S. dollars and must be fixed rate and non-convertible.
J.P. Morgan Emerging Market Bond Global Index (EMBI): Includes U.S. dollar denominated Brady bonds, Eurobonds, traded loans and local market debt instruments issued by sovereign and quasi-sovereign entities.
Alerian MLP Index: A composite of the 50 most prominent energy Master Limited Partnerships (MLPs) that provides investors with an unbiased,
comprehensive benchmark for the asset class.
Bloomberg Commodity Index: Composed of futures contracts on physical commodities and represents twenty two separate commodities traded on U.S. exchanges, with the exception of aluminum, nickel, and zinc.
S&P Global Ex-U.S. Property Index: Measures the investable universe of publicly traded property companies domiciled in developed and emerging markets excluding the U.S. The companies included are engaged in real estate related activities such as property ownership, management, development, rental and investment
MSCI US REIT Index: A free float-adjusted market capitalization weighted index that is comprised of equity Real Estate Investment Trusts (REITs). The index is based on the MSCI USA Investable Market Index (IMI), its parent index, which captures the large, mid and small cap segments of the USA market. With 150 constituents, it represents about 99% of the US REIT universe and securities are classified under the Equity REITs Industry (under the Real Estate Sector) according to the Global Industry Classification Standard (GICS®), have core real estate exposure (i.e., only selected Specialized REITs are eligible) and carry REIT tax status.
Cambridge Associates Private Real Estate Index: Based on data compiled from 1,001 real estate funds (including opportunistic and value-added real estate funds), including fully liquidated partnerships, formed between 1986 and 2017.
S&P Global Infrastructure Index: Designed to track 75 companies from around the world chosen to represent the listed infrastructure industry while maintaining liquidity and tradability. To create diversified exposure, the index includes three distinct infrastructure clusters: energy, transportation, and utilities.
LBMA Gold Price Index: The global benchmark prices for unallocated gold and silver delivered in London. ICE Benchmark Administration Limited (IBA) operates electronic auctions for spot, unallocated London gold and silver, providing a market-based platform for buyers and sellers to trade. The auctions are run at 10:30am and 3:00pm London time for gold and at 12:00pm London time for silver. The final auction prices are published to the market as the LBMA Gold Price AM, the LBMA Gold Price PM and the LBMA Silver Price benchmarks, respectively. The price formation for each auction is in US Dollars.
HFRI Indices: Equally weighted performance indexes, utilized by numerous hedge fund managers as a benchmark for their own hedge funds. The HFRI are broken down into 4 main strategies, each with multiple sub strategies. All single manager HFRI Index constituents are included in the HFRI Fund Weighted Composite, which accounts for over 2200 funds listed on the internal HFR Database.
HFRI Equity Hedge Index: Investment Managers who maintain positions both long and short in primarily equity and equity derivative securities. EH managers would typically maintain at least 50% exposure to, and may in some cases be entirely invested in, equities, both long and short.
HFRI Event Driven Index: Investment Managers who maintain positions in companies currently or prospectively involved in corporate transactions of a wide variety including but not limited to mergers, restructurings, financial distress, tender offers, shareholder buybacks, debt exchanges, security issuance or other capital structure adjustments.
HFRI Relative Value Index: Investment Managers who maintain positions in which the investment thesis is predicated on realization of a valuation discrepancy in the relationship between multiple securities.
HFRI Credit Index: A composite index of strategies trading primarily in credit markets. It is an aggregation of following 7 HFRI sub-strategy indices. HFRI ED: Credit Arbitrage Index, HFRI ED: Distressed/Restructuring Index, HFRI ED: MultiStrategy Index, HFRI RV: Fixed Income-Asset Backed Index, HFRI RV: Fixed Income-Convertible Arbitrage Index, HFRI RV: Fixed Income-Corporate Index, and HFRI RV: Multi-Strategy Index.
HFRX Indices: Equally weighted index across all substrategy and regional indices. Hedge Fund Research, Inc. (HFR) utilizes a UCITSIII compliant methodology to construct the HFRX Hedge Fund Indices. The methodology is based on defined and predetermined rules and objective criteria to select and rebalance components to maximize representation of the Hedge Fund Universe.
HFRX Short Bias Index: Short-Biased strategies employ analytical techniques in which the investment thesis is predicated on assessment of the valuation characteristics on the underlying companies with the goal of identifying overvalued companies. Short Biased strategies may vary the investment level or the level of short exposure over market cycles, but the primary distinguishing characteristic is that the manager maintains consistent short exposure and expects to outperform traditional equity managers in declining equity markets.
HFRX Macro/CTA Index: Macro strategy managers trade a broad range of strategies in which the investment process is predicated on movements in underlying economic variables and the impact these have on equity, fixed income, hard currency and commodity markets. Managers employ a variety of techniques, both discretionary and systematic analysis, combinations of top down and bottom up theses, quantitative and fundamental approaches and long and short-term holding periods.
HFRX Equity Hedge Index: Equity Hedge strategies maintain positions both long and short in primarily equity and equity derivative securities. A wide variety of strategies can range broadly in terms of levels of net exposure, leverage employed, holding period, concentrations of market capitalizations and valuation ranges of typical portfolios. Equity Hedge managers would typically maintain at least 50% and may in some cases be substantially entirely invested in equities, both long and short.
ASSET CLASS DEFINITIONS
Asset class performance was measured using the following benchmarks unless stated otherwise:
U.S. Large Cap Stocks: S&P 500 TR Index
U.S. Small & Micro Cap Stocks: Russell 2000 TR Index
Intl Dev Large Cap Stocks: MSCI EAFE GR Index
Emerging & Frontier Market Stocks: MSCI Emerging Markets GR Index
U.S. Interm-Term Muni Bonds: Bloomberg Barclays 1-10 (1-12 Yr) Muni Bond TR Index
U.S. Interm-Term Bonds: Bloomberg Barclays U.S. Aggregate Bond TR Index
U.S. High Yield Bonds: Bloomberg Barclays U.S. Corporate High Yield TR Index
U.S. Bank Loans: S&P/LSTA U.S. Leveraged Loan Index
Intl Developed Bonds: Bloomberg Barclays Global Aggregate ex-U.S. Index
Emerging & Frontier Market Bonds: JPMorgan EMBI Global Diversified TR Index
U.S. REITs: MSCI U.S. REIT GR Index
Ex U.S. Real Estate Securities: S&P Global Ex-U.S. Property TR Index
Commodity Futures: Bloomberg Commodity TR Index
Midstream Energy: Alerian MLP TR Index
Gold: LBMA Gold Price
U.S. 60/40: 60% S&P 500 TR Index 40% Bloomberg Barclays U.S. Aggregate Bond TR Index
Global 60/40: 60% MSCI ACWI GR Index 40% Bloomberg Barclays Global Aggregate Bond TR Index
DATA DEFINITIONS
Alpha: The excess return generated by an active manager or fund relative to its benchmark.
Bear Market: A bear market is a condition in which securities prices fall and widespread pessimism causes the stock market’s downward spiral to be self-sustaining. Although figures vary, a downturn of 20 percent or more from a peak in multiple broad market indexes, such as the Dow Jones Industrial Average (DJIA) or Standard & Poor’s 500 Index (S&P 500), over a two-month period is considered an entry into a bear market.
Bull Market: A bull market is the condition of a financial market of a group of securities in which prices are rising or are expected to rise. The term “bull market” is most often used to refer to the stock market but can be applied to anything that is traded, such as bonds, real estate, currencies and commodities. Because prices of securities rise and fall essentially continuously during trading, the term “bull market” is typically reserved for extended periods in which a large portion of security prices are rising.
Credit Spread: A credit spread is the difference in yield between a US Treasury bond and a debt security with the same maturity but of lesser quality.
Default Rate: The default rate is most commonly referred to as the percentage of loans that have been charged off after a prolonged period of missed payments.
Excess Returns: A security’s return minus the return from another security in the same time period.
Full Employment: The condition in which virtually all who are able and willing to work are employed.
Implied Volatility: The estimated volatility of a security’s price. In general, implied volatility increases when the market is bearish and decreases when the market is bullish. This is due to the common belief that bearish markets are more risky than bullish markets.
Large Cap: Sometimes “big cap”, refers to a company with a market capitalization value of more than $10 billion. Large cap is a shortened version of the term “large market capitalization.” Market capitalization is calculated by multiplying the number of a company’s shares outstanding by its stock price per share.
Long/Short Equity: Long-short portfolios hold sizeable stakes in both long and short positions in equities and related derivatives. Some funds that fall into this category will shift their exposure to long and short positions depending on their macro outlook or the opportunities they uncover through bottom-up research. Some funds may simply hedge long stock positions through exchange traded funds or derivatives. At least 75% of the assets are in equity securities or derivatives.
Price-to-Earnings (P/E) Ratio: The price-earnings ratio (P/E Ratio) is the ratio for valuing a company that measures its current share price relative to its per-share earnings. The price-earnings ratio can be calculated as: Market Value per Share/Earnings per Share.
Price-to-Book (P/B) Ratio: The price-to-book ratio (P/B Ratio) is a ratio used to compare a stock’s market value to its book value. It is calculated by dividing the current closing price of the stock by the latest quarter’s book value per share. Also known as the “price-equity ratio.
Sharpe Ratio: The ratio is the average return earned in excess of the risk-free rate per unit of volatility or total risk. It also known as the Reward-to-volatility Ratio.
Shiller P/E: Valuation measure that takes into consideration the price and cyclically adjusted earnings of a security, adjusted for inflation.
Small Cap: Small cap stocks are generally defined as the stock of publicly traded companies that have a market capitalization ranging from $300 million to about $2 billion. Small cap stock companies often have a high stock price. It’s the number of available shares that make them “small.”
Spread Changes: Changes in the spread between Treasury securities and non-Treasury securities that are identical in all respects except for quality rating.
Standard Deviation: Measures the historical dispersion of a security, fund or index around an average. Investors use standard deviation to measure expected risk or volatility, and a higher standard deviation means the security has tended to show higher volatility or price swings in the past.
Yield: The income produced by an investment, typically calculated as the interest received annually divided by the investment’s price.
Yield-to-Duration: A ratio used in fixed income investing to compare the amount of return (yield to maturity) an investor is receiving per unit of duration or interest rate risk.
Z-score: A Z-score is a numerical measurement of a value’s relationship to the mean in a group of values. A Z-score of 0 represents the score as identical to the mean score. Positive and negative scores reflect the number of standard deviations that the score is either above or below the mean, respectively.