

Economic Calendar

Reflation Expected to Continue for 1H21

2Q21 Expected to See Fastest Acceleration in Y/Y Growth & Inflation of Recovery

Weekly Asset Class Returns

Global Manufacturing Accelerated Further in March

Vaccine Distribution in the U.S.

Continued Improvement in Leading Indicators in March

U.S. Unemployment Claims & Equity Drawdowns

Global Inflation to Pick Up in Coming Months Due to Base Effects

Current Inflation is Low, But Forward-Looking Indicators Suggest a Pickup

TIPS Breakevens (Implied Inflation) Approaching 2.5%

Long-Term Real Yields Over Time

Policymaker vs. Market Rate Expectations

Fed Balance Sheet: March Sees a ~$160Bn 4-Week Change

Equity Returns

S&P 500 vs. Top 5 Constituents

Global Earnings Calendar

Sales & Earnings to Improve Against Weaker Comps in 2Q & 3Q 2021

S&P 500 & Implied Volatility

Volatility is a Feature of the Stock Market, Not a Bug

U.S. Equity Valuations Are at Extreme Levels

Cyclically-Adjusted P/E (CAPE) Multiples by Country

Sentiment Back Up after Slight Drop in Early March

COVID-19 Crisis Accelerated Growth’s Dominance vs. Value; Reopening is Reversing Trend

U.S. Growth Stocks Substantially More Expensive than Value Relative to Earnings

EM Equities Remain Relatively Cheap vs. Developed Markets

In the S&P 500, Tech & Cons Discretionary Squeezed Out Traditional Value Sectors Like Energy & Financials with Substantial Mean Reversion Potential

IPO Outperformance Slowed Down in March

Fixed Income & Credit Returns

Treasury Yields: Keep the Recent Rise in Context

Treasury Yield Curve Continues to Steepen…

Treasury Spreads: 5s/30s Signaling Rising Inflation Risk

Muni-Treasury Ratio: The Battle Between Risks & Increased Desire for Tax Exemption

U.S. 10-Yr Yield Jumps while 30-Yr FRM Remains Steady

Credit Spreads Tightening Across Sectors, Near Lows

Credit Spreads Tighten Further, Nearing Records

High Yield to IG Muni Spreads Tighten Further

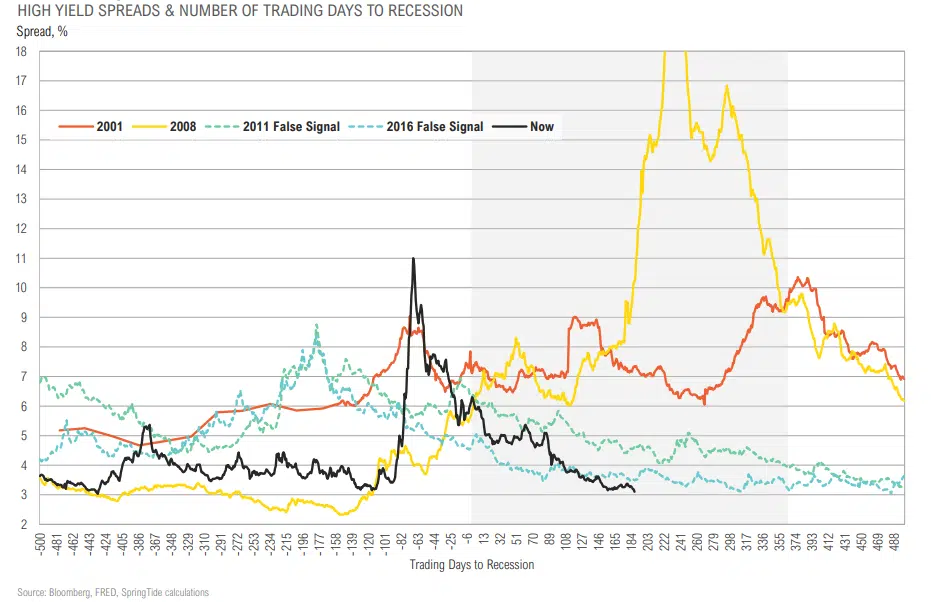
High Yield Spreads Through the COVID-19 Crisis: Managers had ~90 days to Deploy
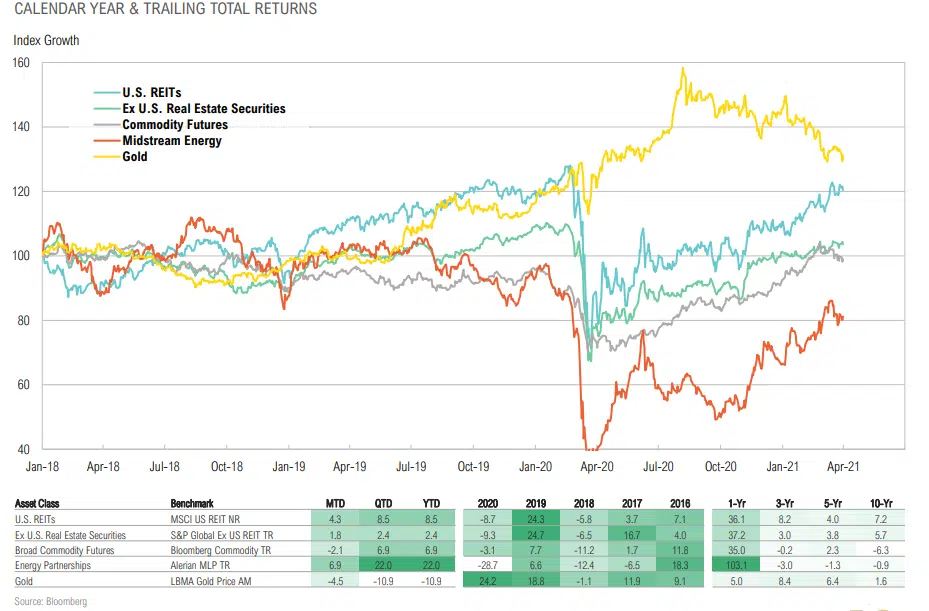
Real Assets Returns
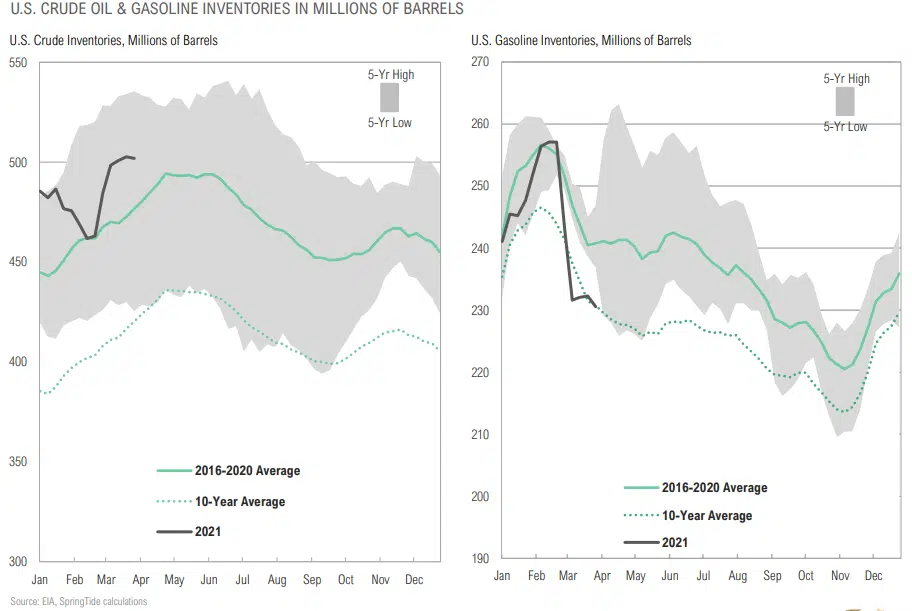
Gas Inventories Dropped to 10-Year Average
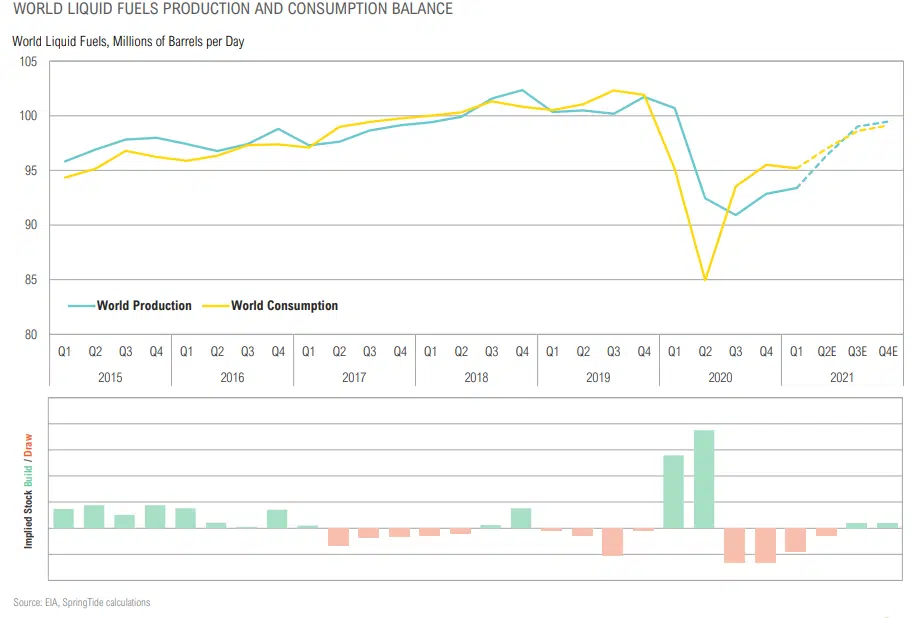
Any Snapback in Energy Consumption Could Outpace Production
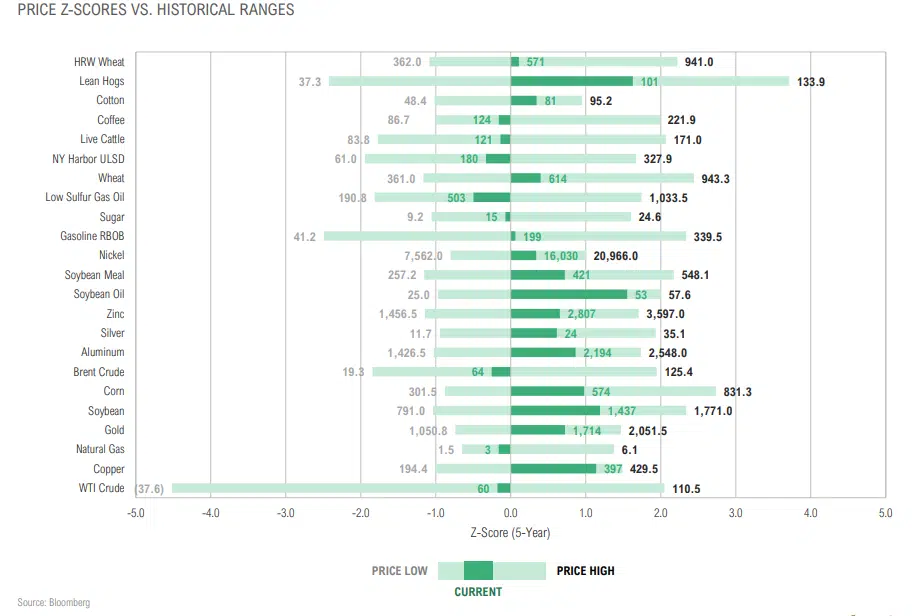
Putting the Rally in Commodities in Context
Gold Correction Explained by Short-Term Increase in Real Yields

Opportunistic Returns

Average Closed-End Fund Discount Back Above Median

Discounts Narrowed Across All CEF Sectors in March

U.S. Dollar Index

Growing Twin Deficit Remains a Major Headwind for USD

Futures Spec Positioning

Copper/Gold Ratio: Potential Local High

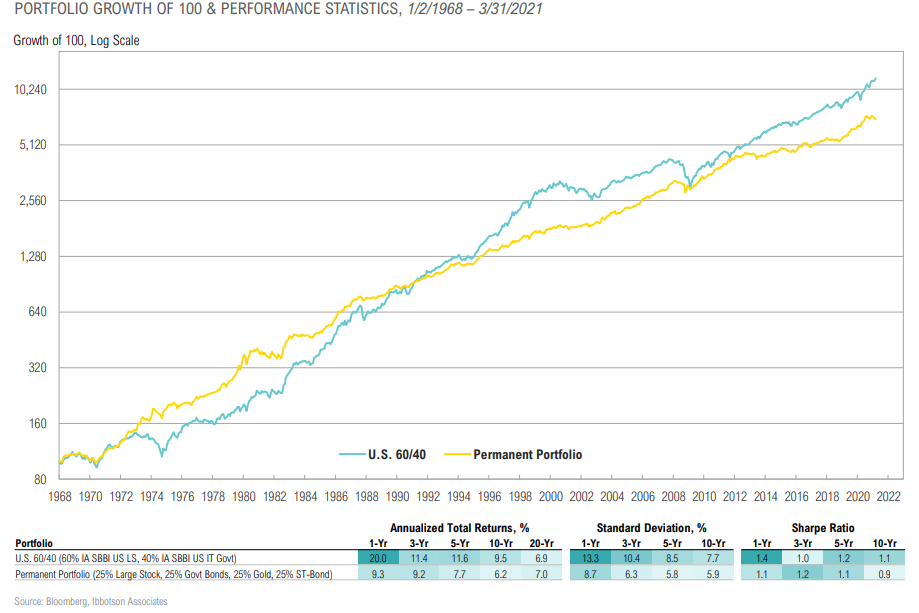
Expected Returns for Passive “60/40” Portfolio Near All-Time Low

The Case for a Structural Change to Strategic 60/40 Allocations
Index Definitions
S&P 500 Index: Widely regarded as the best single gauge of the U.S. equities market. The index includes a representative sample of 500 leading companies in leading industries of the U.S. economy. The S&P 500 Index focuses on the largecap segment of the market; however, since it includes a significant portion of the total value of the market, it also represents the market.
MSCI ACWI: (ACWI: All Country World Index) a free float-adjusted market capitalization weighted index that is designed to measure the equity market performance of developed and emerging markets.
MSCI EAFE Index: (EAFE: Europe, Australasia, Far East) a free float-adjusted market capitalization index that is designed to measure the equity market performance of developed markets, excluding the US & Canada.
MSCI EAFE Small Cap Index: (EAFE: Europe, Australasia, Far East) a free floatadjusted market capitalization index that is designed to measure the small cap equity market performance of developed markets, excluding the US & Canada.
MSCI EM Index: A free float-adjusted market capitalization index that is designed to measure equity market performance in the global emerging markets.
Russell 1000 Index: Measures the performance of the 1,000 largest companies in the Russell 3000.
Russell 2000 Index: Measures the performance of the 2,000 smallest companies in the Russell 3000 Index.
Russell 3000 Index: Measures the performance of the 3,000 largest U.S. companies based on total market capitalization.
Cambridge Associates U.S. Global Buyout and Growth Index: Based on data compiled from 1,768 global (U.S. & ex – U.S.) buyout and growth equity funds, including fully liquidated partnerships, formed between 1986 and 2013.
Cambridge Associates Private Equity Index: Based on data compiled from 1,468 U.S. private equity funds (buyout, growth equity, private equity energy and subordinated capital funds), including fully liquidated partnerships, formed between 1986 and 2017.
Cambridge Associates Venture Capital Index: Based on data compiled from 1,807 US venture capital funds (1,161 early stage, 210 late & expansion stage, and 436 multi-stage funds), including fully liquidated partnerships, formed between 1981 and 2018.
Bloomberg Barclays U.S. Aggregate Bond Index: A broad-based flagship benchmark that measures the investment grade, US dollar-denominated, fixedrate taxable bond market. The index includes Treasuries, government-related and corporate securities, MBS (agency fixed-rate pass-throughs), ABS and CMBS (agency and non-agency).
Bloomberg Barclays Global Aggregate Index: A multi-currency measure of global investment grade debt from twenty-four local currency markets. This benchmark includes treasury, government-related, corporate and securitized fixed-rate bonds from both developed and emerging markets issuers.
Bloomberg Barclays Global Aggregate ex-USD Index: A multi-currency measure of investment grade debt from 24 local currency markets. This benchmark includes treasury, government-related, corporate and securitized fixed-rate bonds from both developed and emerging markets issuers. Bonds issued in USD are excluded.
Bloomberg Barclays Municipal Index: Consists of a broad selection of investment- grade general obligation and revenue bonds of maturities ranging from one year to 30 years. It is an unmanaged index representative of the taxexempt bond market.
Bloomberg Barclays US High Yield Index: Covers the universe of fixed rate, noninvestment grade debt. Eurobonds and debt issues from countries designated as emerging markets (sovereign rating of Baa1/BBB+/BBB+ and below using the middle of Moody’s, S&P, and Fitch) are excluded, but Canadian and global bonds (SEC registered) of issuers in non-EMG countries are included.
Index Definitions
Bloomberg Barclays 1-3 Month U.S. Treasury Bill Index: Includes all publicly issued zero-coupon US Treasury Bills that have a remaining maturity of less than 3 months and more than 1 month, are rated investment grade, and have $250 million or more of outstanding face value. In addition, the securities must be denominated in U.S. dollars and must be fixed rate and non-convertible.
J.P. Morgan Emerging Market Bond Global Index (EMBI): Includes U.S. dollar denominated Brady bonds, Eurobonds, traded loans and local market debt instruments issued by sovereign and quasi-sovereign entities.
Alerian MLP Index: A composite of the 50 most prominent energy Master Limited Partnerships (MLPs) that provides investors with an unbiased, comprehensive benchmark for the asset class.
Bloomberg Commodity Index: Composed of futures contracts on physical commodities and represents twenty two separate commodities traded on U.S. exchanges, with the exception of aluminum, nickel, and zinc.
S&P Global Ex-U.S. Property Index: Measures the investable universe of publicly traded property companies domiciled in developed and emerging markets excluding the U.S. The companies included are engaged in real estate related activities such as property ownership, management, development, rental and investment.
MSCI US REIT Index: A free float-adjusted market capitalization weighted index that is comprised of equity Real Estate Investment Trusts (REITs). The index is based on the MSCI USA Investable Market Index (IMI), its parent index, which captures the large, mid and small cap segments of the USA market. With 150 constituents, it represents about 99% of the US REIT universe and securities are classified under the Equity REITs Industry (under the Real Estate Sector) according to the Global Industry Classification Standard (GICS®), have core real estate exposure (i.e., only selected Specialized REITs are eligible) and carry REIT tax status.
Cambridge Associates Private Real Estate Index: Based on data compiled from 1,001 real estate funds (including opportunistic and value-added real estate funds), including fully liquidated partnerships, formed between 1986 and 2017.
S&P Global Infrastructure Index: Designed to track 75 companies from around the world chosen to represent the listed infrastructure industry while maintaining liquidity and tradability. To create diversified exposure, the index includes three distinct infrastructure clusters: energy, transportation, and utilities.
LBMA Gold Price Index: The global benchmark prices for unallocated gold and silver delivered in London. ICE Benchmark Administration Limited (IBA) operates electronic auctions for spot, unallocated London gold and silver, providing a market-based platform for buyers and sellers to trade. The auctions are run at 10:30am and 3:00pm London time for gold and at 12:00pm London time for silver. The final auction prices are published to the market as the LBMA Gold Price AM, the LBMA Gold Price PM and the LBMA Silver Price benchmarks, respectively. The price formation for each auction is in US Dollars.
HFRI Indices: Equally weighted performance indexes, utilized by numerous hedge fund managers as a benchmark for their own hedge funds. The HFRI are broken down into 4 main strategies, each with multiple sub strategies. All singlemanager HFRI Index constituents are included in the HFRI Fund Weighted Composite, which accounts for over 2200 funds listed on the internal HFR Database.
HFRI Equity Hedge Index: Investment Managers who maintain positions both long and short in primarily equity and equity derivative securities. EH managers would typically maintain at least 50% exposure to, and may in some cases be entirely invested in, equities, both long and short.
HFRI Event Driven Index: Investment Managers who maintain positions in companies currently or prospectively involved in corporate transactions of a wide variety including but not limited to mergers, restructurings, financial distress, tender offers, shareholder buybacks, debt exchanges, security issuance or other capital structure adjustments.
Index Definitions
HFRI Relative Value Index: Investment Managers who maintain positions in which the investment thesis is predicated on realization of a valuation discrepancy in the relationship between multiple securities.
HFRI Credit Index: A composite index of strategies trading primarily in credit markets. It is an aggregation of following 7 HFRI sub-strategy indices. HFRI ED: Credit Arbitrage Index, HFRI ED: Distressed/Restructuring Index, HFRI ED: MultiStrategy Index, HFRI RV: Fixed Income-Asset Backed Index, HFRI RV: Fixed Income-Convertible Arbitrage Index, HFRI RV: Fixed Income-Corporate Index, and HFRI RV: Multi-Strategy Index.
HFRX Indices: Equally weighted index across all substrategy and regional indices. Hedge Fund Research, Inc. (HFR) utilizes a UCITSIII compliant methodology to construct the HFRX Hedge Fund Indices. The methodology is based on defined and predetermined rules and objective criteria to select and rebalance components to maximize representation of the Hedge Fund Universe.
HFRX Short Bias Index: Short-Biased strategies employ analytical techniques in which the investment thesis is predicated on assessment of the valuation characteristics on the underlying companies with the goal of identifying overvalued companies. Short Biased strategies may vary the investment level or the level of short exposure over market cycles, but the primary distinguishing characteristic is that the manager maintains consistent short exposure and expects to outperform traditional equity managers in declining equity markets.
HFRX Macro/CTA Index: Macro strategy managers trade a broad range of strategies in which the investment process is predicated on movements in underlying economic variables and the impact these have on equity, fixed income, hard currency and commodity markets. Managers employ a variety of techniques, both discretionary and systematic analysis, combinations of top down and bottom up theses, quantitative and fundamental approaches and long and short-term holding periods.
HFRX Equity Hedge Index: Equity Hedge strategies maintain positions both long and short in primarily equity and equity derivative securities. A wide variety of strategies can range broadly in terms of levels of net exposure, leverage employed, holding period, concentrations of market capitalizations and valuation ranges of typical portfolios. Equity Hedge managers would typically maintain at east 50% and may in some cases be substantially entirely invested in equities, both long and short.
ASSET CLASS DEFINITIONS
Asset class performance was measured using the following benchmarks unless stated otherwise:
U.S. Large Cap Stocks: S&P 500 TR Index
U.S. Small & Micro Cap Stocks: Russell 2000 TR Index
Intl Dev Large Cap Stocks: MSCI EAFE GR Index
Emerging & Frontier Market Stocks: MSCI Emerging Markets GR Index
U.S. Interm-Term Muni Bonds: Bloomberg Barclays 1-10 (1-12 Yr) Muni Bond TR Index
U.S. Interm-Term Bonds: Bloomberg Barclays U.S. Aggregate Bond TR Index
U.S. High Yield Bonds: Bloomberg Barclays U.S. Corporate High Yield TR Index
U.S. Bank Loans: S&P/LSTA U.S. Leveraged Loan Index
Intl Developed Bonds: Bloomberg Barclays Global Aggregate ex-U.S. Index
Emerging & Frontier Market Bonds: JPMorgan EMBI Global Diversified TR Index
U.S. REITs: MSCI U.S. REIT GR Index
Ex U.S. Real Estate Securities: S&P Global Ex-U.S. Property TR Index
Commodity Futures: Bloomberg Commodity TR Index
Midstream Energy: Alerian MLP TR Index
Gold: LBMA Gold Price
U.S. 60/40: 60% S&P 500 TR Index 40% Bloomberg Barclays U.S. Aggregate Bond TR Index
Global 60/40: 60% MSCI ACWI GR Index 40% Bloomberg Barclays Global Aggregate Bond TR Index
Data Definitions
Bear Market: A bear market is a condition in which securities prices fall and widespread pessimism causes the stock market’s downward spiral to be self sustaining. Although figures vary, a downturn of 20 percent or more from a peak in multiple broad market indexes, such as the Dow Jones Industrial Average (DJIA) or Standard & Poor’s 500 Index (S&P 500), over a two-month period is considered an entry into a bear market.