Summary
White House
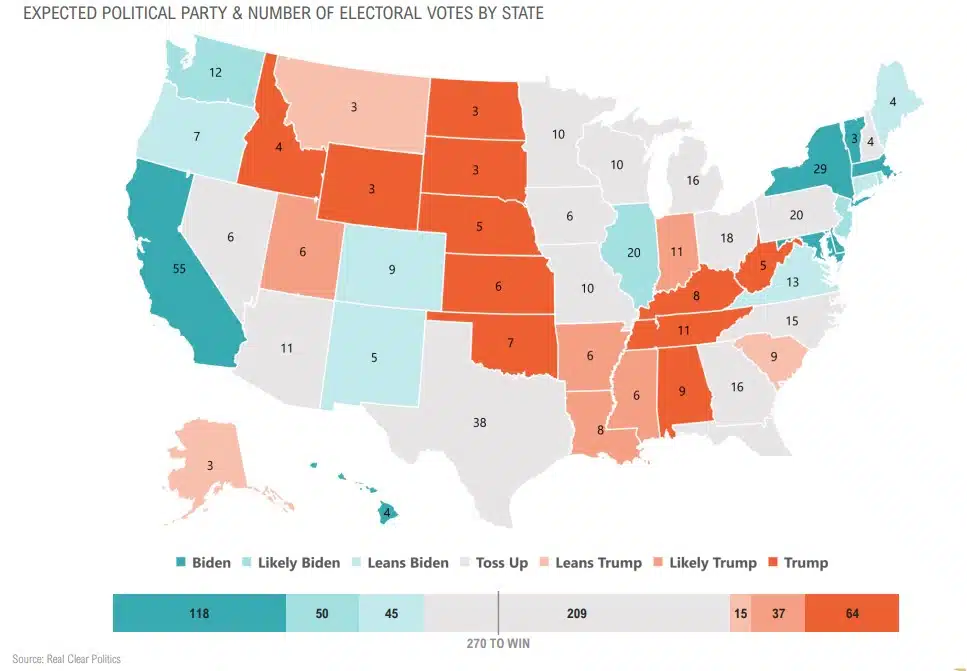
- Biden leading in polls, but 14 states (209/ 39% of electoral votes) still toss ups. slide 5
- “Silent vote” could potentially be more of an issue in 2020 than it was in 2016. slide 6
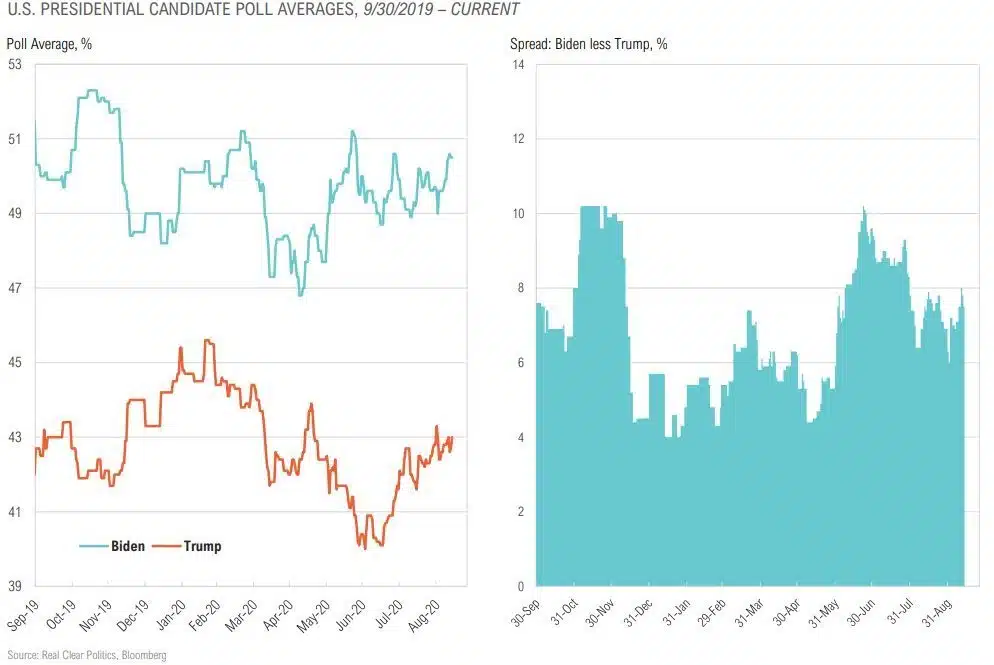
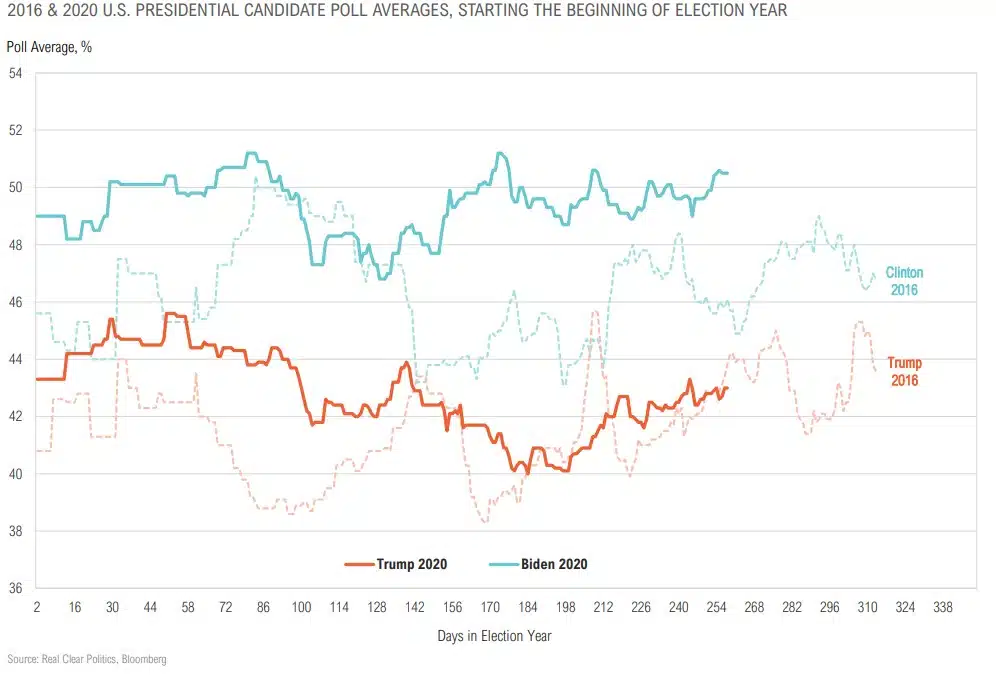
- Biden leading in polls by 7%, unchanged over last week. slide 7
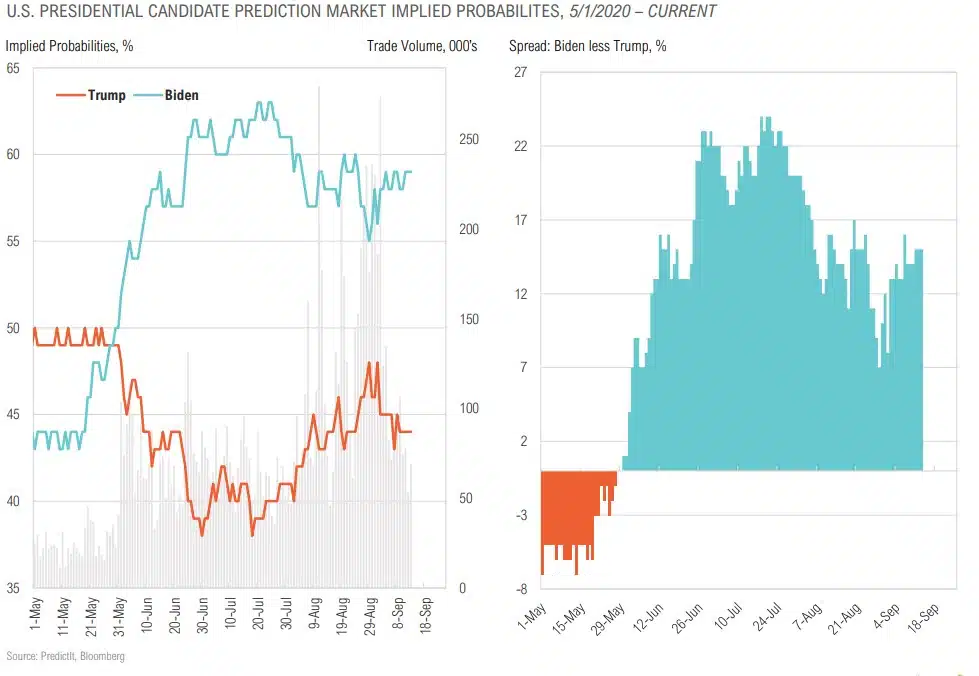
- Biden leading in betting markets by 15%, +1% over last week. slide 9
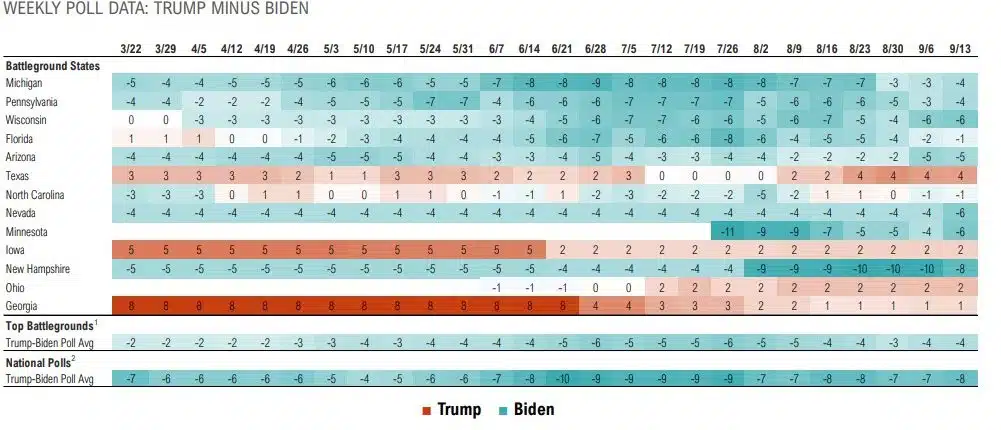
- Trump trailing by 4% in key battlegrounds, unchanged over last week . slide 10
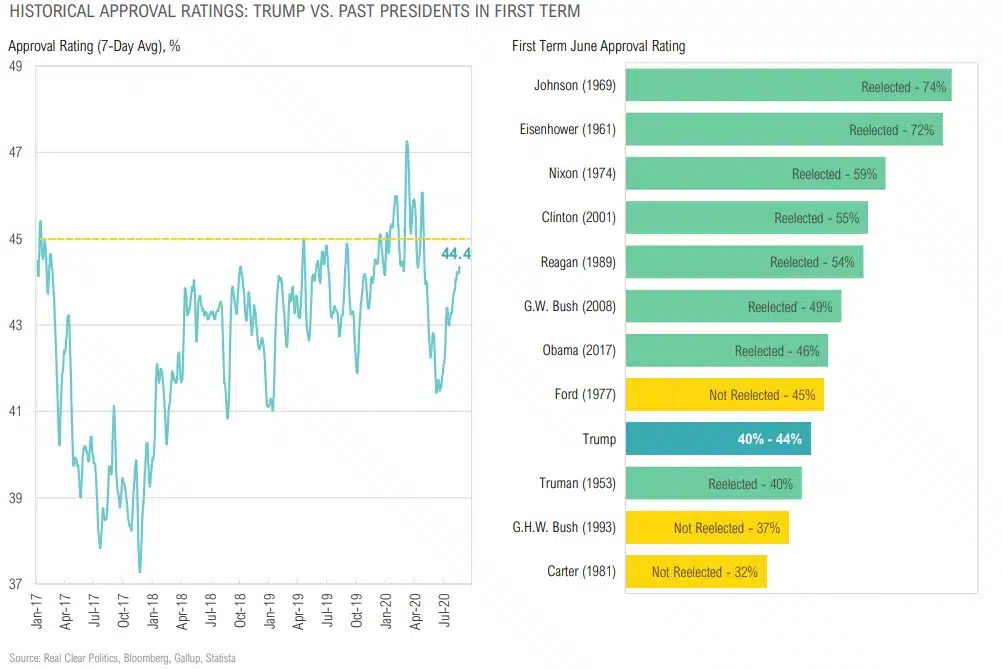
- Trump’s approval rating is 44%, below historically significant 45%. slide 11
- 5-day change in new Covid-19 cases is 159k (vs. 162k last week), a potential tailwind for Trump. slide 12
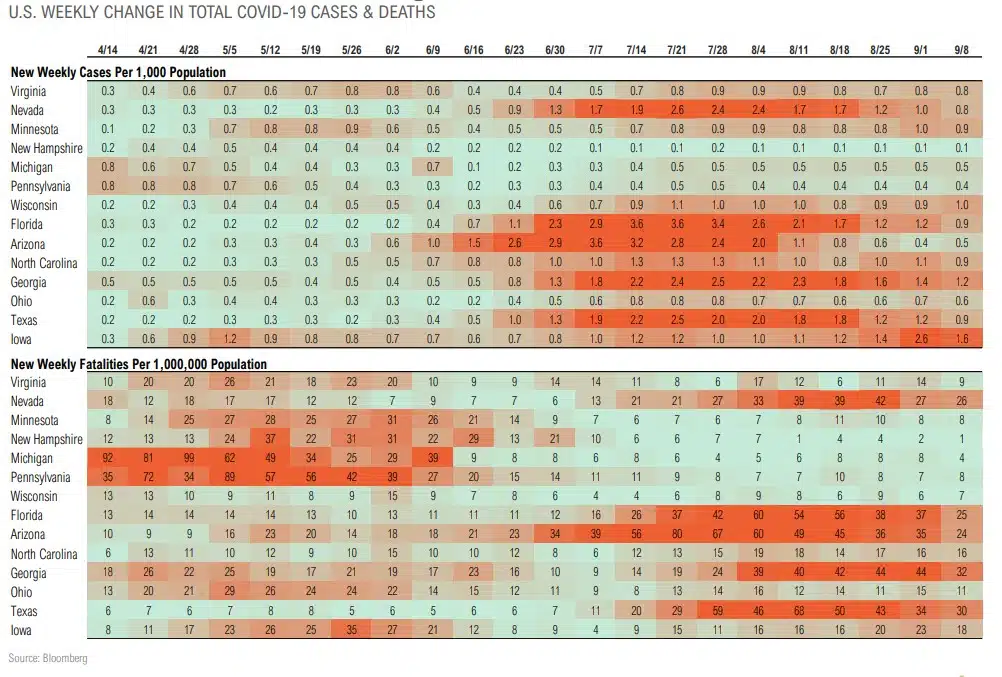
- New Covid-19 cases are trending lower in battlegrounds, a potential tailwind for Trump. slide 13
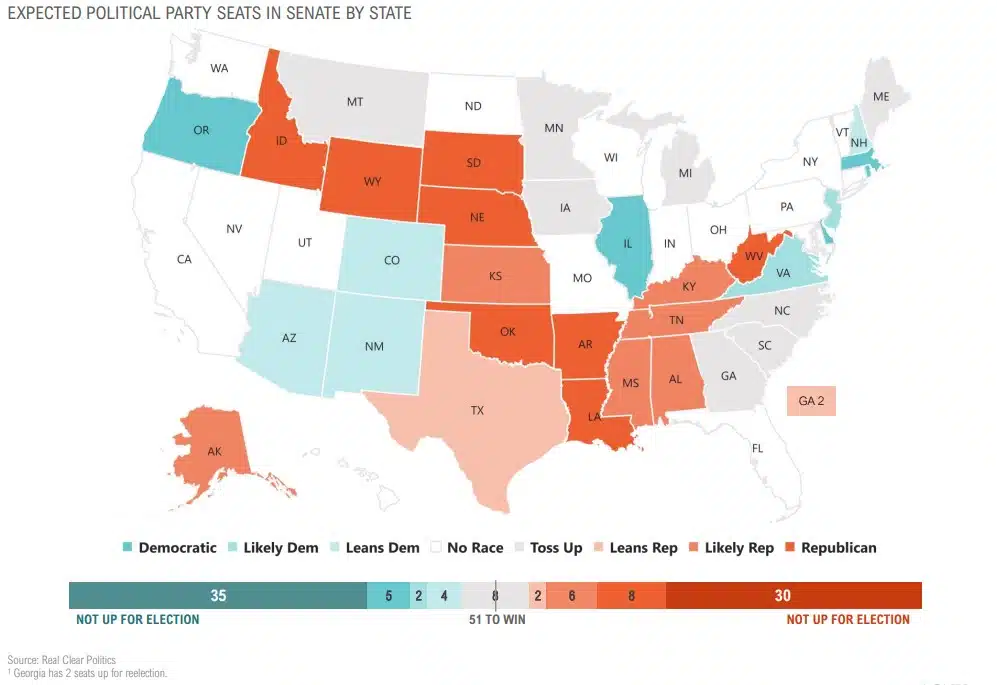
- Republicans with 46 seats “locked or likely” vs. 46 for Democrats, but 8 seats still in play – slide 14
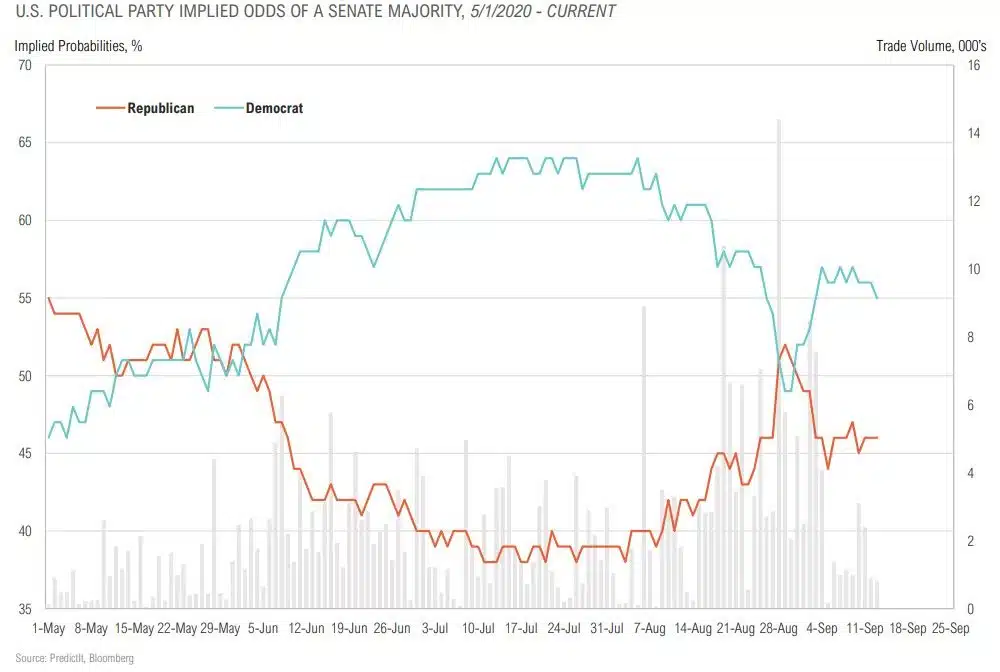
- Democrats leading Senate election race in betting markets by 9%, -1% over last week – slide 15
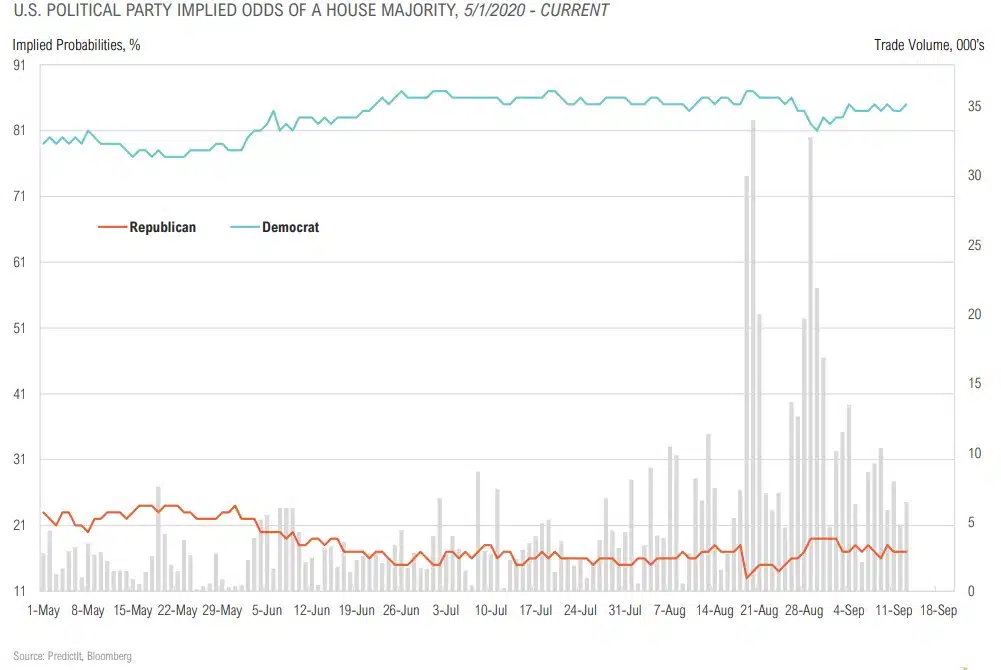
- Democrats winning House is a foregone conclusion per betting markets (leading by 68%) – slide 16
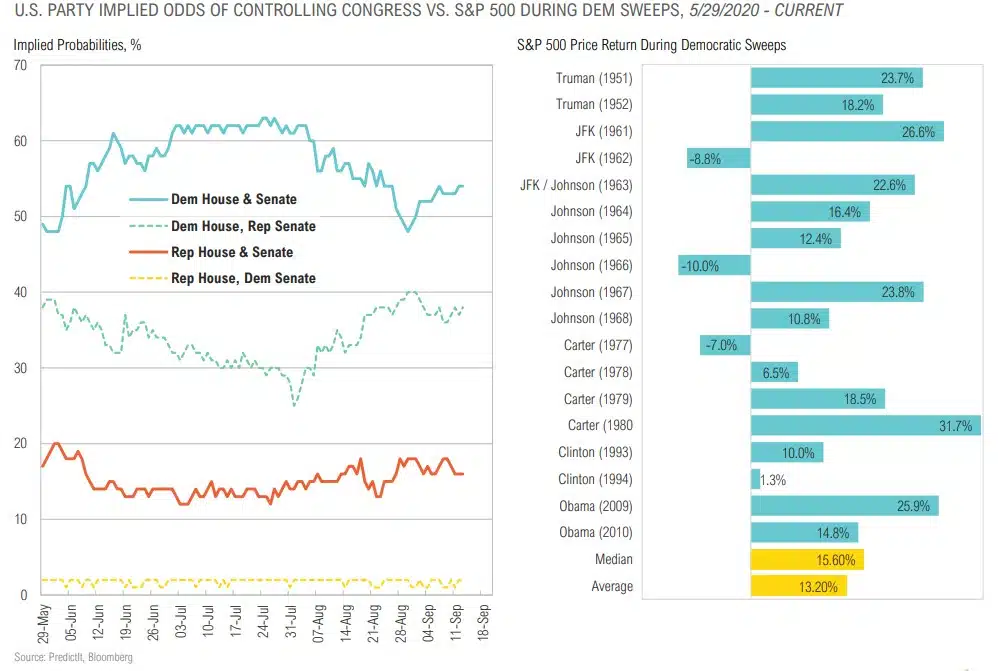
- Democrats have a 54% chance of a “blue sweep” per betting markets, +1% over last week – slide 17

The Battle for the White House
How Big is the Silent Vote?
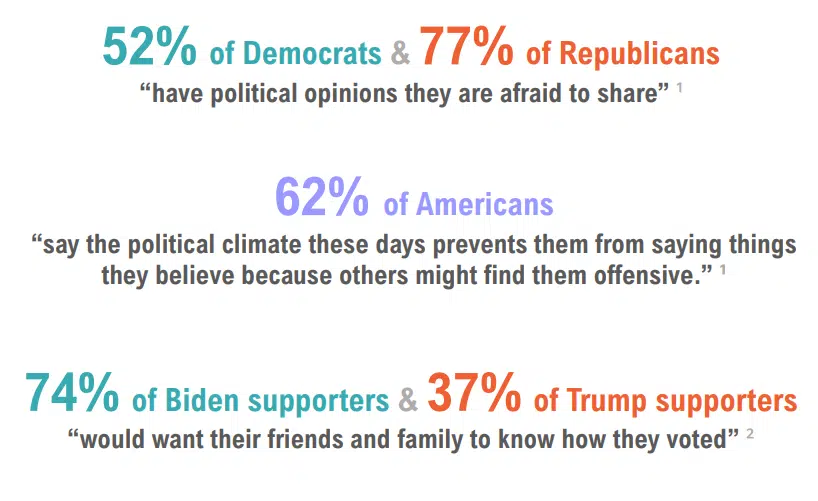
Source: ¹ Cato Institute https://www.cato.org/publications/survey-reports/poll-62-americans-say-they-have-political-views-theyre-afraid-share
² https://www.express.co.uk/news/politics/1292288/US-election-2020-donald-trump-poll-results-democracy-institute-of-america
Biden Leading Trump in Polls
Trump Tracking 2016, Biden Ahead of Clinton, But Not Too Late For Big Swings
Biden Leading Trump in Betting Markets
Trump Trails in Battleground Polls, But By Narrowing Margin

June Approval Rating Tends to Correlate with Re-election Odds
Any Increase in COVID-19 Cases Could Hurt Trump
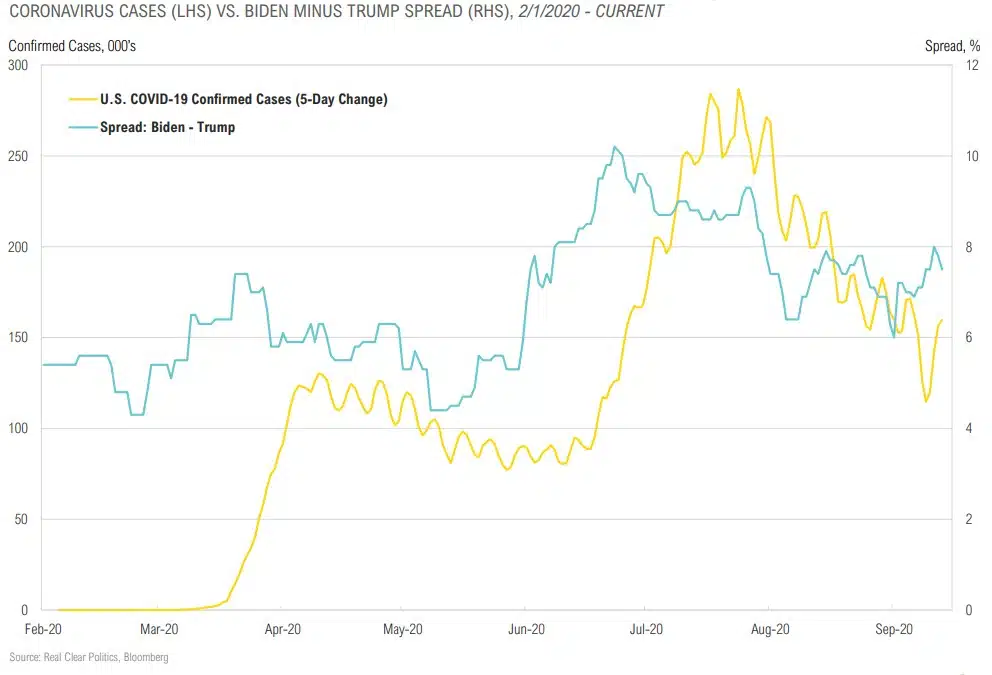
Coronavirus Trends in Battleground States
The Battle for the Senate
Democrats Leading Republicans in Betting Markets
Democrat Win in House is a Foregone Conclusion
“Blue Sweeps” Not Necessarily Bad for Markets
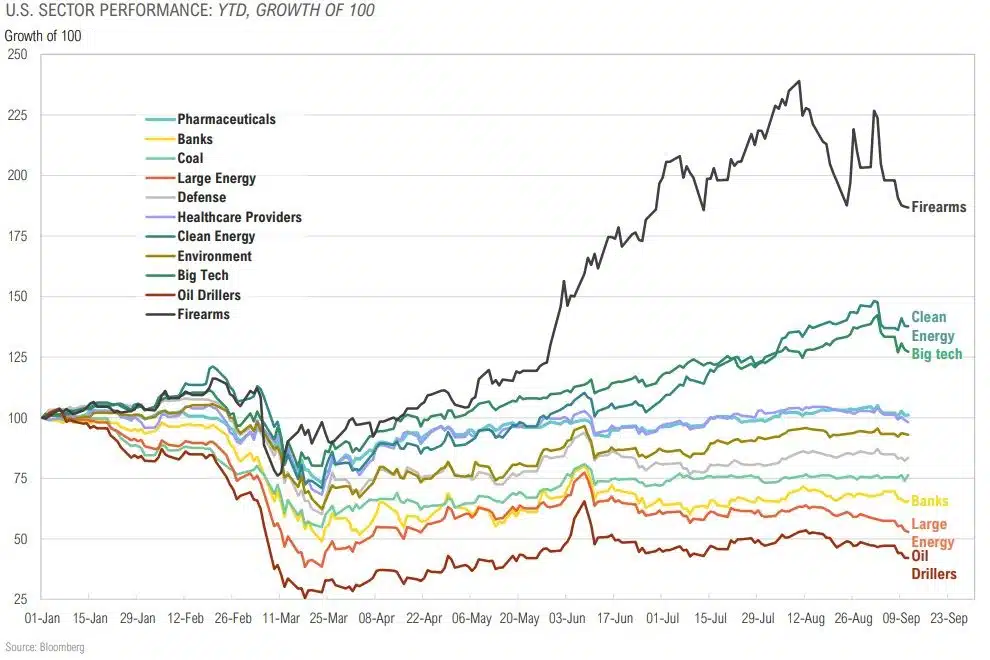
Investor Positioning Into Election: Winners Include Clean Energy, Big Tech and Firearm Stock
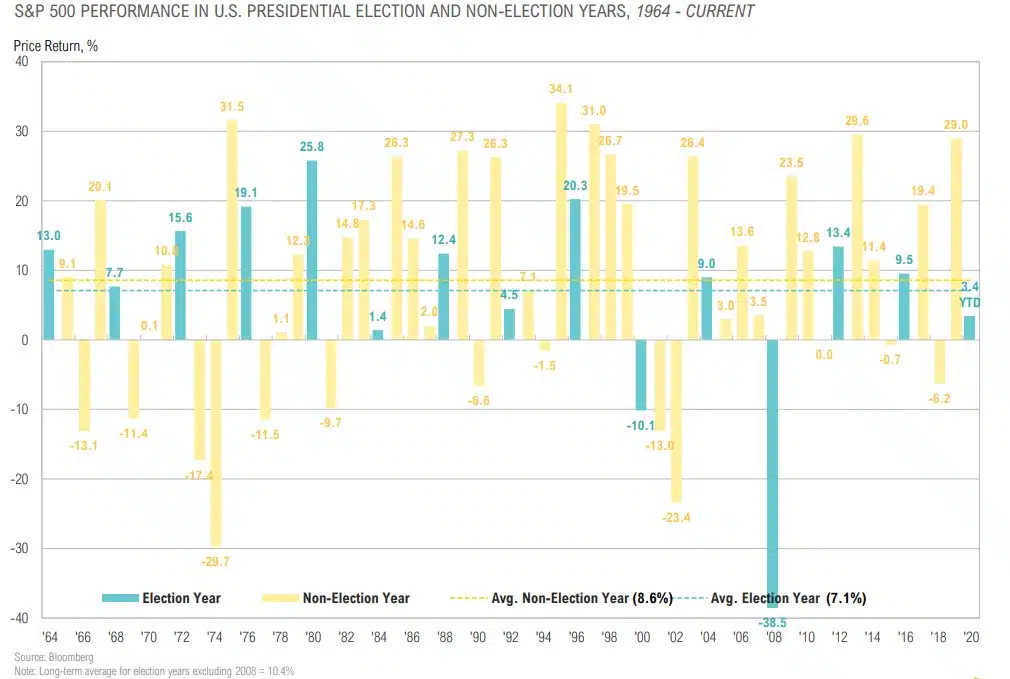
Stocks Back At Election-Year Average
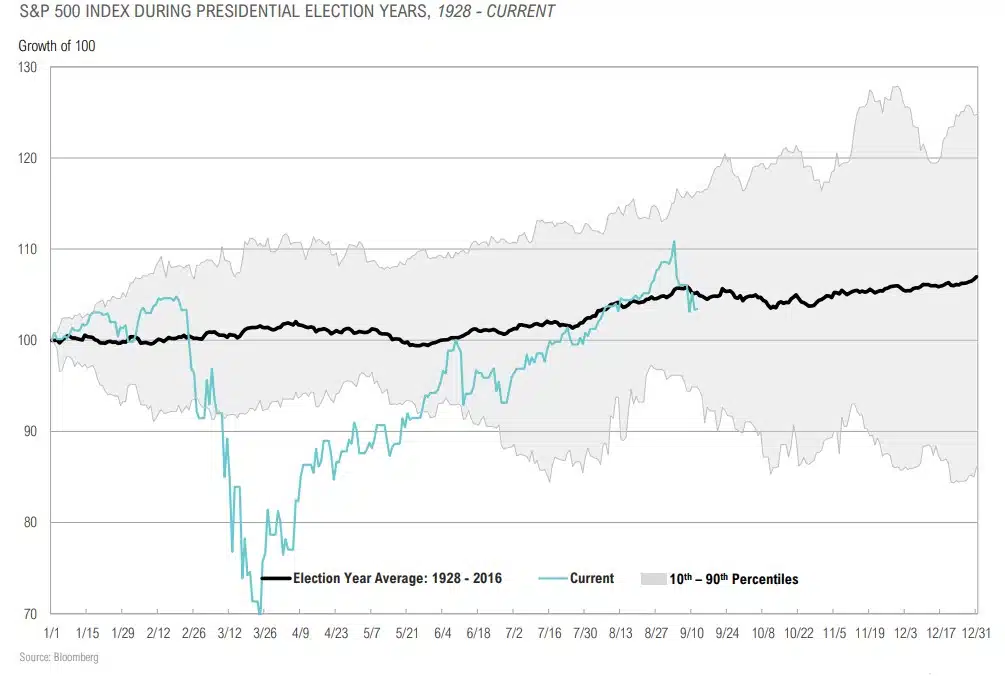
U.S. Large Cap Stocks: 2020 vs. Past Election Years
Tax Policy Under Potential a Biden/Harris Admin
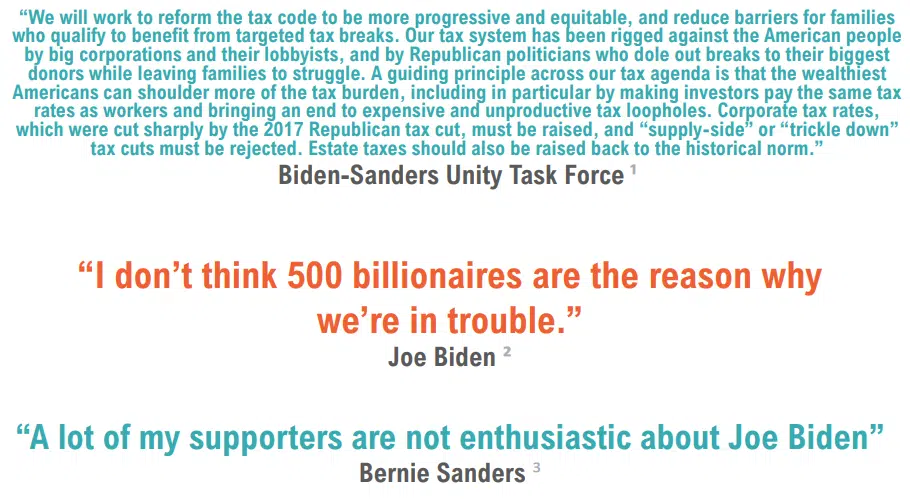
Source: ¹ : https//joebiden.com/wp-content/uploads/2020/08/UNITY-TASK-FORCE-RECOMMENDATIONS.pdf
² https://www.brookings.edu/wp-content/uploads/2018/04/biden-transcript.pdf
³ https://abcnews.go.com/Politics/bernie-sanders-acknowledging-progressive-disagreements-platform-joe-biden/story?id=72396119
Biden/Harris Tax Proposals
- Repealing the Tax Cuts and Jobs Act (TCJA) individual income tax reductions for those earning over $400,000 and restoring the top marginal income tax rate to 39.6 percent from today’s 37 percent. The Section 199A deduction would also be phased out for those earning over $400,000.
- Taxing capital gains at ordinary income tax rates—up from a top rate of 23.8 percent today—for those earning over $1 million. Biden would also eliminate step-up in basis for inherited assets with capital gains, instead taxing those gains at death.
- Capping the value of itemized deductions to 28 percent for those in higher marginal tax brackets and restoring the Pease limitation on itemized deductions for those with taxable income above $400,000.
- Raising the corporate income tax from 21 percent to 28 percent.
- Imposing a 15 percent minimum book tax on corporations with $100 million or greater in income.
- Doubling the tax rate on Global Intangible Low Tax Income (GILTI) earned by foreign subsidiaries of U.S. firms, from 10.5 percent to 21 percent.
- Imposing the 12.4 percent Social Security payroll tax on wage and self-employment income earned above $400,000.
U.S. Large Cap Returns During Select Presidential Term
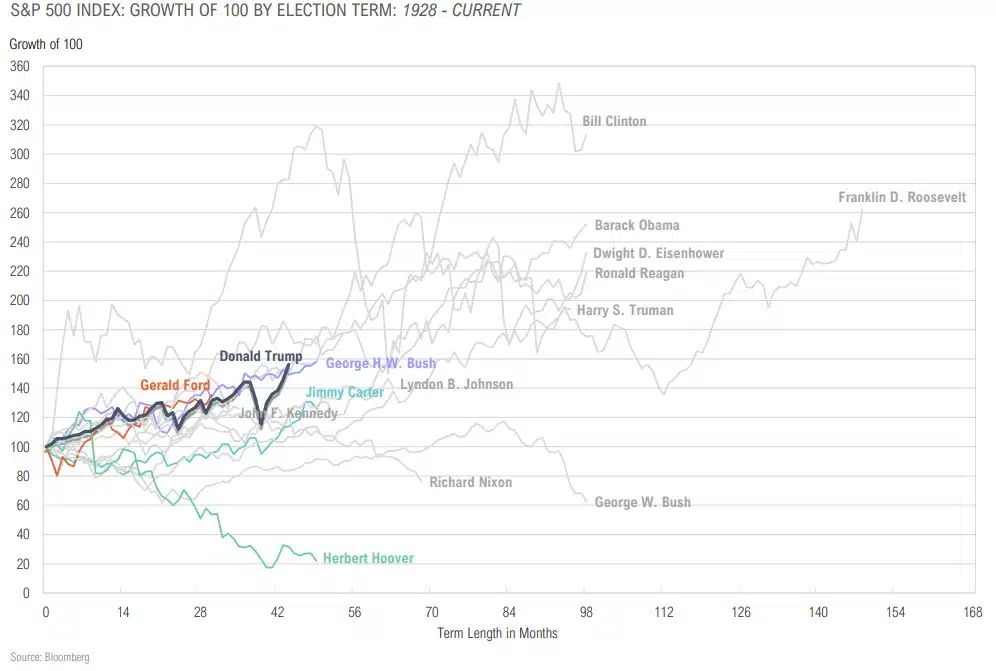
Elections Can Reinforce Trends or Represent Key Inflection Points
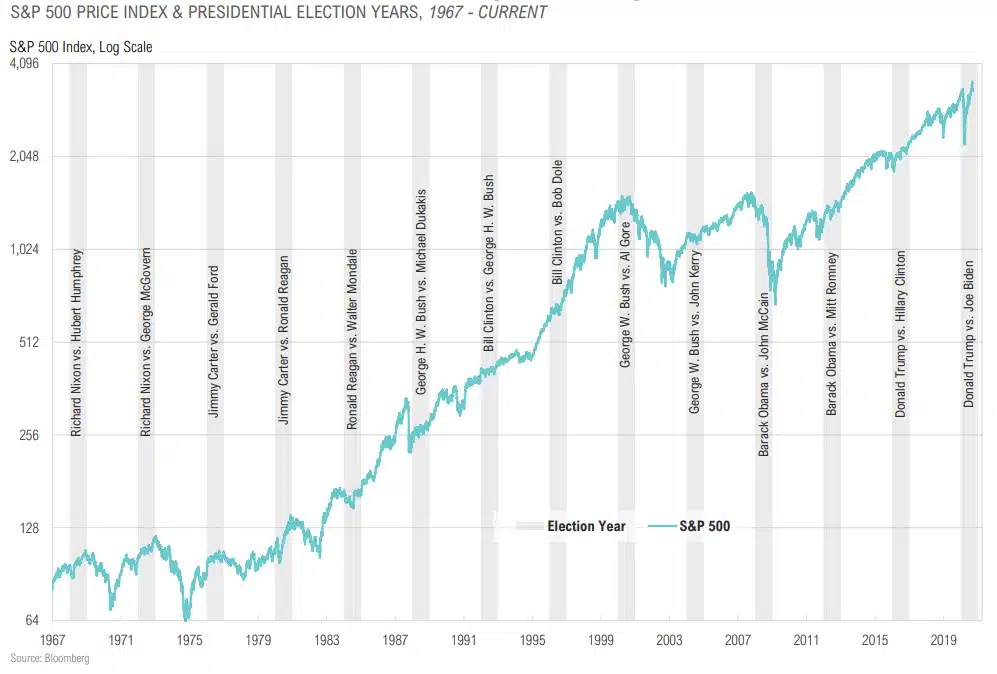
U.S. Large Cap Stocks: 2020 vs. Past Election Years
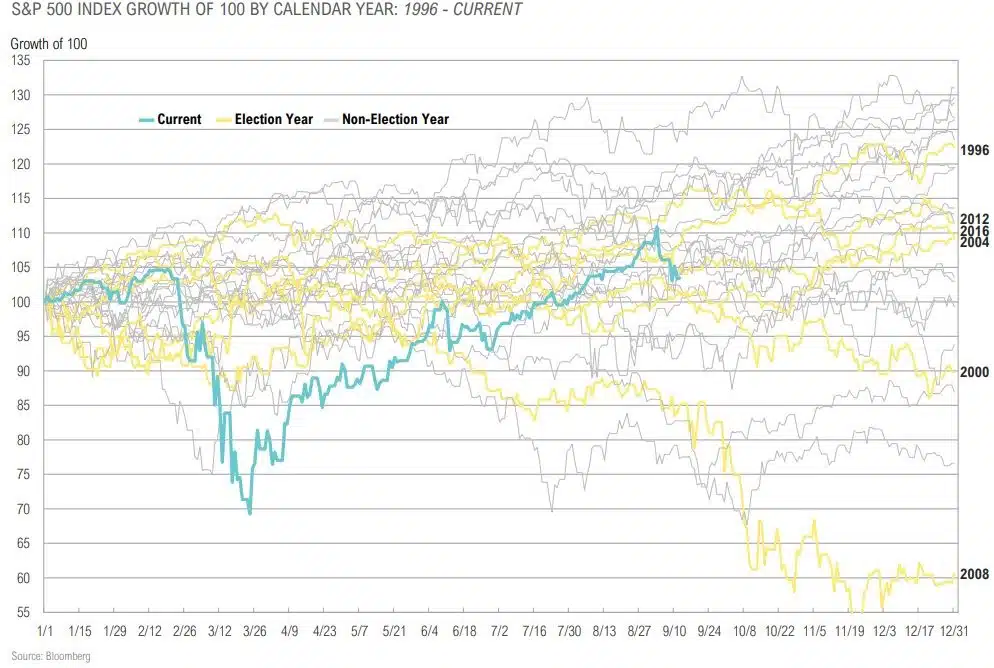
Elections Can Reinforce Trends or Represent Key Inflection Points
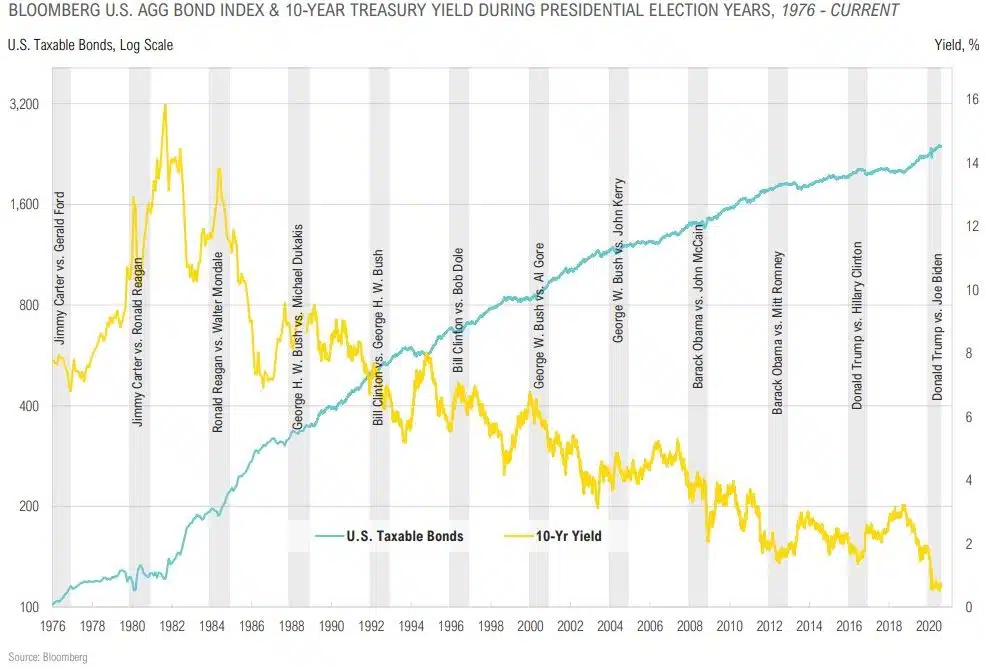
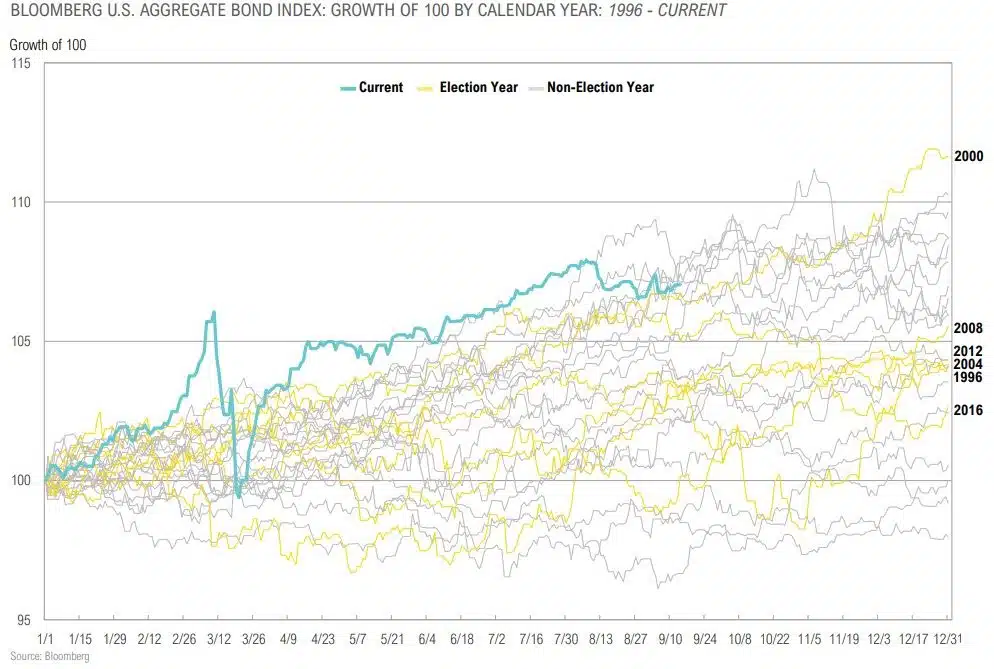
U.S. Investment Grade Bonds: 2020 vs. Past Election Years