SUMMARY
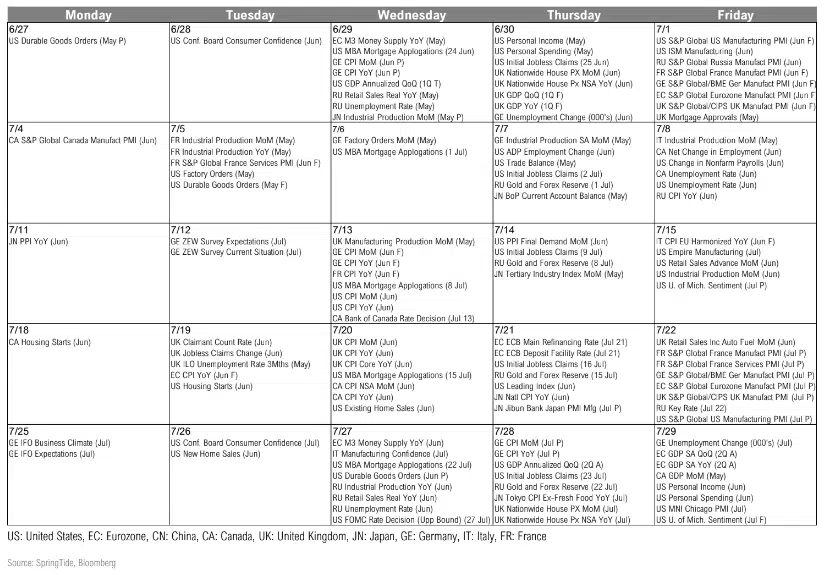
ECONOMIC CALENDAR
GROWTH, INFLATION & POLICY
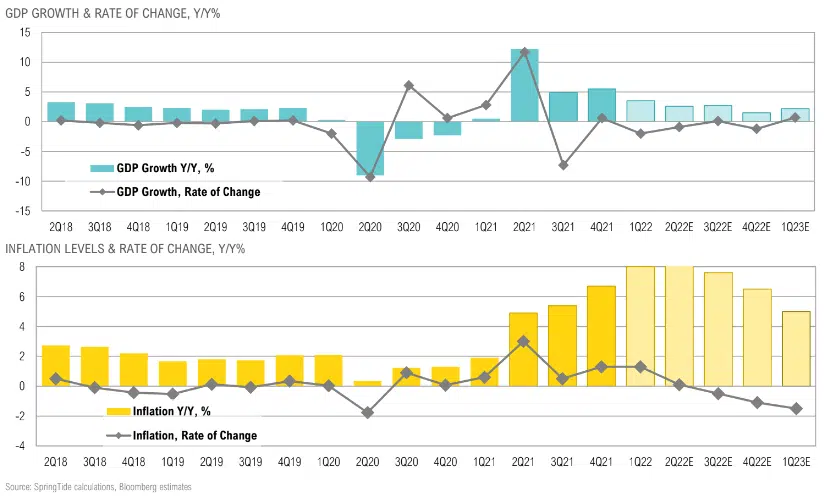
GROWTH & INFLATION CYCLE
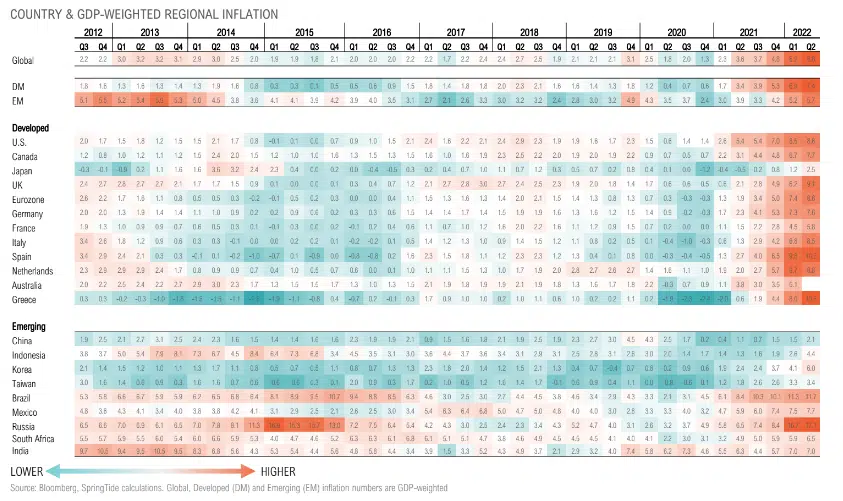
Consensus expected growth and inflation to decelerate in 2022; however, persistent inflation has driven the U.S. economy along a stagflation knife’s-edge
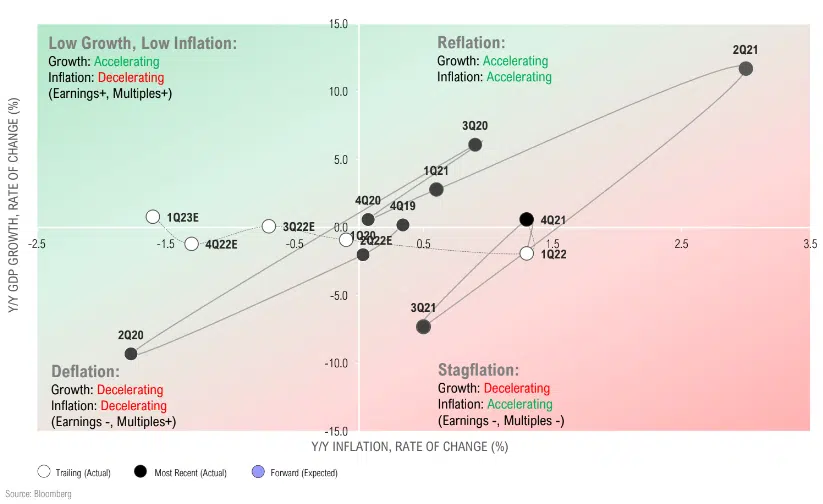
Consensus expected growth and inflation to decelerate in 2022; however, persistent inflation has driven the U.S. economy along a stagflation knife’s-edge
SUMMARY
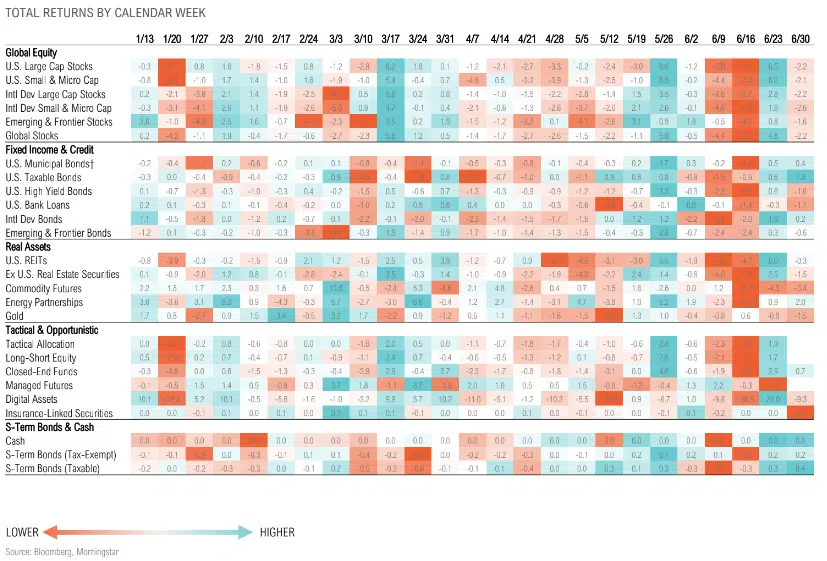
WEEKLY ASSET CLASS RETURNS
GROWTH, INFLATION & POLICY
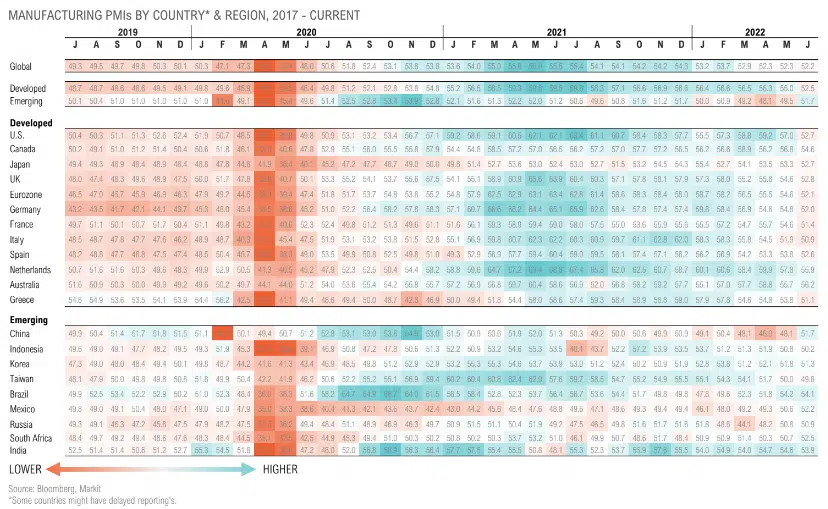
Global manufacturing activity stalled in June; emerging markets rebounded modestly but developed markets slowed further
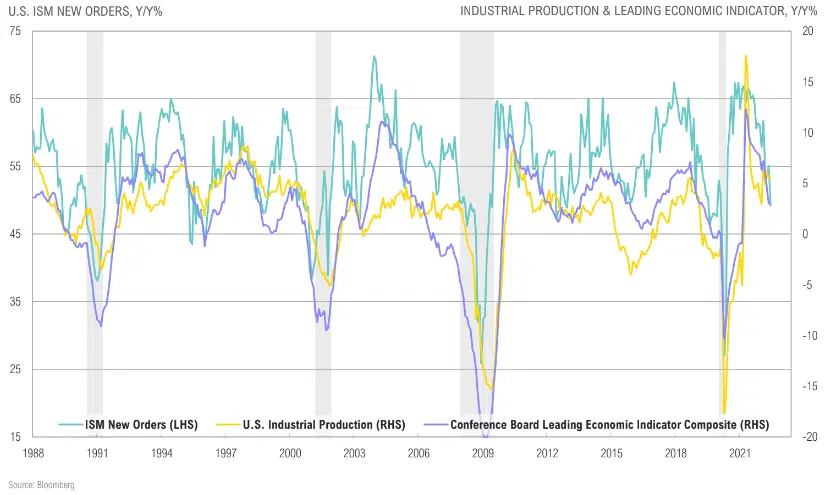
Industrial production and leading indicator growth peaked a year ago, have been slowing since; forward-looking indicators continue to trend lower
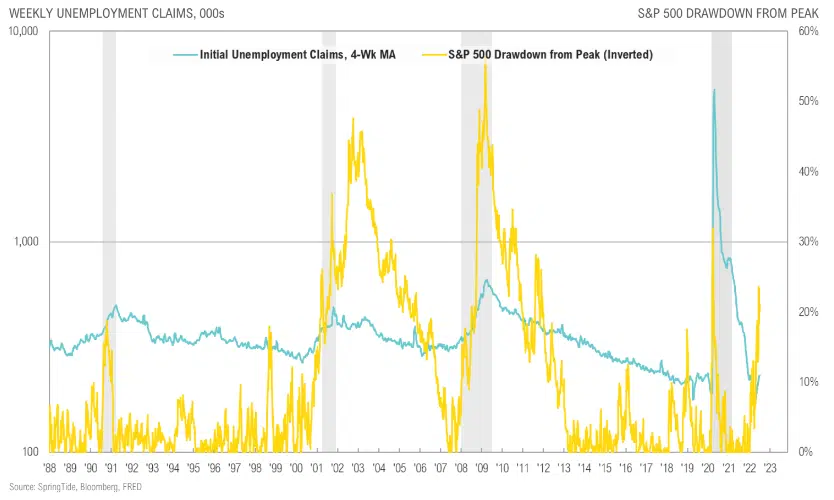
Here we go again? Stocks dropped around 20% from all-time highs signaling potential slowdown; unemployment, which is a lagging indicator, remains low
Pre-Russian invasion, inflation was already at a decade-high due to commodity input costs, labor tightness, housing prices, supply chain bottlenecks, etc. Question now becomes how much does it roll over if some/ all of those issues clear?
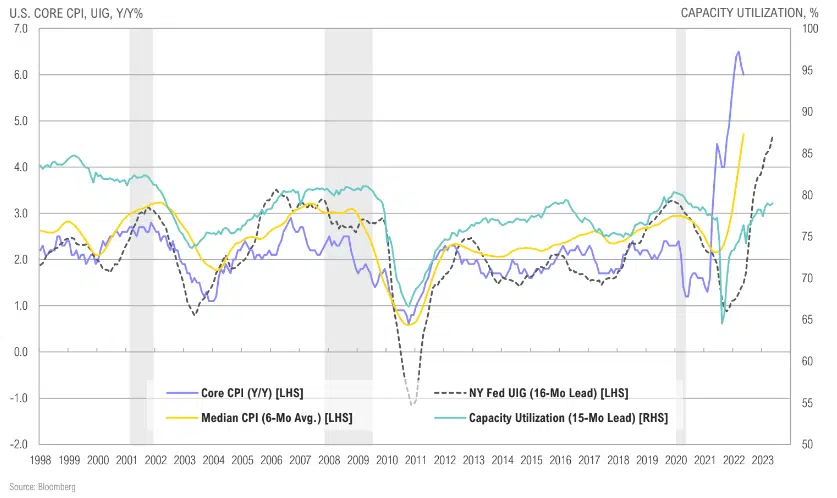
Inflation appears to be peaking on a year-over-year, expected to moderate towards the end of the year; but price pressures remain, we’re are likely not headed back to 2% any time soon
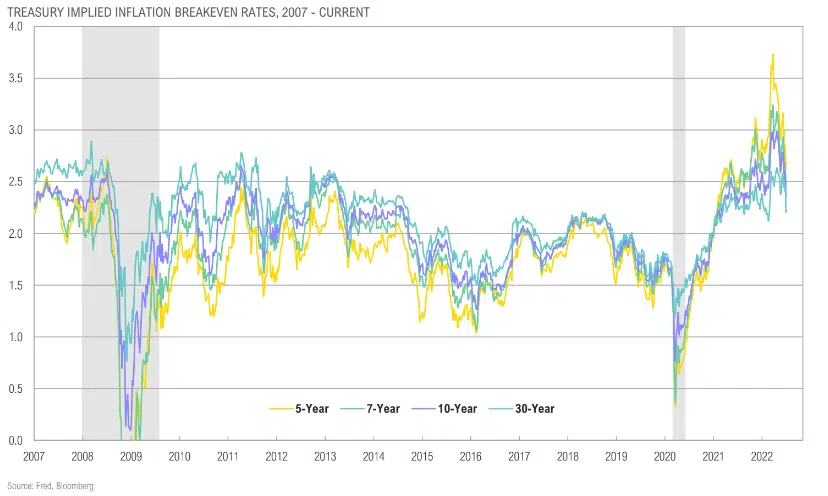
Intermediate-term inflation expectations have eased after breaking out to multi-decade highs
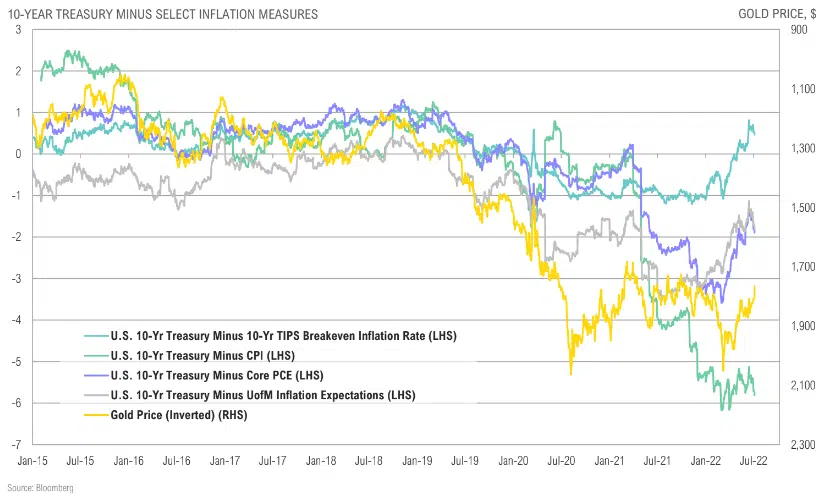
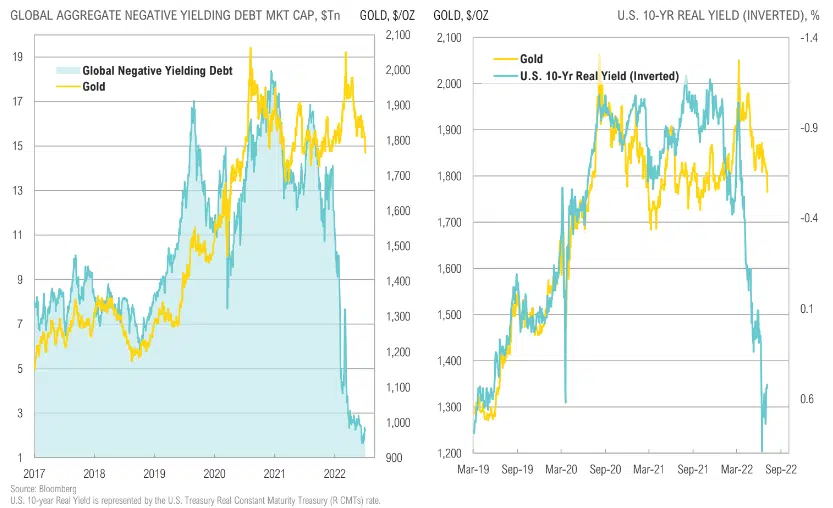
Real yields have remained deeply negative; gold declined in June as interest rates stayed relatively high, but question now becomes can rates rise further without something breaking
Relative rate expectation differences of U.S. vs. Europe and Japan are still dramatic, supporting the U.S. dollar, but note how market now pricing in rate cuts after 2023
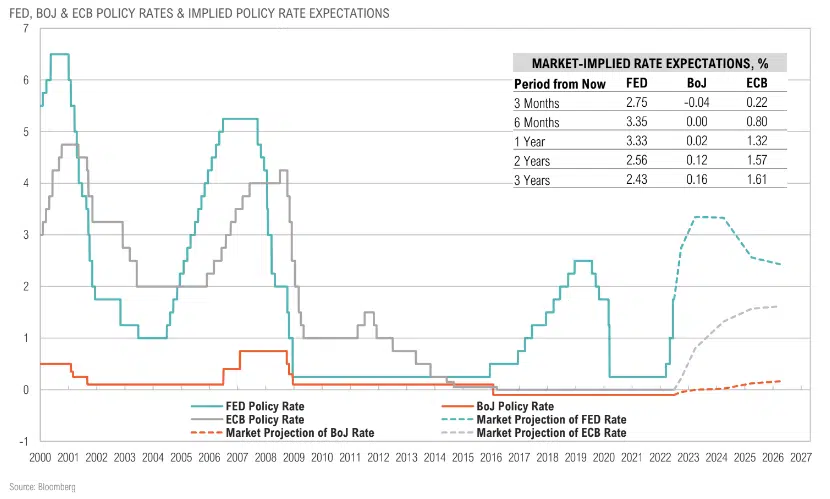
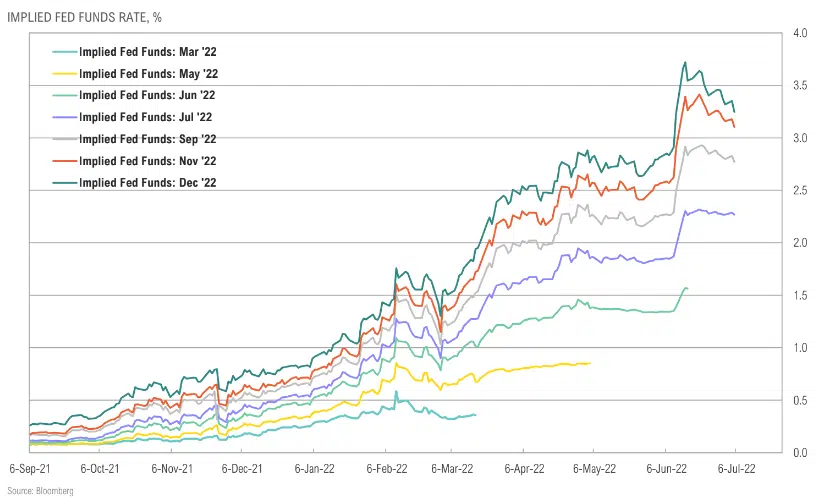
Despite the sell-off in risky assets, the market is still expecting a Fed Funds rate of over 3.0% by the end of the year
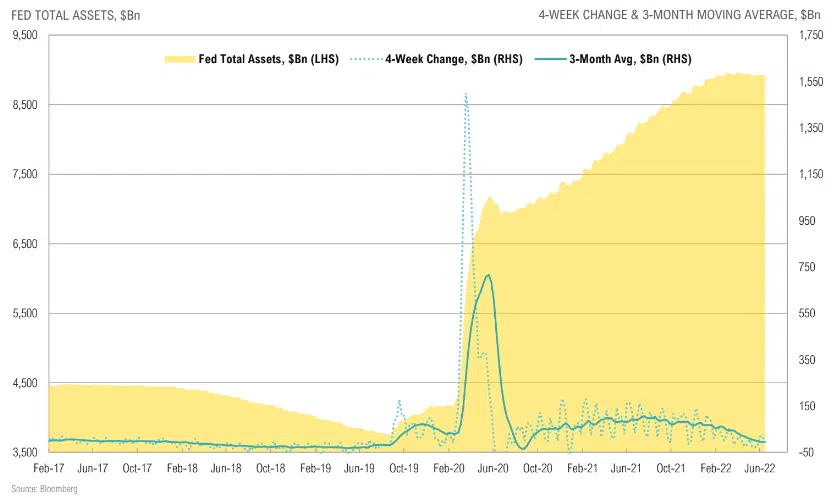
Fed’s planned bond sales ($45 billion/month starting in June) yet to translate to any meaningful reduction in the size of the balance sheet
EQUITY
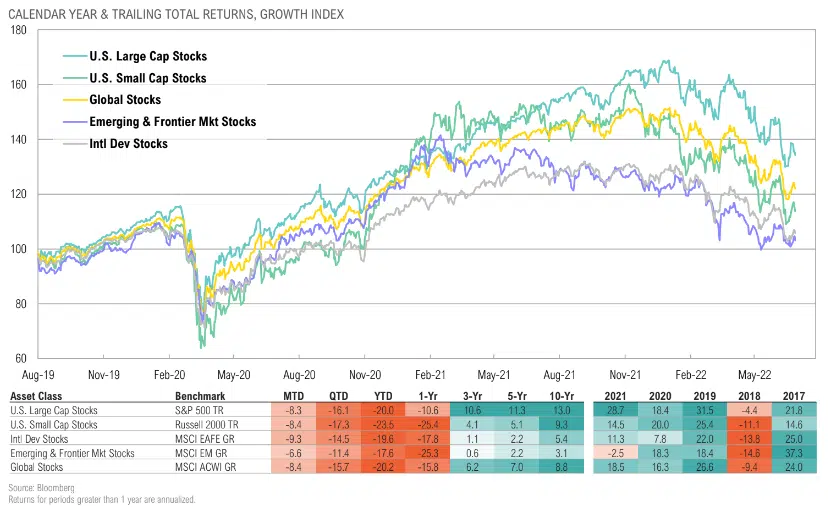
Despite dropping into bear market territory, U.S. stocks have outperformed their international peers over the last year; emerging markets have outperformed YTD
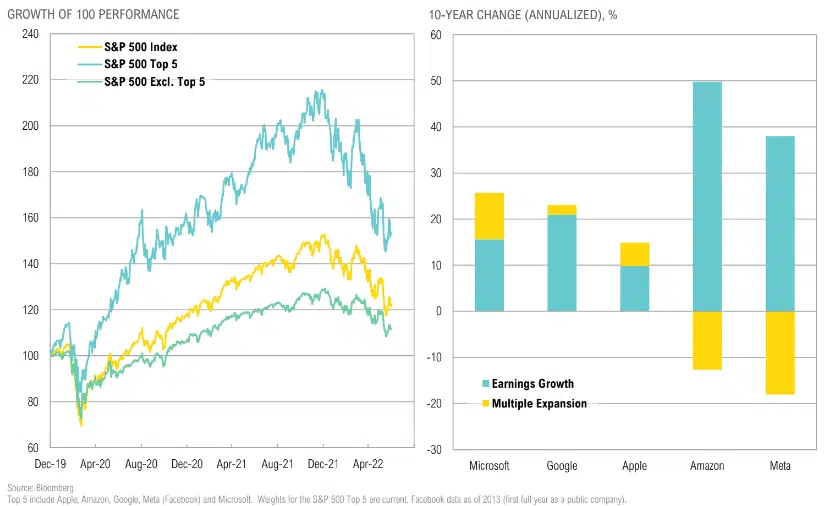
GAMMA (formerly FAAMG) has underperformed S&P 500 ex-GAMMA by over 14% for the year-to-date
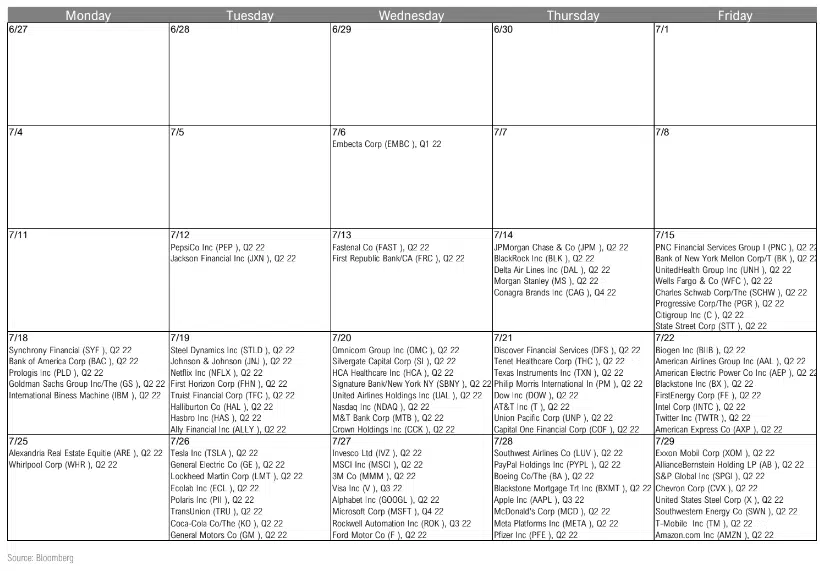
GLOBAL EARNINGS CALENDAR
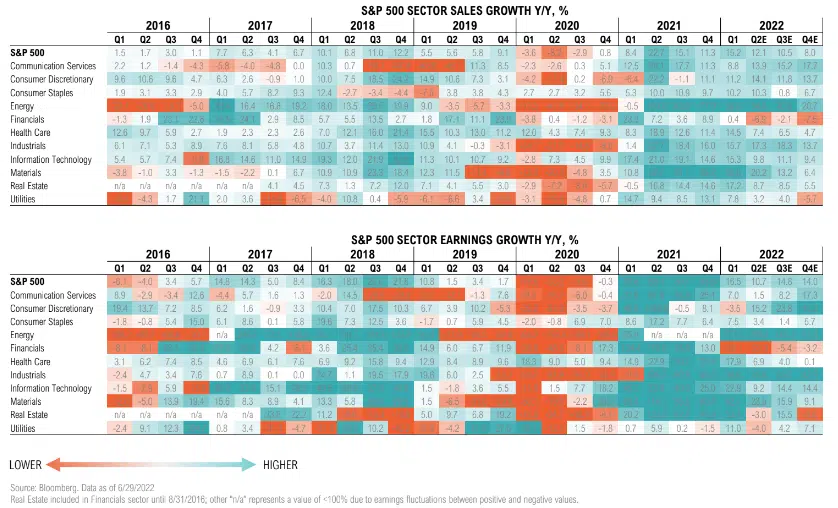
Sales and earnings growth expected to decelerate but remain healthy in 2022; impact of inflation and potential recession is a new wild card
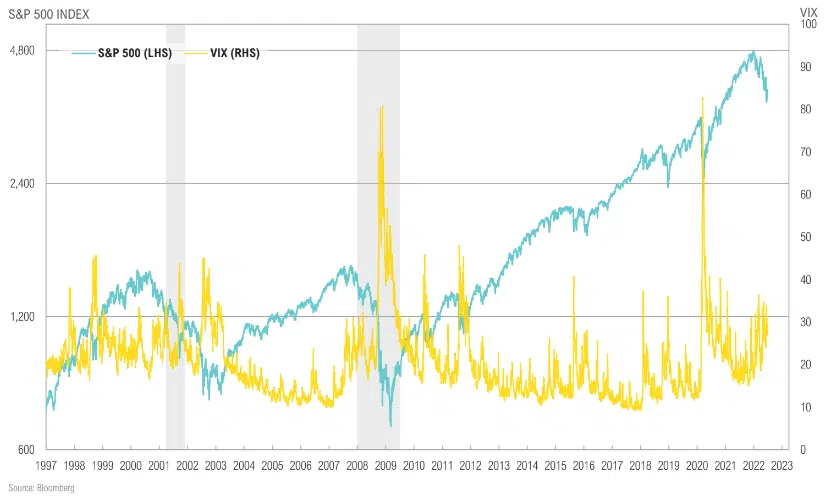
Lower stock prices and still-high earnings estimates, which admittedly lag, have helped ease valuations; although below quarter peak of 35, implied volatility remains elevated at around 30
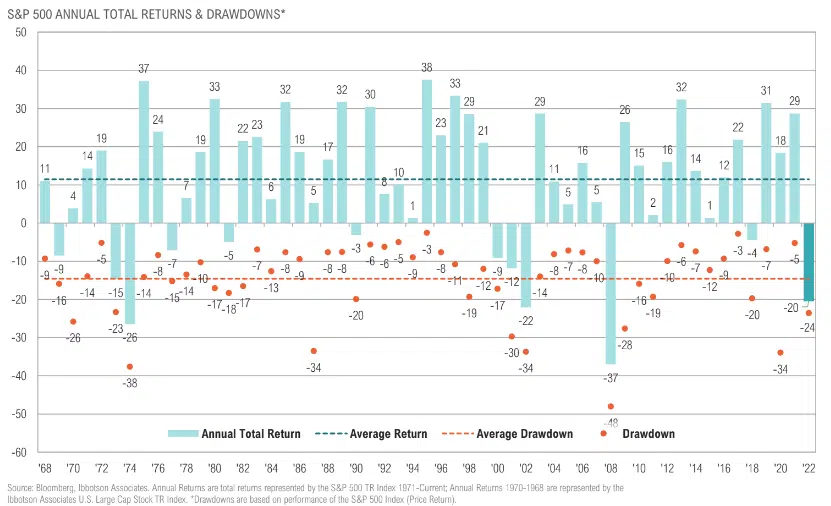
The S&P 500 is currently 20% from its all-time high, marginally worse than the average drawdown of 15% over the last 50 years
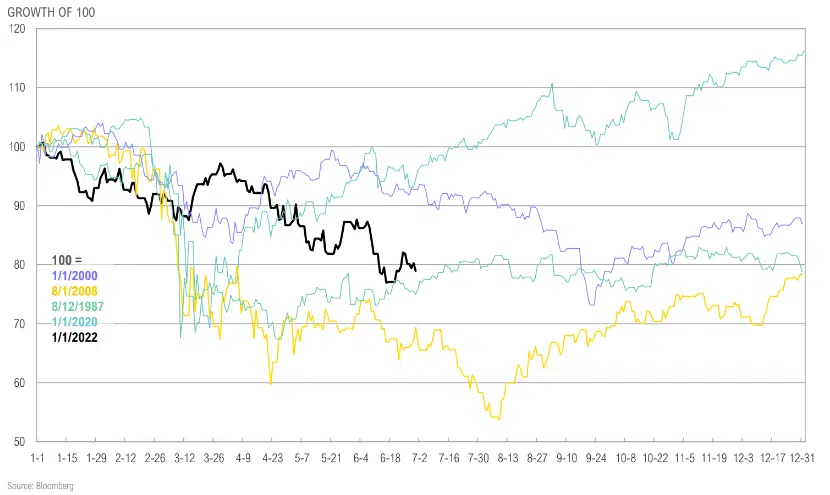
Current drawdown vs. historic bear markets
Markets have pulled back from ATH’s, currently in bear market territory; interestingly bear market level is inline with long-term avg. valuations
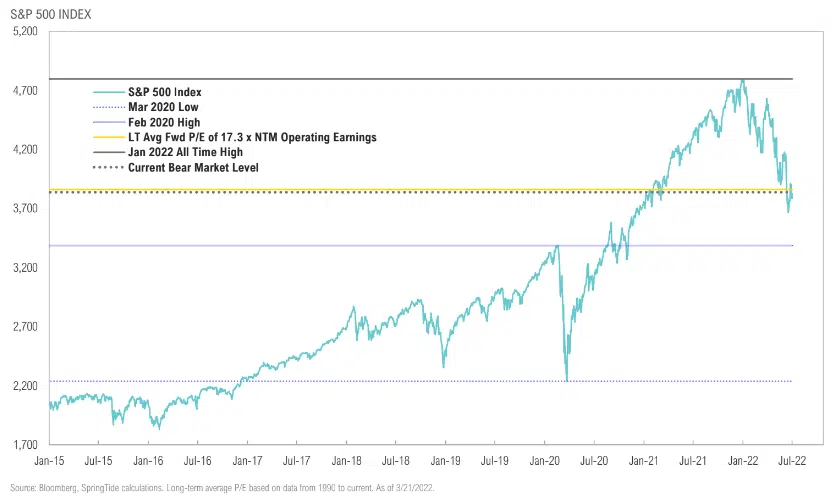
U.S. equity valuations approach longer-term average, as strong earnings growth and current bear market drawdown dramatically helped valuations
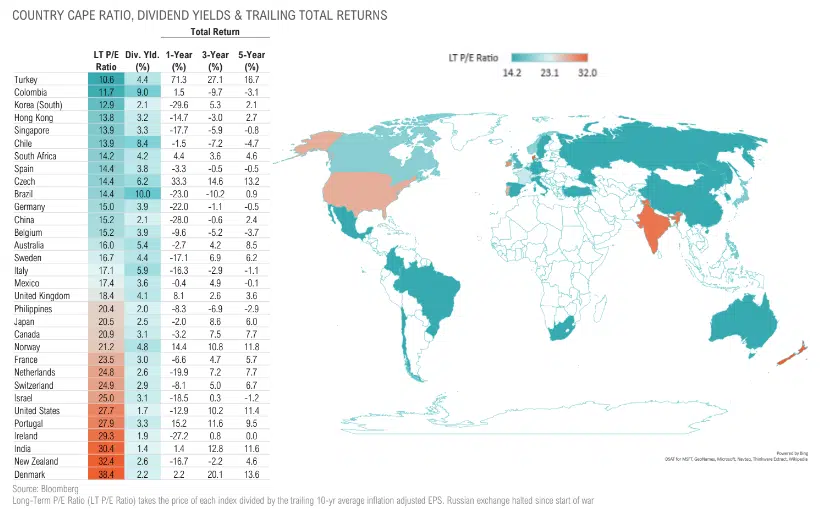
Cyclically-adjusted P/E (CAPE) multiples by country; >5% yields in Colombia, Brazil, Chile, and Italy; Russian markets are effectively closed for offshore investors
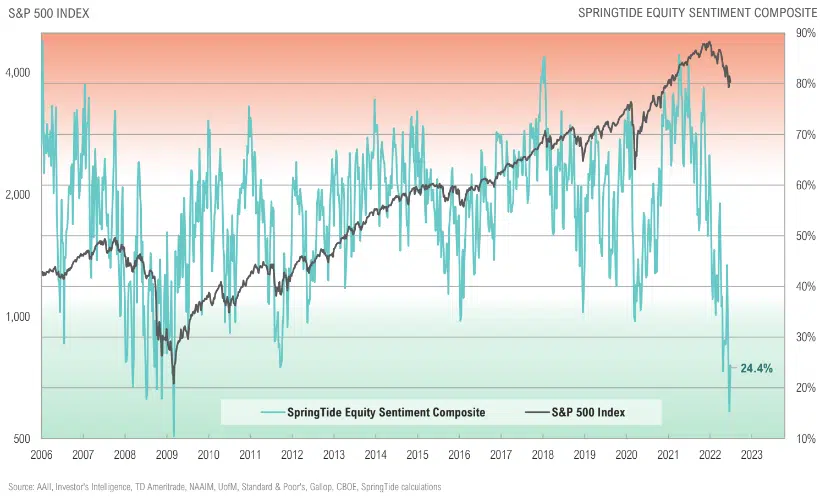
U.S. equity sentiment has rebounded after dropping to the lowest level since 2011; readings below 30 have often presented good buying opportunities
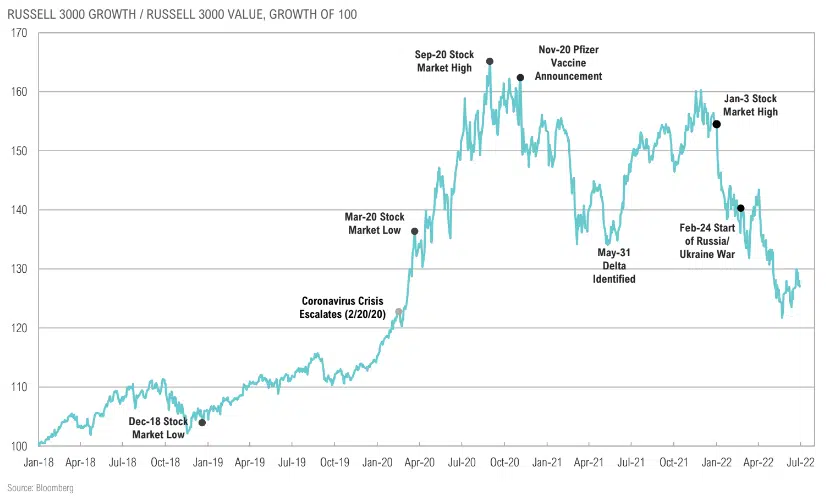
Value outperformed growth post vax announcements; growth’s 2H21 outperformance nearly retraced that lost ground but has since rolled over as rising rates take over as primary driver
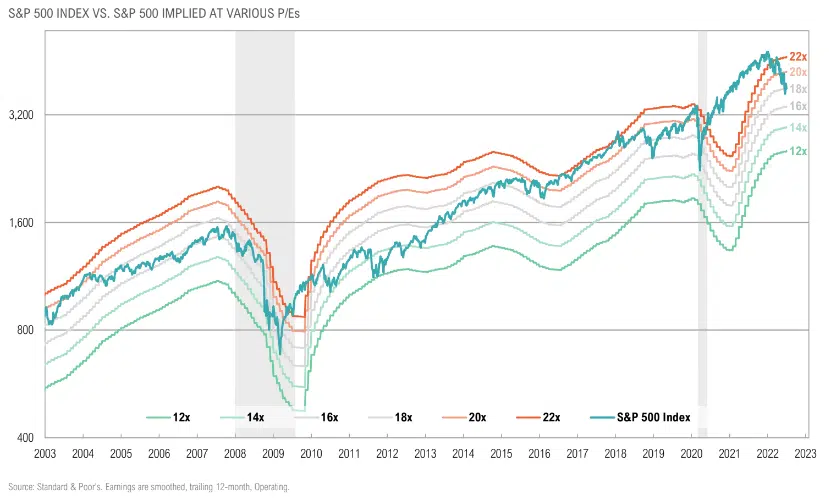
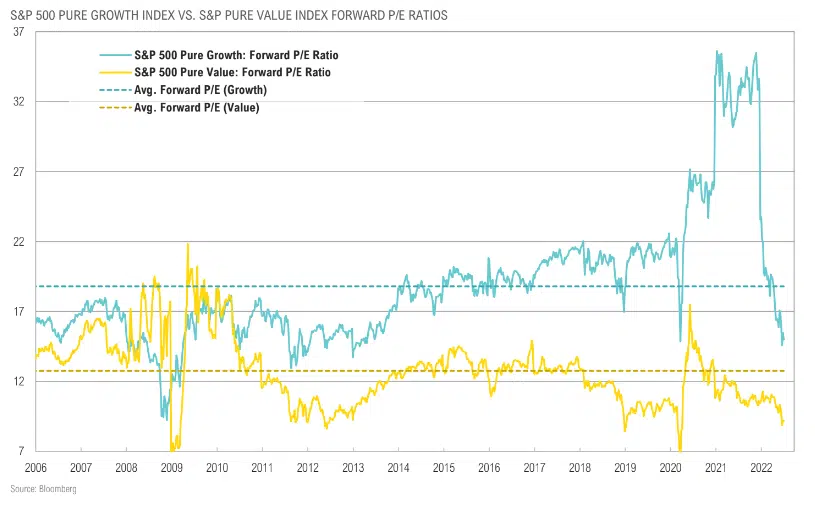
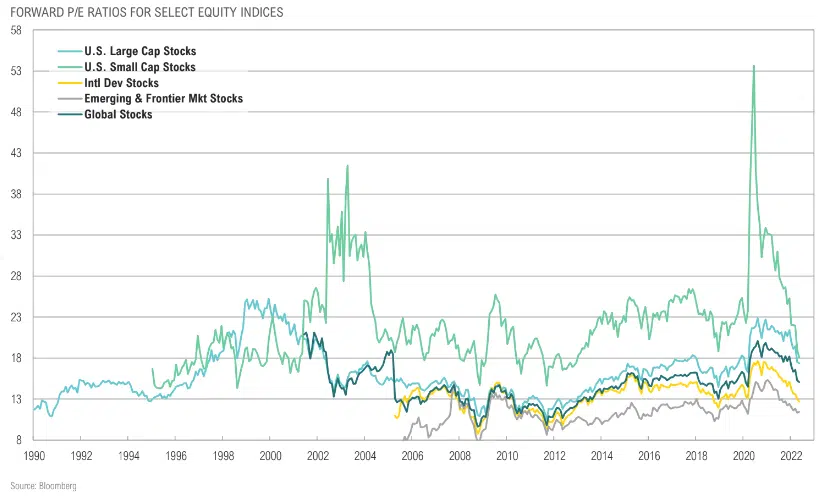
Forward-looking valuations have improved dramatically, but earnings estimates will now come into question given potential margin pressure; value still looks relatively cheaper
EM equities remain relatively cheap vs. developed markets, but “value trap” risk remains due to geopolitics, global food and energy crisis
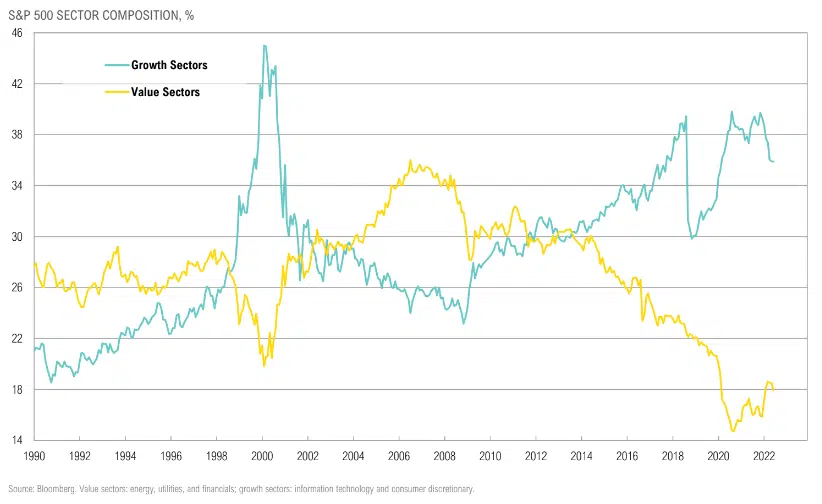
Still a long way to go? The weight of technology and consumer discretionary stocks in the S&P 500 has dropped to 36% but still near historical highs
FIXED INCOME & CREDIT
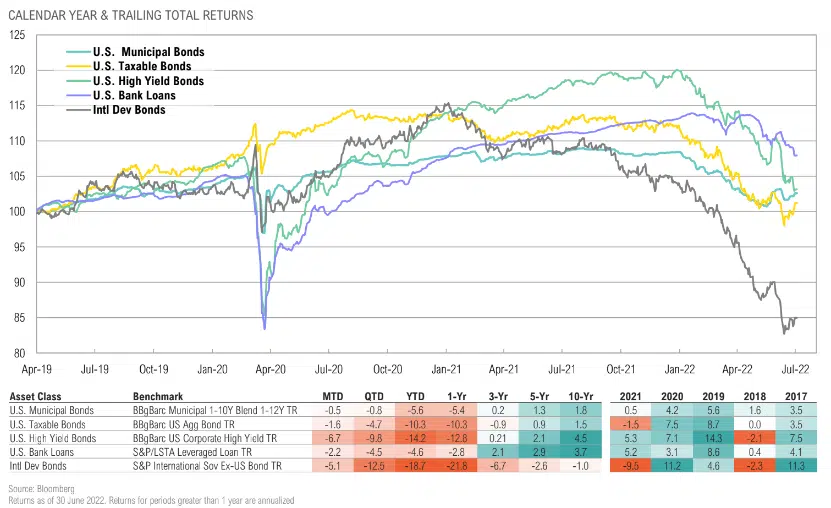
All U.S. fixed income and credit asset classes were down over the quarter; international developed bonds faired the worst, are now down over the last decade
Parts of the Treasury yield curve remain inverted as inflation and rate hikes have started to take their toll on growth
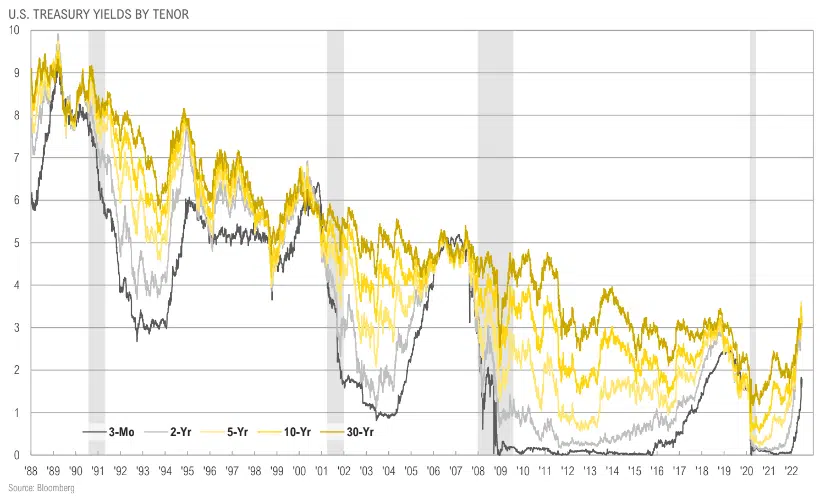
Parts of the Treasury yield curve remain inverted as inflation and rate hikes have started to take their toll on growth
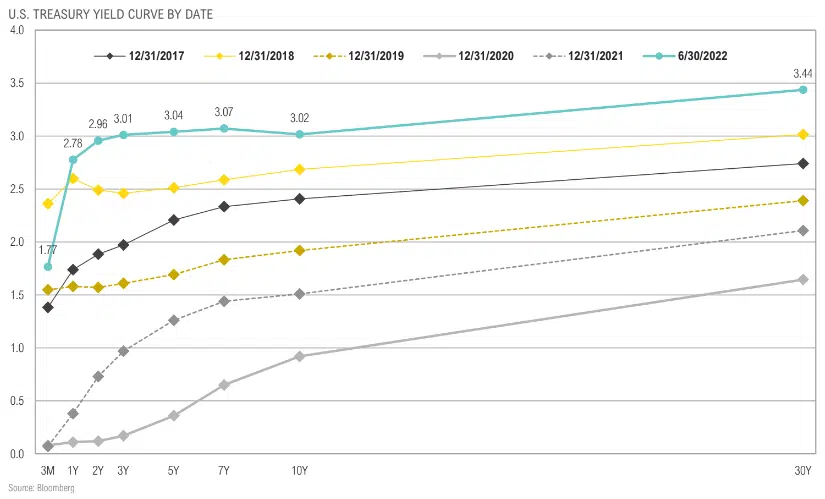
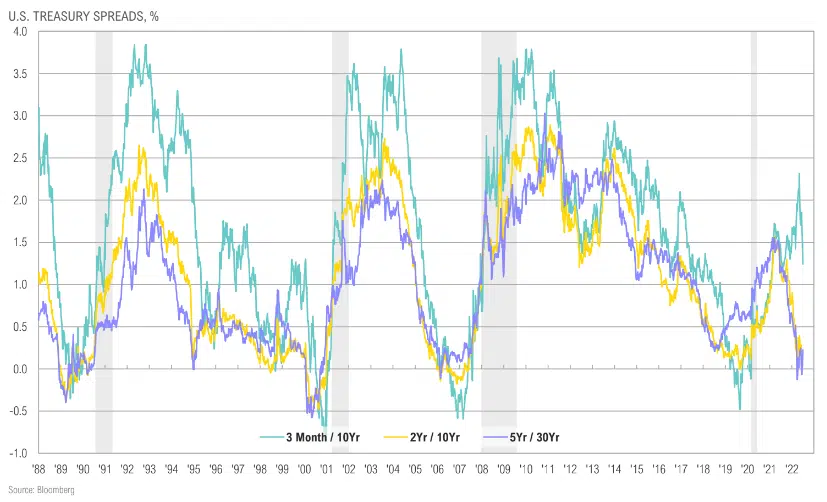
2-year/ 10-year Treasury spread cratering on rate hike > subsequent slowdown expectations; currently right around 0%
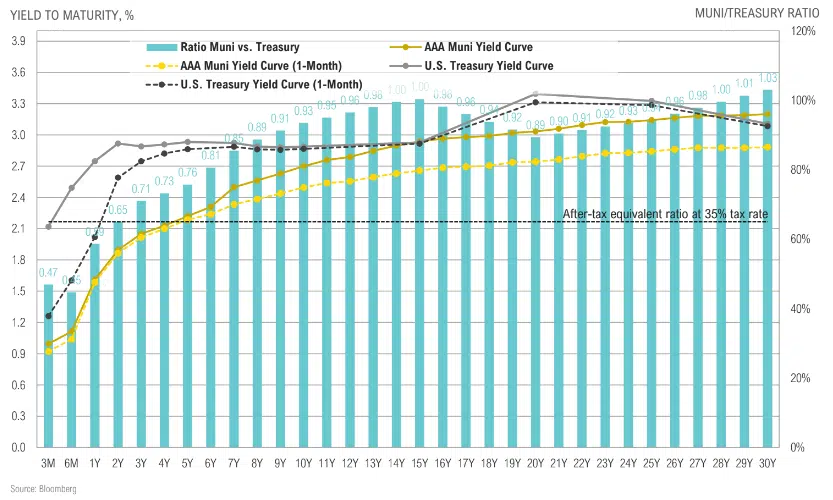
Muni-Treasury ratio: no value in the muni bond curve inside of 5 years; any yield pickup requires taking on credit and duration risk
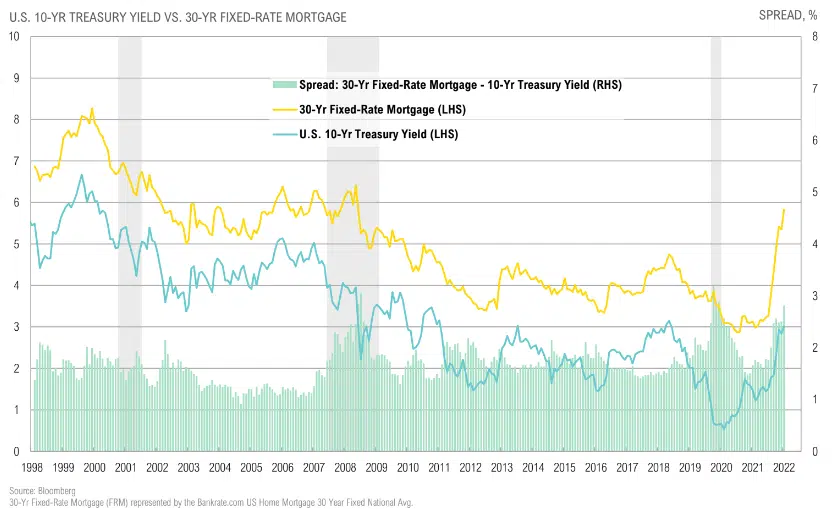
30-year fixed mortgage rates again spiked in June as mortgage rate spreads vs. 10-year Treasury widened; will have negative impact on housing and consumer with a lag
Credit spreads only modestly higher than median across most sectors as recession fears start to cause spread widening
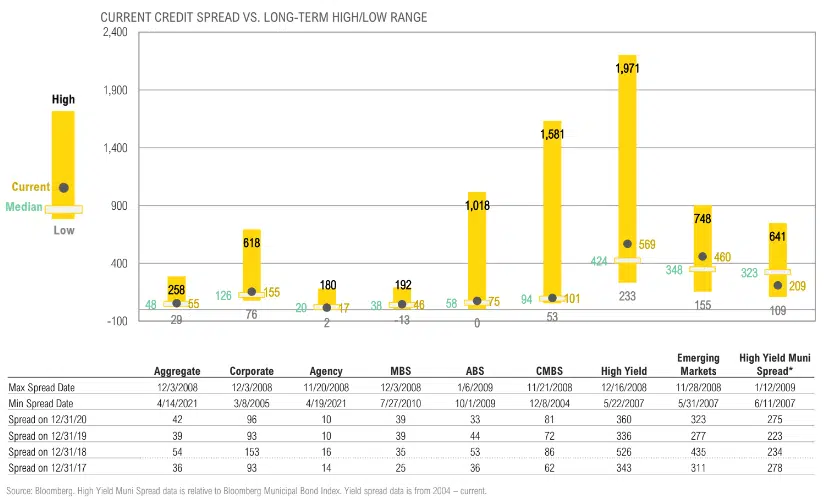
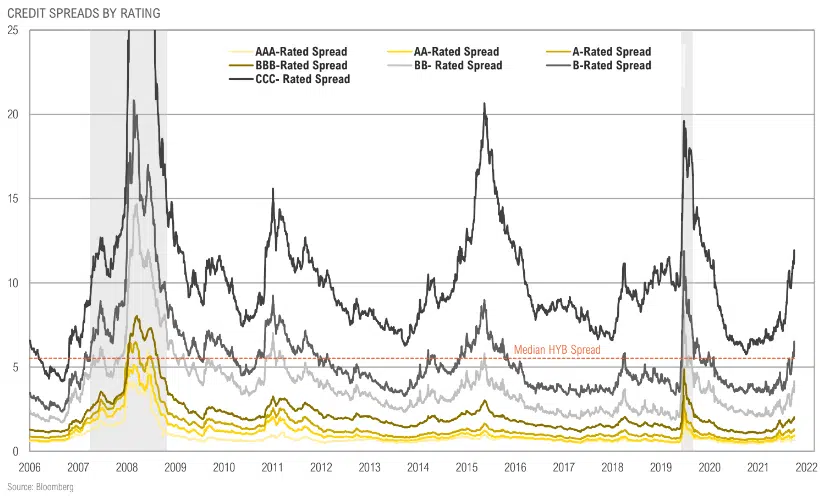
Credit spreads widened in June; notably, CCC-rated bonds widened 211 bps in June and 516 bps since the start of the year
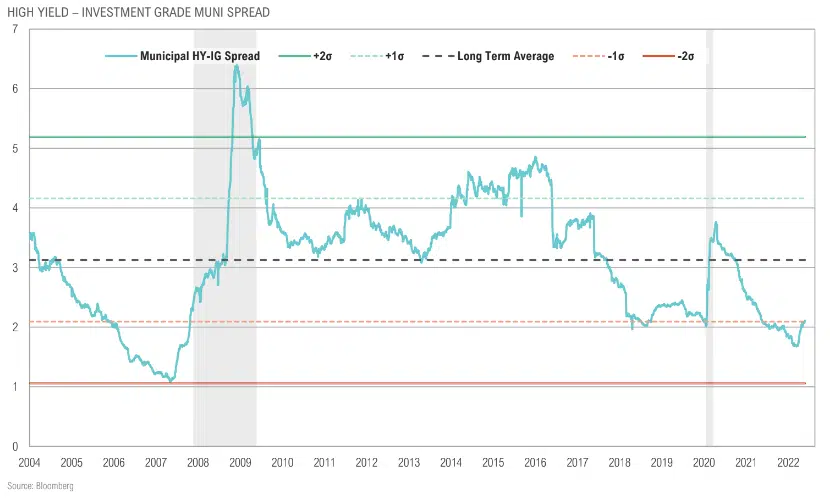
High yield-to-investment grade muni spreads near tightest levels since 2007
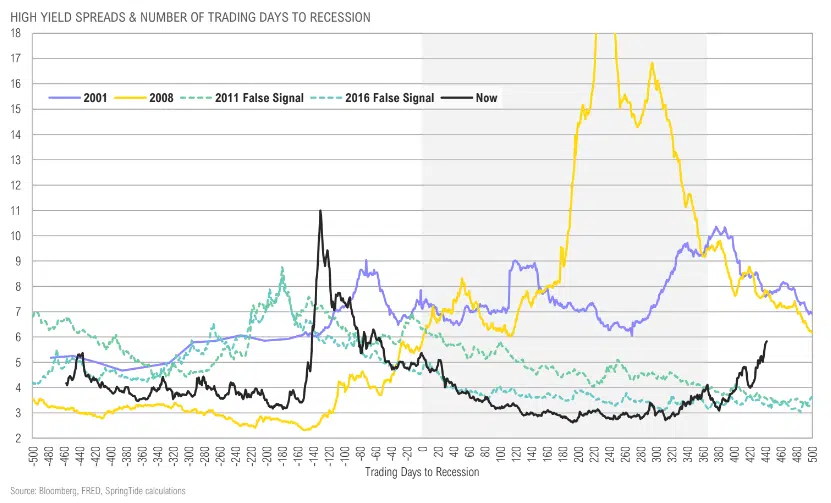
High yield spreads through the COVID-19 crisis highlight the episodic nature of volatility with an active Fed put, which may not be in place during next crisis
REAL ASSETS & INFRASTRUCTURE
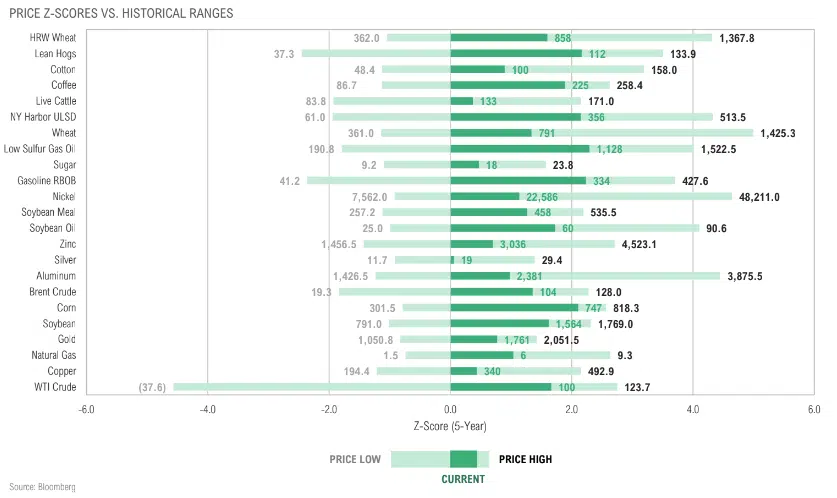
Most commodities sold off in June; industrial metals were down -26.4% QTD, while energy was still up 7.0% QTD, even after losing 14.6% in June
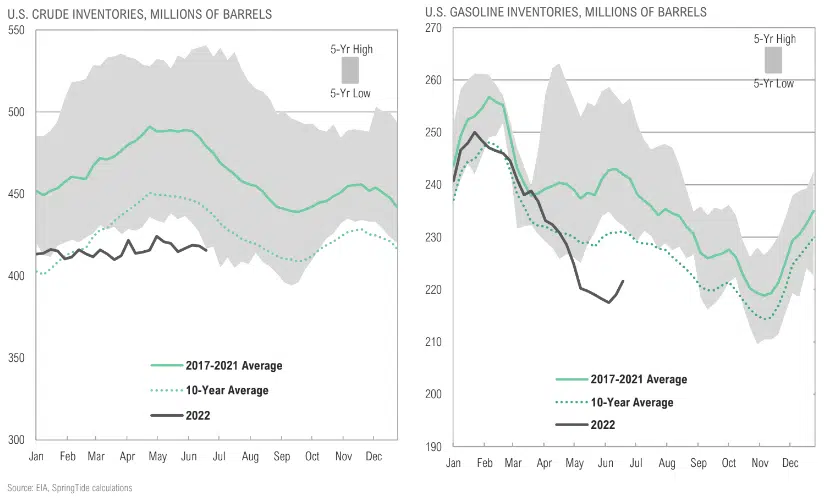
Crude oil and gasoline inventories remain well below long-term averages
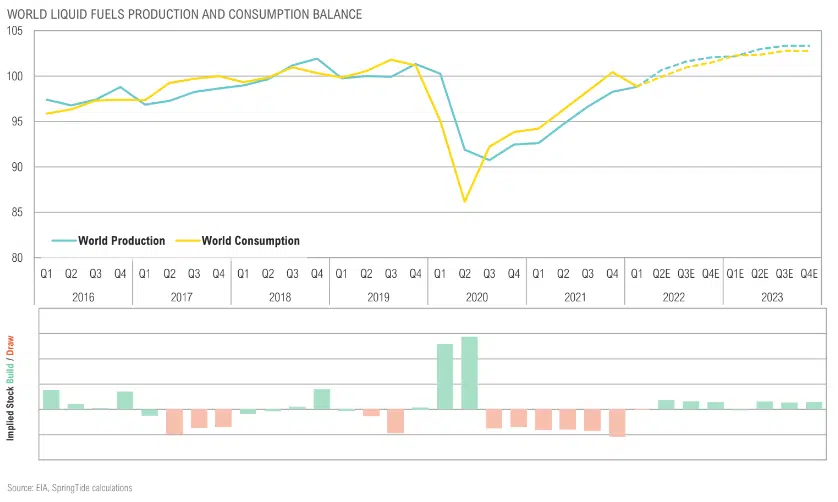
As expected, snapback in energy consumption is outpacing production; production expected to match consumption later in 2022 per EIA, but this remains to be seen
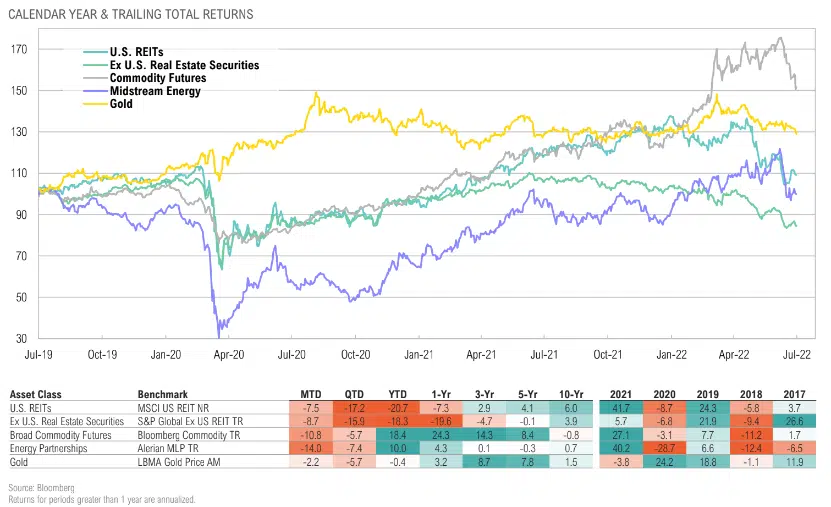
Several commodities hit new all-time highs following Russia’s invasion of Ukraine given their importance to global supply of energy and food; recent correction is modest in context
Real yields popped into positive territory (using TIPS implieds); gold may only catch a bid if and when the Fed needs to back away from rate hikes
OPPORTUNISTIC
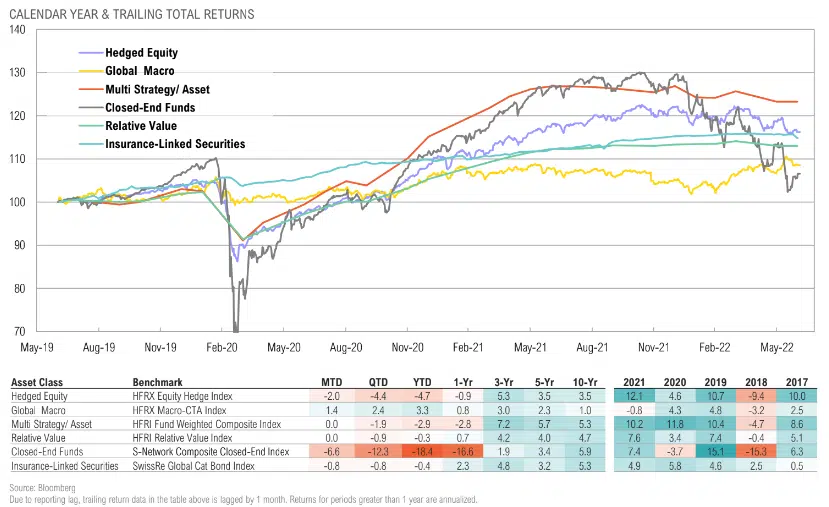
Closed-end funds continued down a further 12.3% during the second quarter while global macro returned 2.4% for the quarter
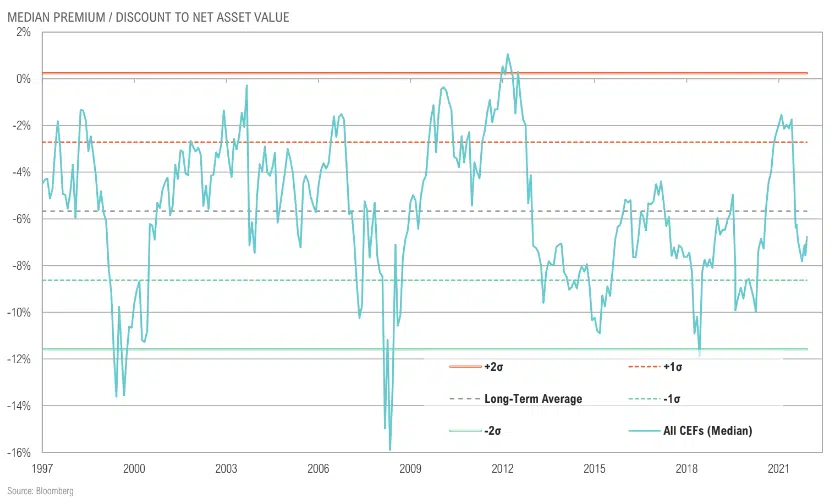
CEF discounts narrowed slightly from -7.2% in May to -6.8% in June
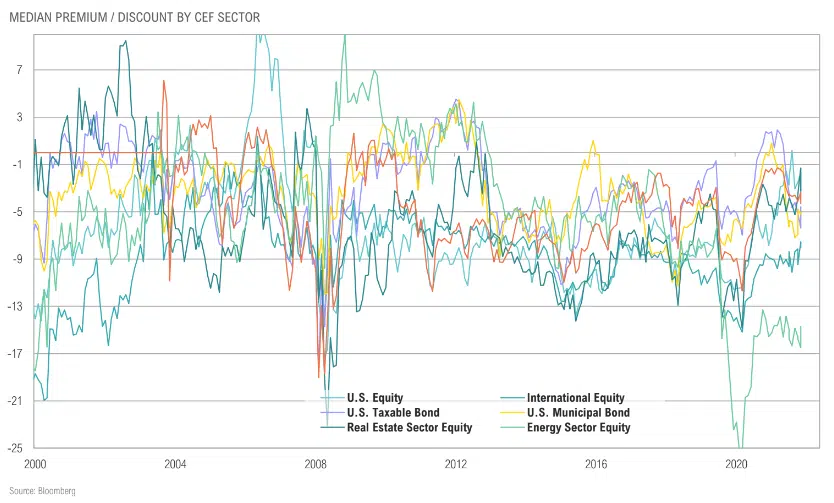
CEF discounts mixed by sector; taxable bond CEFs still no longer trading at a premium while energy sector discounts remains stubbornly wide
ASSET ALLOCATION
Dramatic U.S. Dollar strength driven by safe-haven bid, relative yields
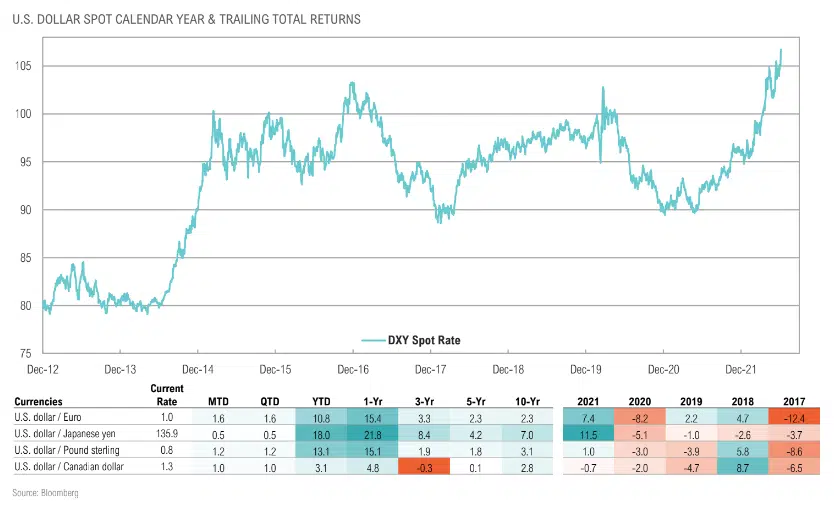
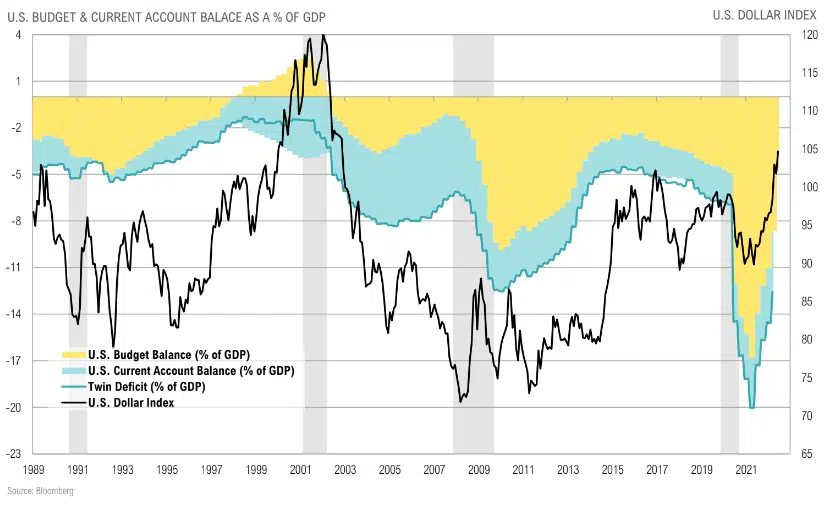
U.S. Dollar strength driven by safe-haven bid, relative yields; potentially helped by brief respite in deficit situation
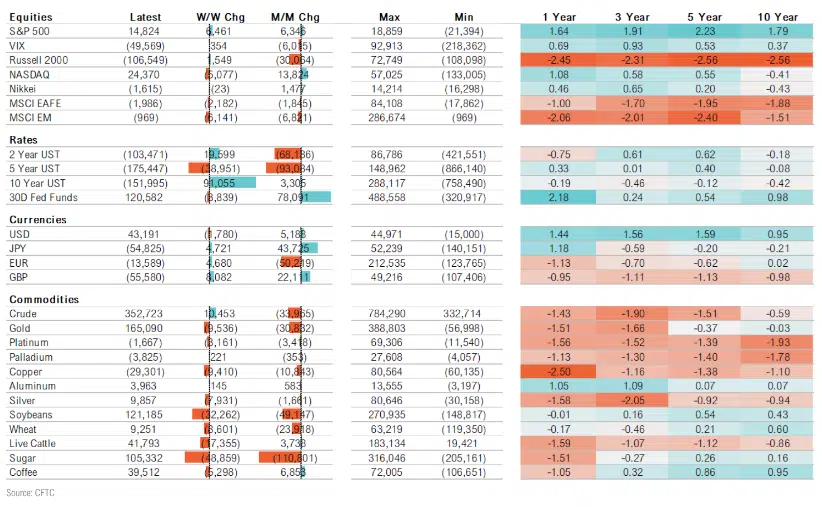
Futures spec positioning shows bullish positioning in USD, S&P 500 and short-term rates
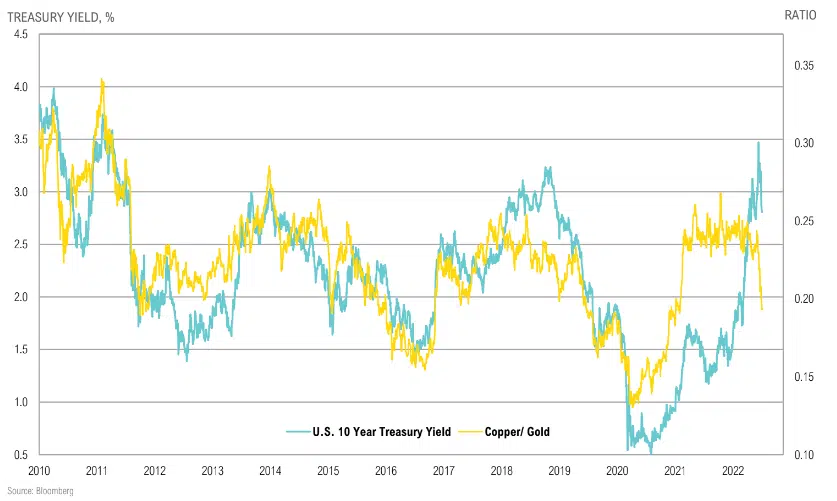
Copper/gold ratio plunging suggests the peak in rates may be in the rear-view mirror
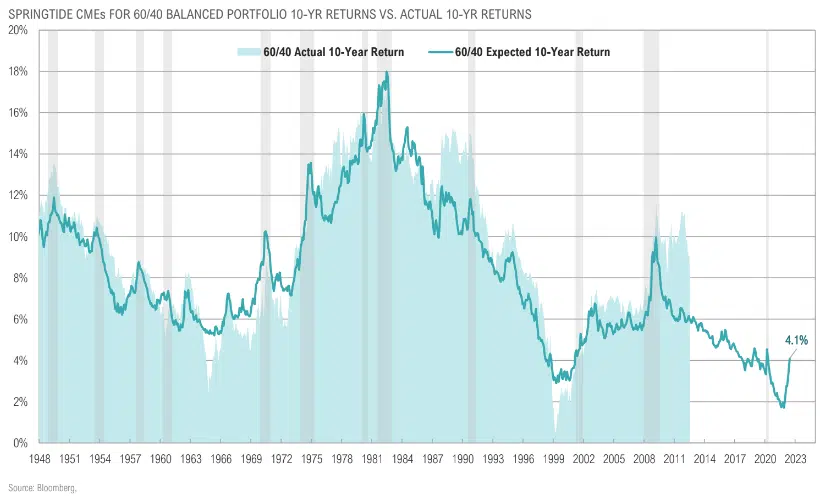
Expected returns for passive 60/40 portfolio picked up modestly, but still remain low relative to history