Magnus documents: Form ADV  | Form CRS  | Privacy Policy

Topical Research – Cash Trends

Summary:

Higher nominal rates and an inverted yield curve mean short-term bonds offer attractive real yields, especially relative to longer maturities. Given the relatively unattractive deposit yields paid by many banks, these higher yields continue to drain bank deposits, potentially undermining the health of the banking sector.

Key Themes:

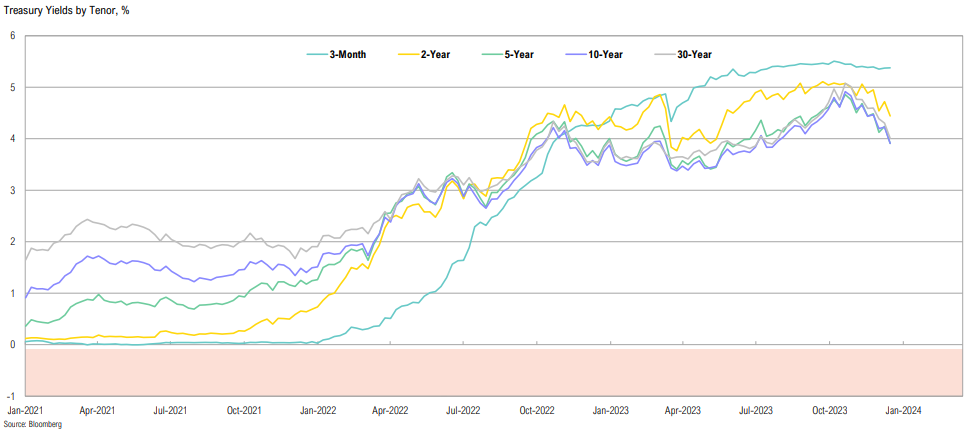
01. Higher nominal rates (2-year at 4.5%) and an inverted yield curve mean short-term bonds offer attractive yields, especially relative to longer maturities.
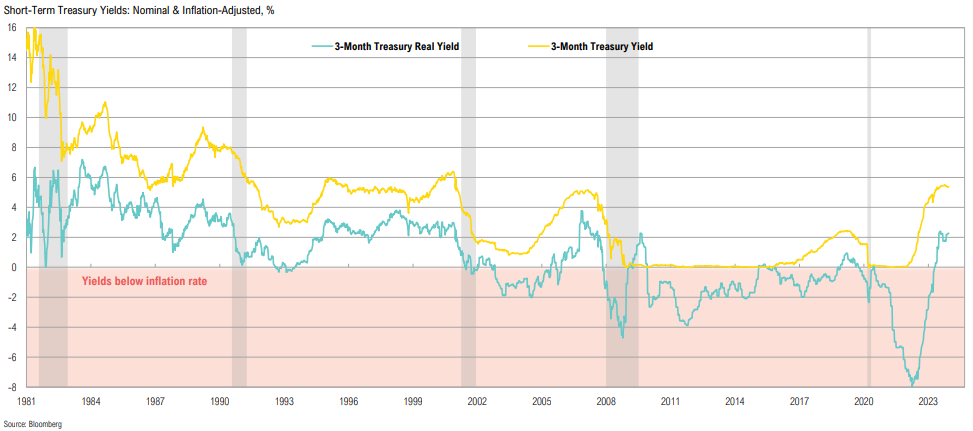
02. As inflation has trended lower, real short-term bond and cash rates have skyrocketed from -8% to over 2%, reaching some of the highest levels of the last 30 years.
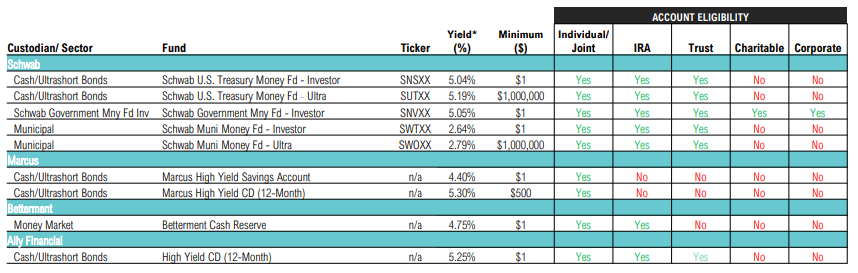
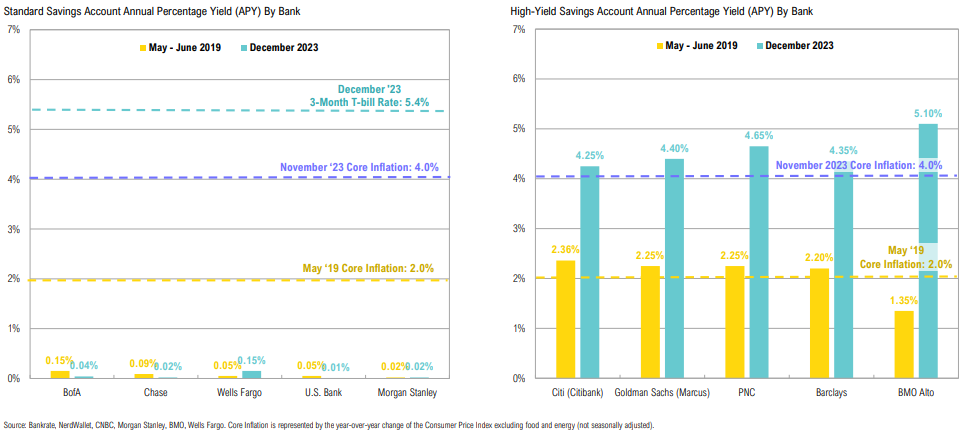
03. While yields on Treasuries and many high-yield savings accounts have increased substantially and now outpace inflation, yields on many standard bank savings accounts remain near zero.
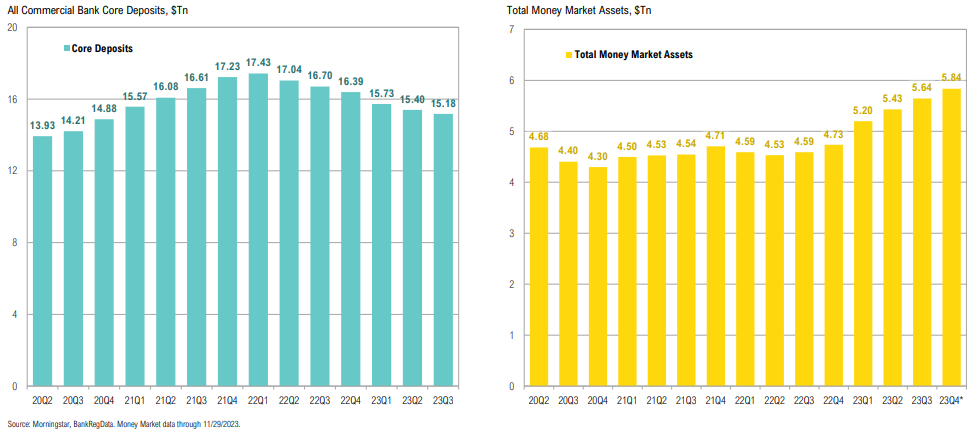
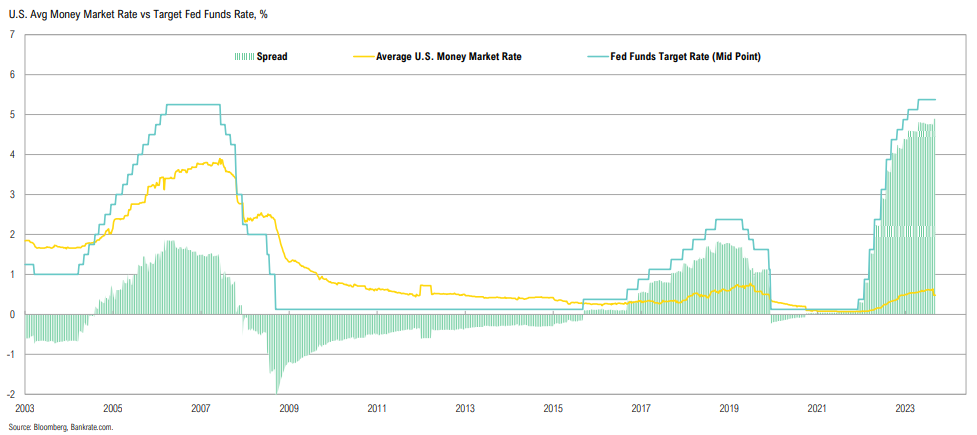
04. Big banks continue to lend to the Fed (i.e., earn) at rates significantly higher than what they are paying on deposits, predictably causing a deposit exodus.
05. U.S. money market funds saw $200bn of inflows in November, bringing the total flows for the year to date to over $1.1 trillion.

Treasury Yields

Nominal

With the post-COVID rate shock behind us, markets will need to find equilibrium between unsustainable fiscal policies and some stubborn aspects of services inflation holding rates up, but lower growth/inflation pulling them down

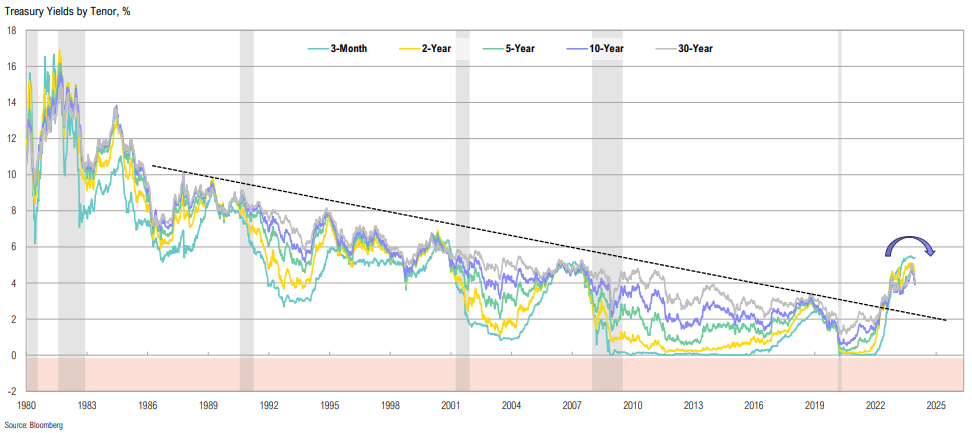
An inverted yield curve means short-term bonds offer a material yield pickup relative to longer maturities; 2-year Treasuries yield around 4.5%
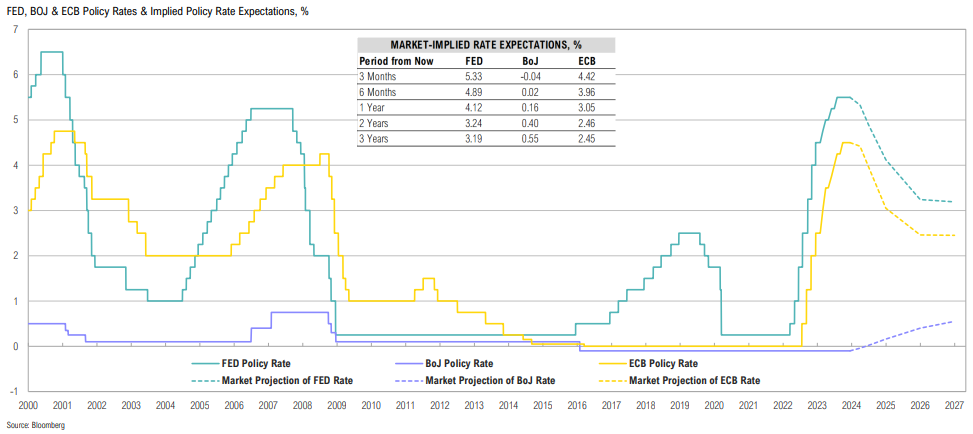
Policy Rates

Expected developed market rate differentials have converged in recent years, but remain substantial; Japan’s implied rates have moved higher for the first time in many years

Treasury Yields

Finally getting paid to wait—yields on short-term government bonds have increased in nominal terms and, with inflation having rolled over, are attractive in real terms too; these yields will decline if the Fed cuts rates

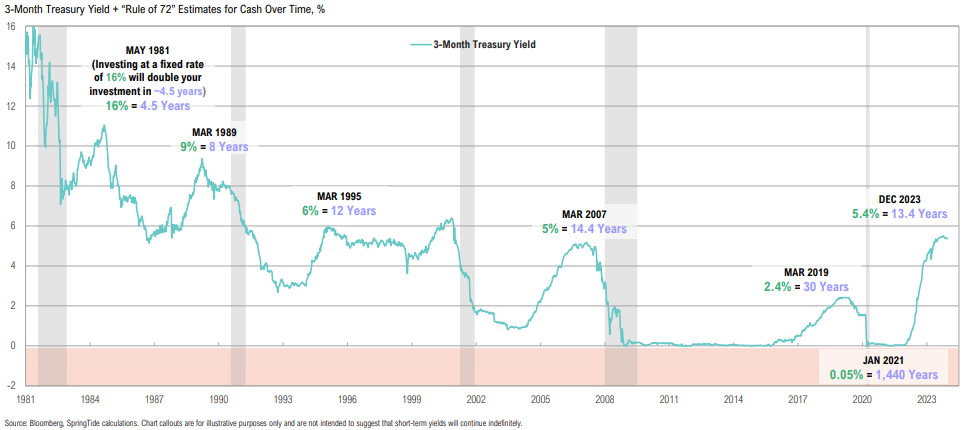
Thought experiment: given the increase in yields, investors could theoretically double their money risk-free in 13 years vs. 1,440 years if yields from 2021 prevailed

Bank Savings Rates

Yields on many high-yield savings accounts have increased substantially, with several now outpacing inflation; yields on many standard savings accounts remain near zero

U.S. bank deposits have dropped by about 6%, to 17.4 trillion, since their peak of $18.4 trillion in April of 2022

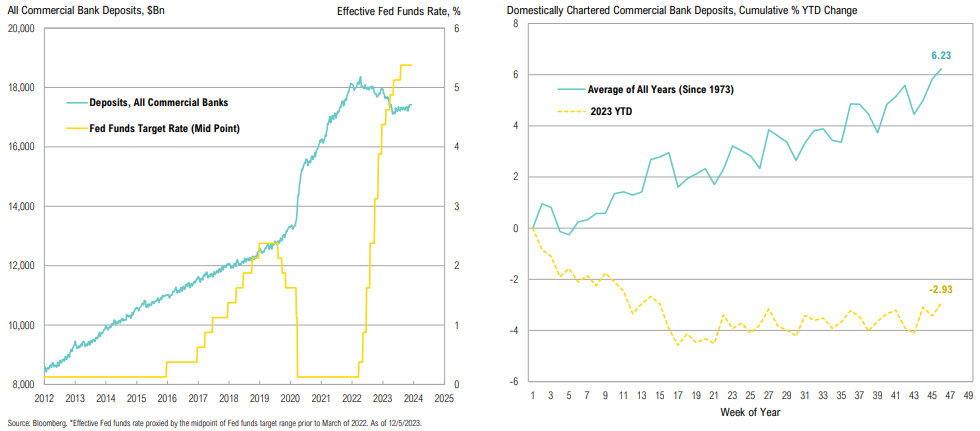
Big banks continue to lend to the Fed at very high rates relative to what they pay on deposits, which has predictably resulted in a deposit exodus

Money Market Flows

U.S. money market funds saw $200bn of inflows over November, bringing flows for the year to date to over $1.1Tn

Cash & Liquidity Reserve Implementation Cheat Sheet

Share it :
Disclaimer

Magnus Financial Group LLC (“Magnus”) did not produce and bears no responsibility for any part of this report whatsoever, including but not limited to any microeconomic views, inaccuracies or any errors or omissions. Research and data used in the presentation have come from third-party sources that Magnus has not independently verified presentation and the opinions expressed are not by Magnus or its employees and are current only as of the time made and are subject to change without notice.

This report may include estimates, projections or other forward-looking statements, however, due to numerous factors, actual events may differ substantially from those presented. The graphs and tables making up this report have been based on unaudited, third-party data and performance information provided to us by one or more commercial databases. Except for the historical information contained in this report, certain matters are forward looking statements or projections that are dependent upon risks and uncertainties, including but not limited to factors and considerations such as general market volatility, global economic risk, geopolitical risk, currency risk and other country-specific factors, fiscal and monetary policy, the level of interest rates, security-specific risks, and historical market segment or sector performance relationships as they relate to the business and economic cycle.

Additionally, please be aware that past performance is not a guide to the future performance of any manager or strategy, and that the performance results and historical information provided displayed herein may have been adversely or favorably impacted by events and economic conditions that will not prevail in the future. Therefore, it should not be inferred that these results are indicative of the future performance of any strategy, index, fund, manager or group of managers. Index benchmarks contained in this report are provided so that performance can be compared with the performance of well-known and widely recognized indices. Index results assume the re-investment of all dividends and interest and do not reflect any management fees, transaction costs or expenses.

The information provided is not intended to be, and should not be construed as, investment, legal or tax advice nor should such information contained herein be construed as a recommendation or advice to purchase or sell any security, investment, or portfolio allocation. An investor should consult with their financial advisor to determine the appropriate investment strategies and investment vehicles. Investment decisions should be made based on the investor’s specific financial needs and objectives, goals, time horizon and risk tolerance. This presentation makes no implied or express recommendations concerning the way any client’s accounts should or would be handled, as appropriate investment decisions depend upon the client’s specific investment objectives.

Investment advisory services offered through Magnus; securities offered through third party custodial relationships. More information about Magnus can be found on its Form ADV at www.adviserinfo.sec.gov.

Terms of Use
This report is intended solely for the use of its recipient. There is a fee associated with the access to this report and the information and materials presented herein. Re-distribution or republication of this report and its contents are prohibited. Expert use is implied.
Definitions

Asset class performance was measured using the following benchmarks: U.S. Large Cap Stocks: S&P 500 TR Index; U.S. Small & Micro Cap: Russell 2000 TR Index; Intl Dev Large Cap Stocks: MSCI EAFE GR Index; Emerging & Frontier Market Stocks: MSCI Emerging Markets GR Index; U.S. Intermediate-Term Muni Bonds: Bloomberg Barclays 1-10 (1-12 Yr) Muni Bond TR Index; U.S. Intermediate-Term Bonds: Bloomberg Barclays U.S. Aggregate Bond TR Index; U.S. High Yield Bonds: Bloomberg Barclays U.S. Corporate High Yield TR Index; U.S. Bank Loans: S&P/LSTA U.S. Leveraged Loan Index; Intl Developed Bonds: Bloomberg Barclays Global Aggregate ex-U.S. Index; Emerging & Frontier Market Bonds: JPMorgan EMBI Global Diversified TR Index; U.S. REITs: MSCI U.S. REIT GR Index, Ex U.S. Real Estate Securities: S&P Global Ex-U.S. Property TR Index; Commodity Futures: Bloomberg Commodity TR Index; Midstream Energy: Alerian MLP TR Index; Gold: LBMA Gold Price, U.S. 60/40: 60% S&P 500 TR Index; 40% Bloomberg Barclays U.S. Aggregate Bond TR Index; Global 60/40: 60% MSCI ACWI GR Index; 40% Bloomberg Barclays Global Aggregate Bond TR Index.

Contact Us