Drew J. Collins, CFA®, MBA – Senior Managing Director, Magnus Financial Group LLC –
View on Worth.com
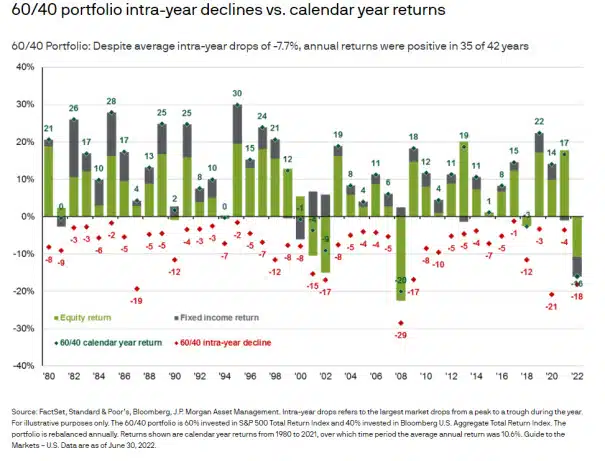
 Both the equity and bond markets have given investors reason to re-consider many of their long-held assumptions, such as a 60-40 split between stocks and bonds will give your portfolio a more stable ride through tumultuous periods. The thought process, backed by historical return patterns and data, was that when stocks went down due to concerns about the pace of economic activity, bonds would rally as investors sought refuge in more consistent income streams. Dividends are voluntary and are not a legal obligation on the part of corporations. On the other hand, interest payments are a legal obligation on the part of the issuer of the bonds.
Another aspect of the current market sell-off makes it different from what investors have been used to over the past 30 years. The more than 30-year bull market in bonds and the downward trending line of U.S. Treasury bond yields have been brought to an abrupt end in 2022 as inflation has returned to levels not seen in some 40 years. The Federal Reserve, the equity investor’s friend for most of the last 30 years under multiple Fed chairs, has once again been forced to re-establish its bona fides as warriors in the battle against inflation.
In addition, after multiple U.S. presidential administrations focused on reducing taxes and tax rates, investors are again faced with the possibility that Washington has become an increasingly hostile place for the suppliers of capital. The tax on share buy-backs is a potential harbinger of what is to come.

This reinforces the argument in favor of seeking out streams of income that are not subject to taxation by the Federal government, and one of the most reliable sources of tax-exempt income remains the municipal bond market.
Within the municipal bond market, investors tend to gravitate toward the relative safety of the investment grade segment or the general obligation sector. However, if they are looking for higher yields, they almost inevitably are drawn to some of the most problematic credits in the market. These credits, which inhabit the high-yield municipal bond indices, consist of borrowers such as Puerto Rico, the State of Illinois, the City of Chicago, and tobacco bonds. The threats to these issuers are well known. Still, we are talking about high debt issuances and a shrinking tax base due to high-income earners relocating to warmer climates with more welcoming tax environments. The pandemic has accelerated this exodus as the financial challenges of specific geographies have resulted in strapped budgets for law enforcement and rising crime rates.
So, what is an investor looking for higher levels of tax-exempt income to do? At Magnus Financial Group LLC, we have focused on a relatively small segment of the municipal bond market called tax-exempt private activity bonds. These are bonds issued mainly for projects that generate a public good but are owned and often operated by private entities. This segment includes bonds issued to finance public charter schools, which are public schools run by private entities (usually non-profit organizations), senior living facilities are either owned by non-profit organizations or that set aside a portion of the beds for lower-income individuals, and logistical facilities at regional airports. The latter can qualify for tax-exempt financing if they pay rent to the government (the airport authority) and the borrower adds 30% to the property’s value (within the confines of the airport perimeter fence).

What these projects have in common is that they can generate recurring income from the users of the facilities, whether it is students in the case of a charter school, residents in the case of senior care housing, or aircraft in the case of an FBO (fixed-base operation) at an airport.
The bondholders, moreover, benefit from the fact that they can get collateral for their bonds in the form of property, plant, and equipment. This is something that general obligation bonds issued by states and municipalities do not offer. These bonds also have a first lien on the project’s revenues being financed.
The rating agencies often do not assign ratings to these bonds either due to the relatively small size of many of the issues (in the $10-$40 million range) or because they are not asked to do so by the borrowers. As a result, the yields on these bonds are often substantially higher than those offered by the investment-grade municipal bond market.
Non-rated and lower-rated municipal bonds have a higher default rate than the investment-grade bond market, but their higher yields, which are often 250-350 basis points over the AAA municipal bond yield, justify the additional risks that investors face. In the current environment, following this year’s sell-off in bonds, we are looking at bonds yielding 5.50-6.50 percent, which for a high-end taxpayer equates to taxable equivalent yields of 9.0-10.7 percent (based on the highest Federal tax bracket).

This approach to the tax-exempt bond market is only for some. Many issues are restricted to purchase by accredited investors and qualified institutional buyers (QIBs) only. However, increasingly high-net and ultra-high-net-worth investors are gravitating to the sector in search of a higher tax-exempt income than is generally available from municipal bond mutual funds and exchange-traded funds (ETFs).
A separately managed account (SMA) is an excellent way to invest in this sector. SMAs have the advantage of giving the investor control over when they buy and when they sell. Ideally, this allows the investor to refrain from participating in the market’s periods of euphoria and despair. A mutual fund or an ETF forces the investor to buy when the market is buying and sell when the market is selling because the portfolio manager is compelled to deploy new capital as it is received and to sell assets to meet redemptions when they occur. A separately managed account allows investors to sit on their hands and watch the market go through its inevitable convulsions. Ideally, it will enable the investor to be a beneficiary of market madness and be a supplier of liquidity when the market is bullish, selling bonds into rallies, and becoming a buyer of bonds when the market is offering them at fire-sale prices.
Finally, this segment of the municipal bond market is growing. Charter schools continue to take market share from traditional district public schools but still only account for 7 percent of the public school population in the United States. Although senior living facilities suffered during the pandemic, they have started to recover, and the underlying demographics still favor increased demand for senior housing for many years to come.
In addition, due to the increasing number of wealthy individuals and families, the underlying need for private aviation facilities at regional airports will likely continue to expand for the foreseeable future. The pandemic itself gave demand for personal air travel a boost.
This overlooked asset class will likely gain importance as the aging population in the U.S. continues to seek higher levels of tax-exempt income as they approach retirement.
Drew J. Collins, MBA, CFA, is a Senior Managing Director at Magnus Financial Group LLC.