Cartoon
The “K” Divide

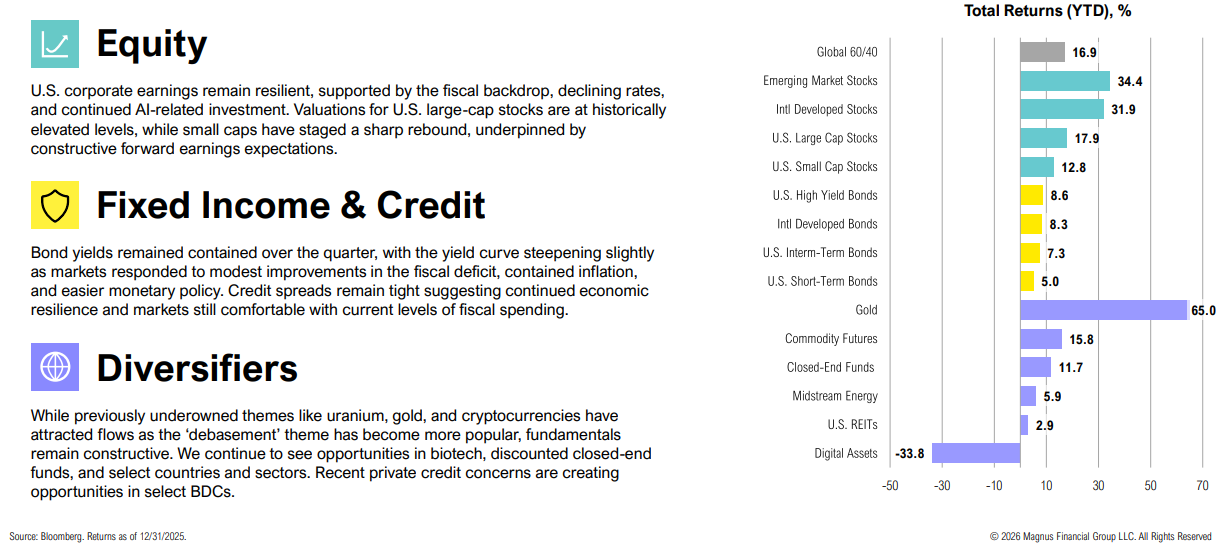
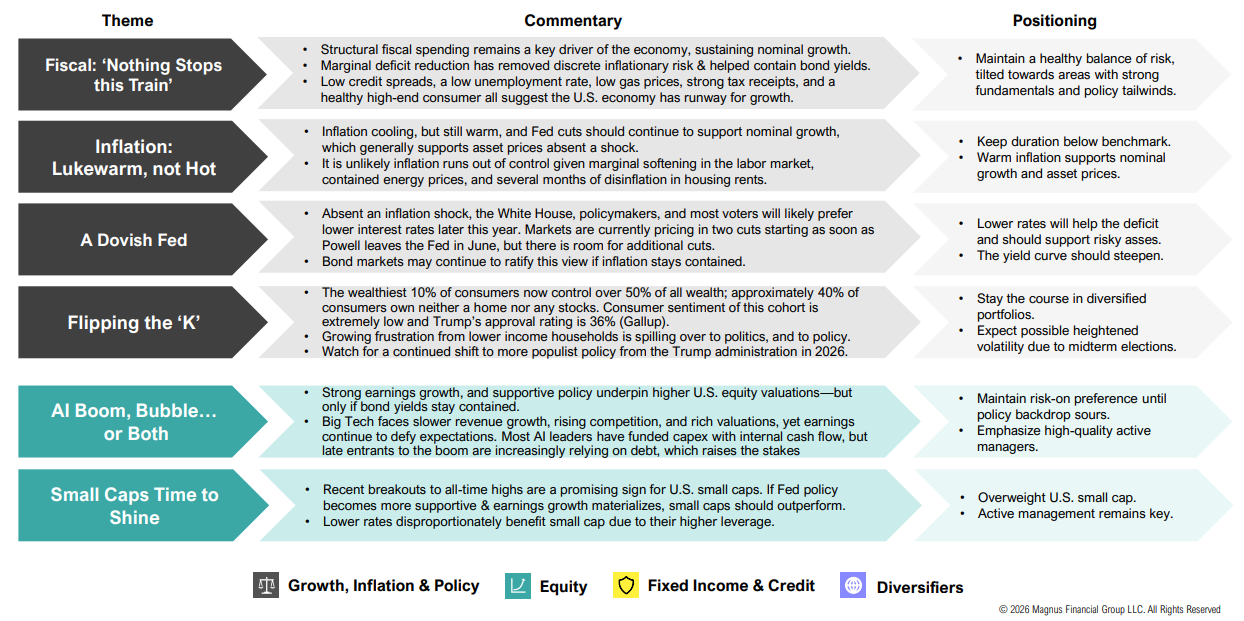
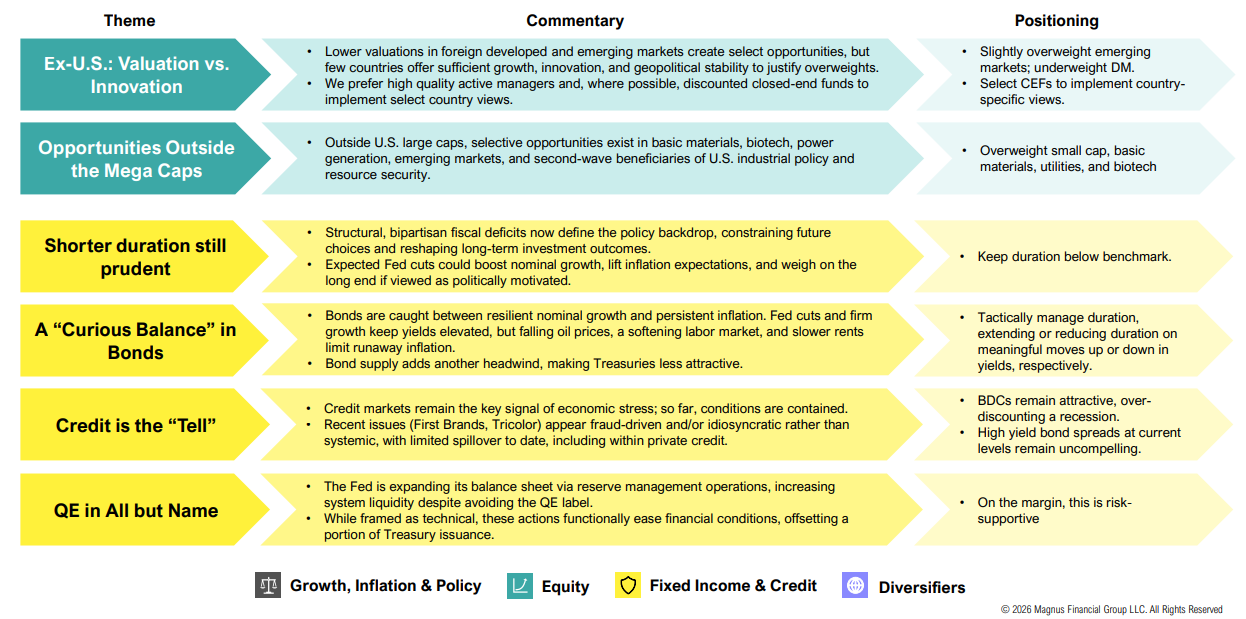
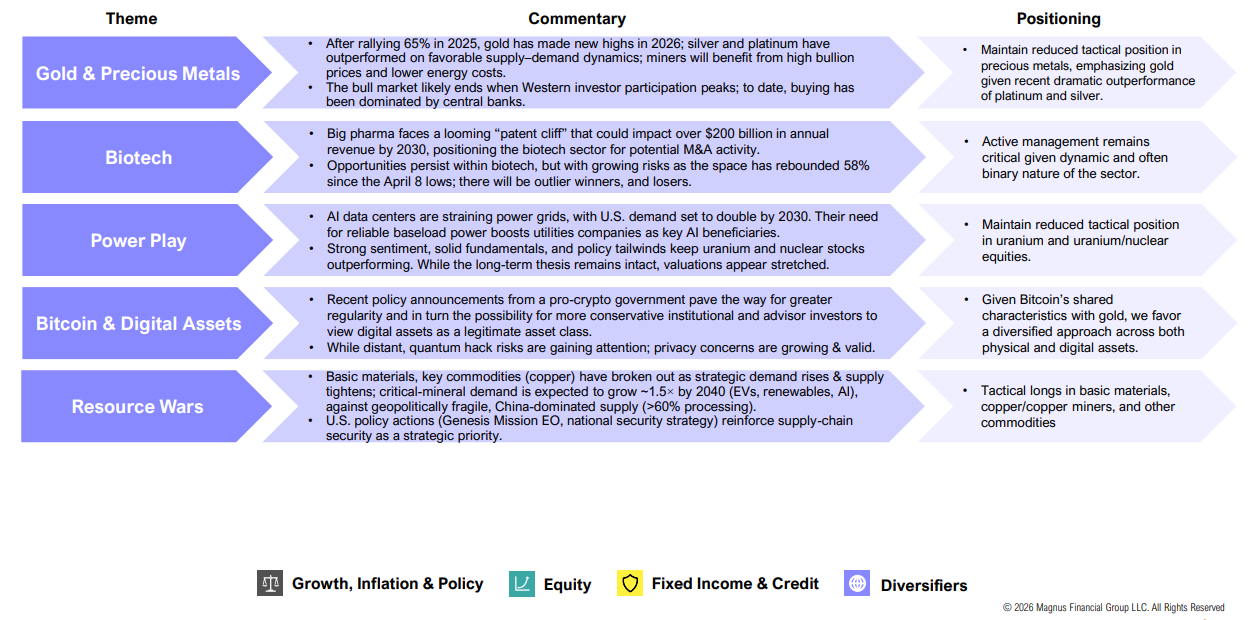
Market Commentary
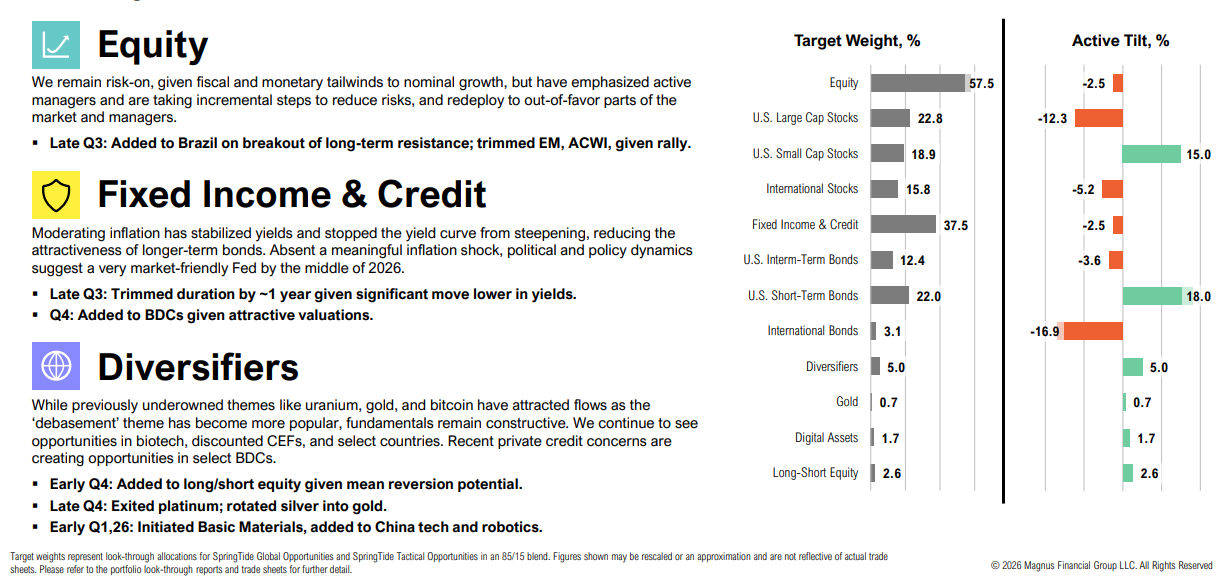
Positioning
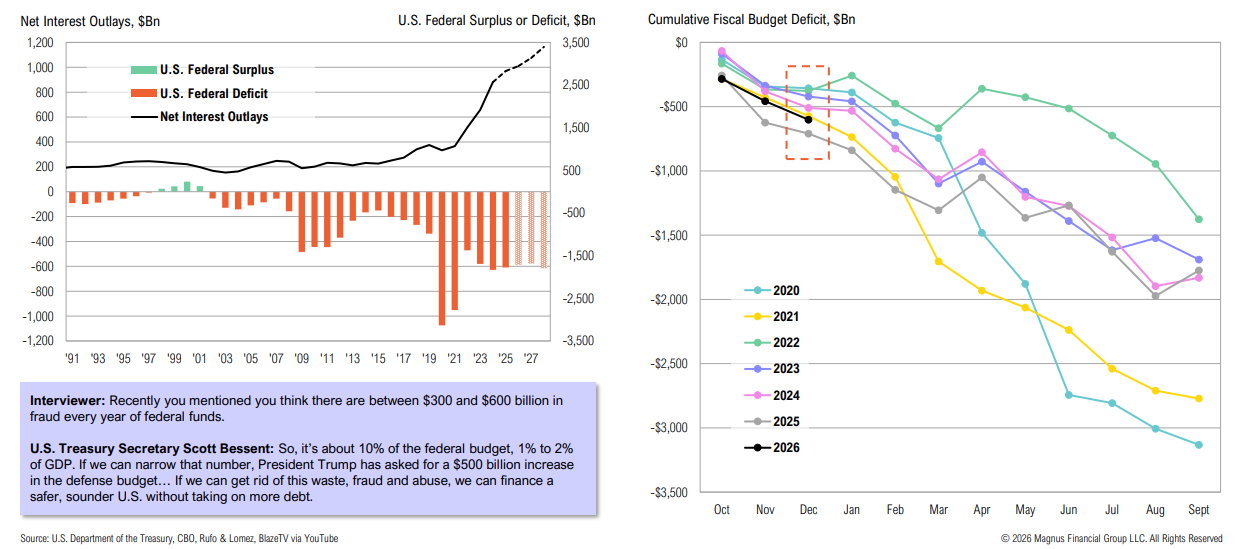
Fiscal Deficit
The deficit has risen to $602 billion in the first three months of the 2026 fiscal year; the deficit is expected to reach $1.7Tn in FY26
Snapback: The government shutdown is estimated to have a 1.5% drag on Q4 2025 GDP growth (annualized Q/Q), but is set to add +2.2% to Q1 2026
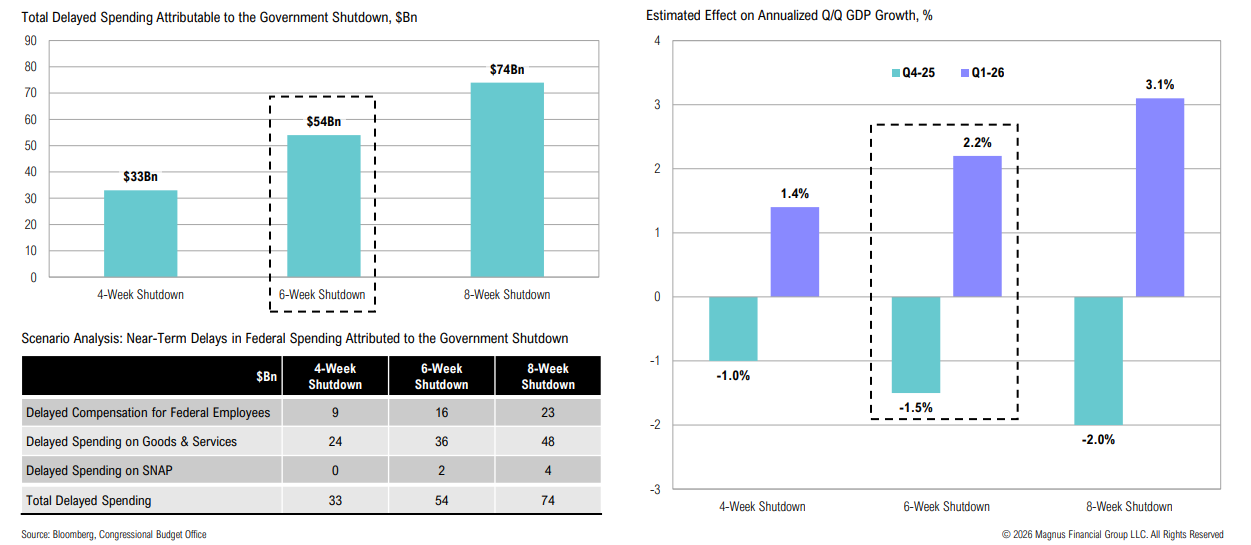
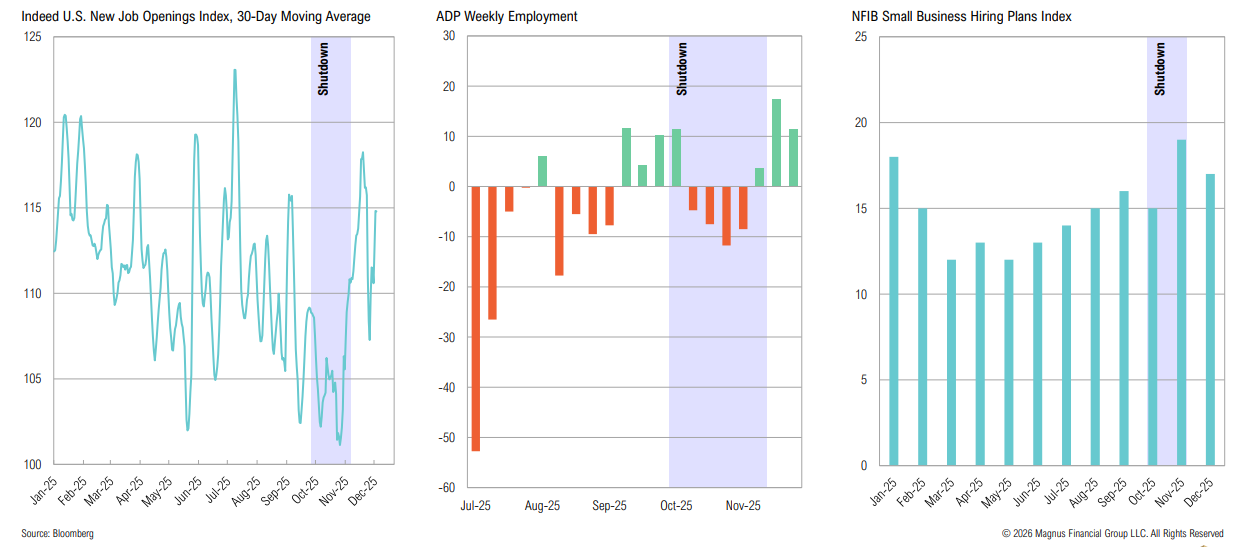
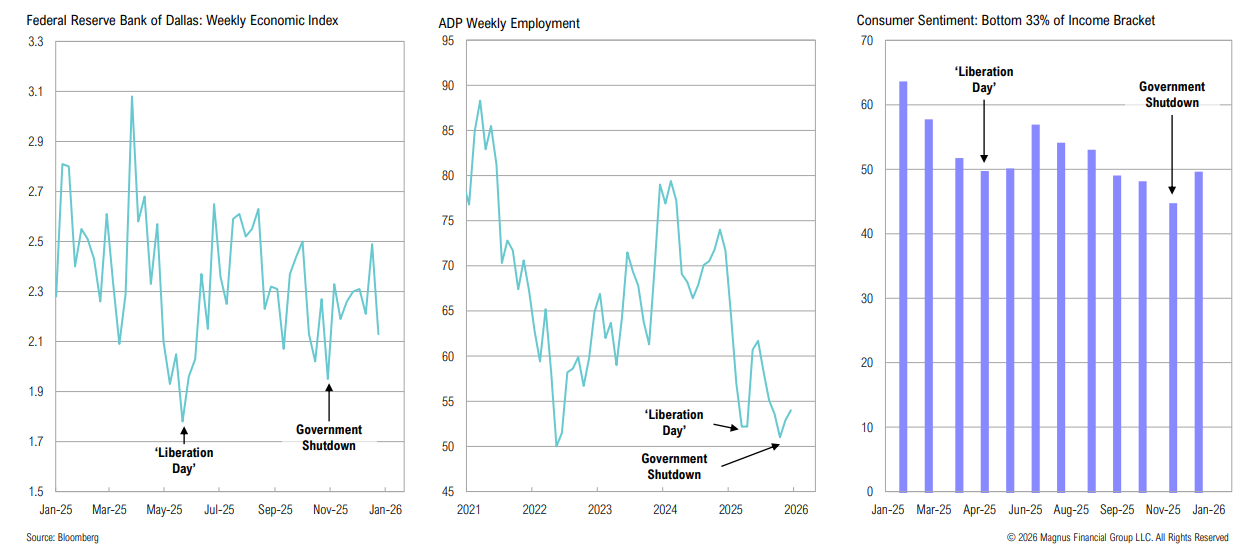
Government Shutdown
Measures of hiring and prospective hiring dropped during the government shutdown, but have largely rebounded as uncertainty resolved
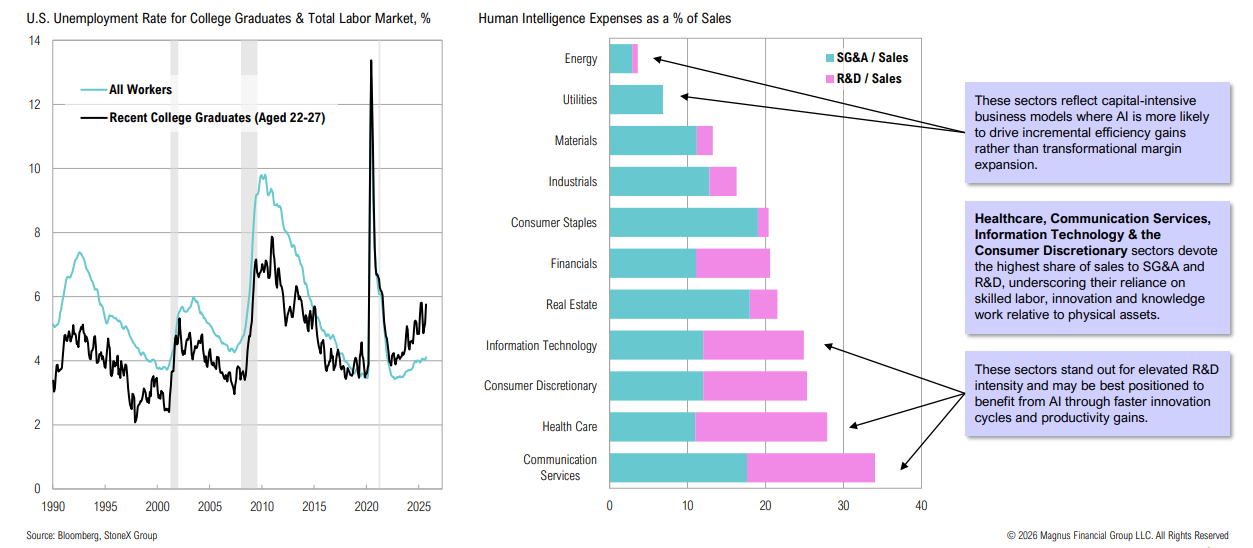
Labor Market
Is AI starting to cannibalize new hiring? The unemployment rate for recent college graduates is rising; some sectors may benefit more from AI advancements than others
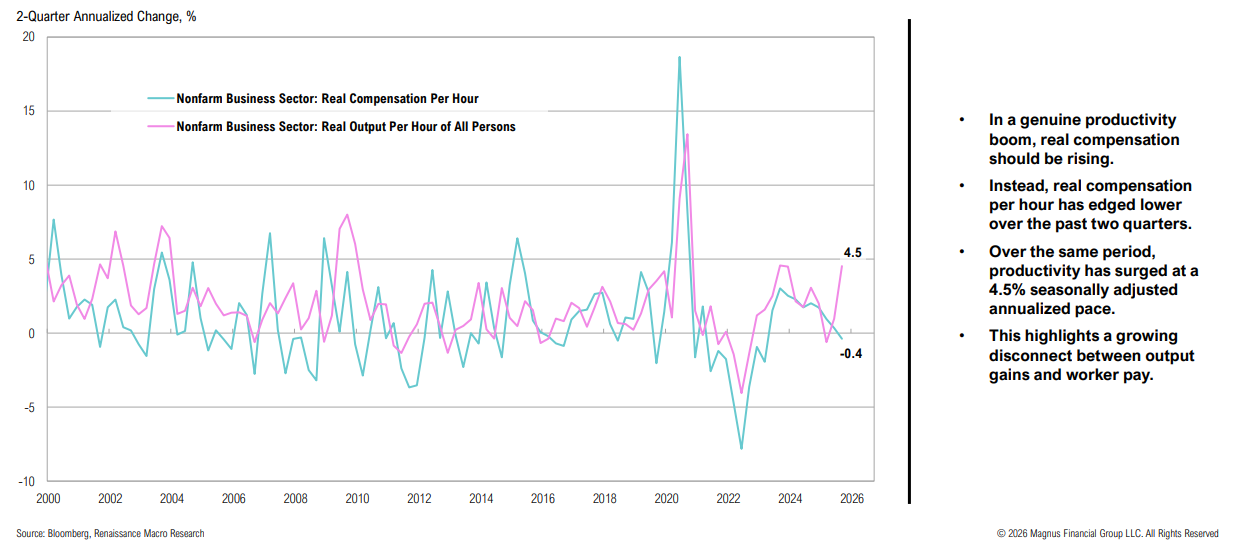
A K is emerging between output gains and worker pay: real hourly compensation has been edging lower while productivity has increased
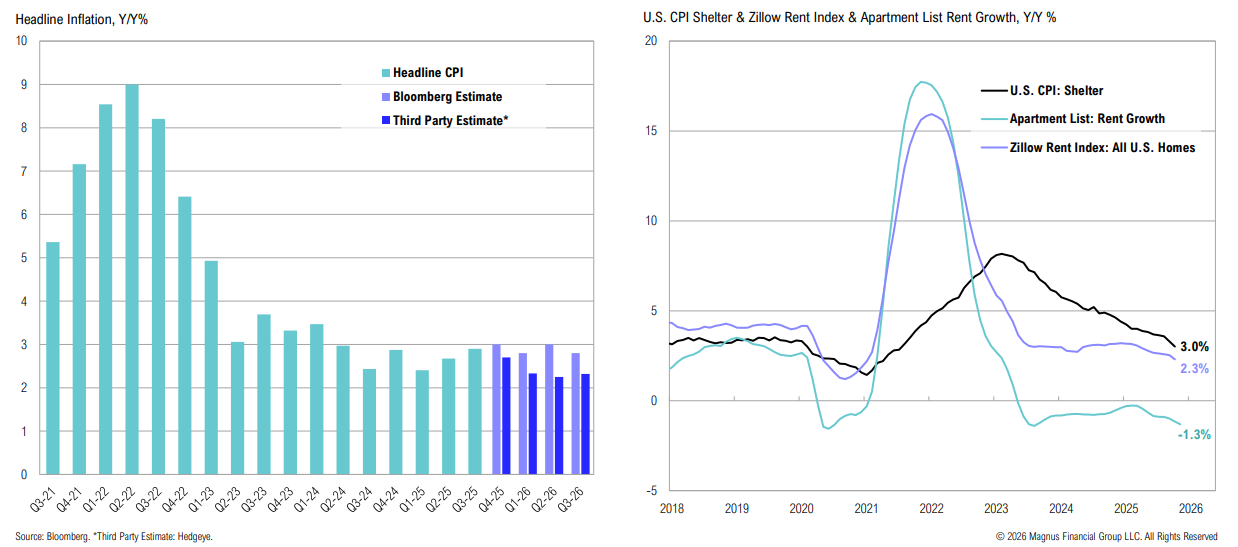
Inflation
Inflation has been above the Fed’s official 2% target for 58 months but shows signs of continued cooling, led by shelter—yet structural inflationary forces remain
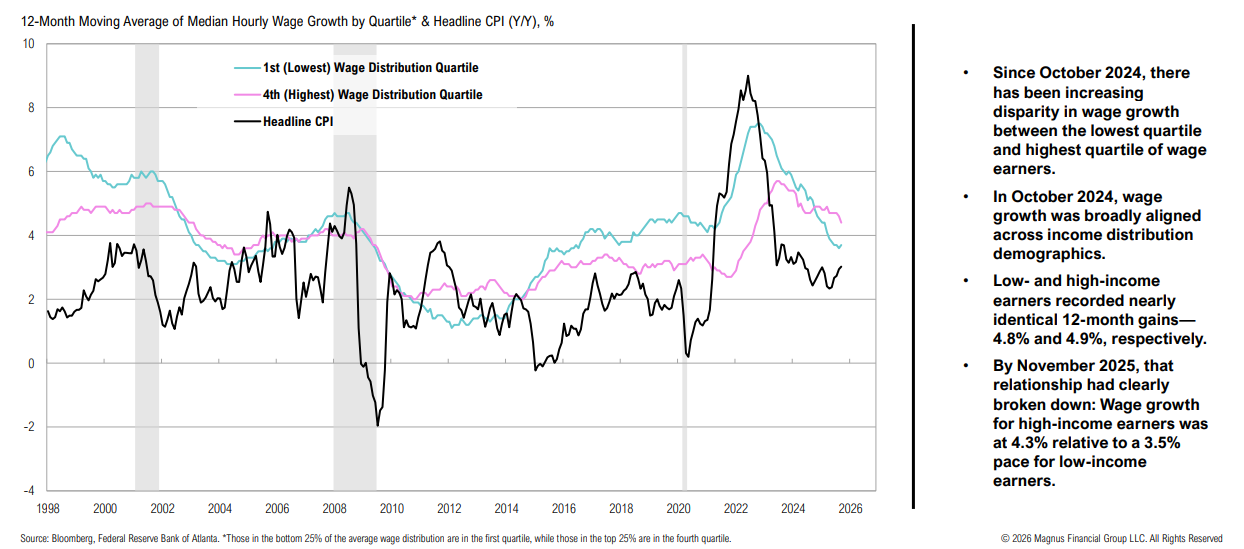
Inflation & Wage Growth
The K-shaped dynamic has also become increasingly visible in the labor market, particularly with wage growth
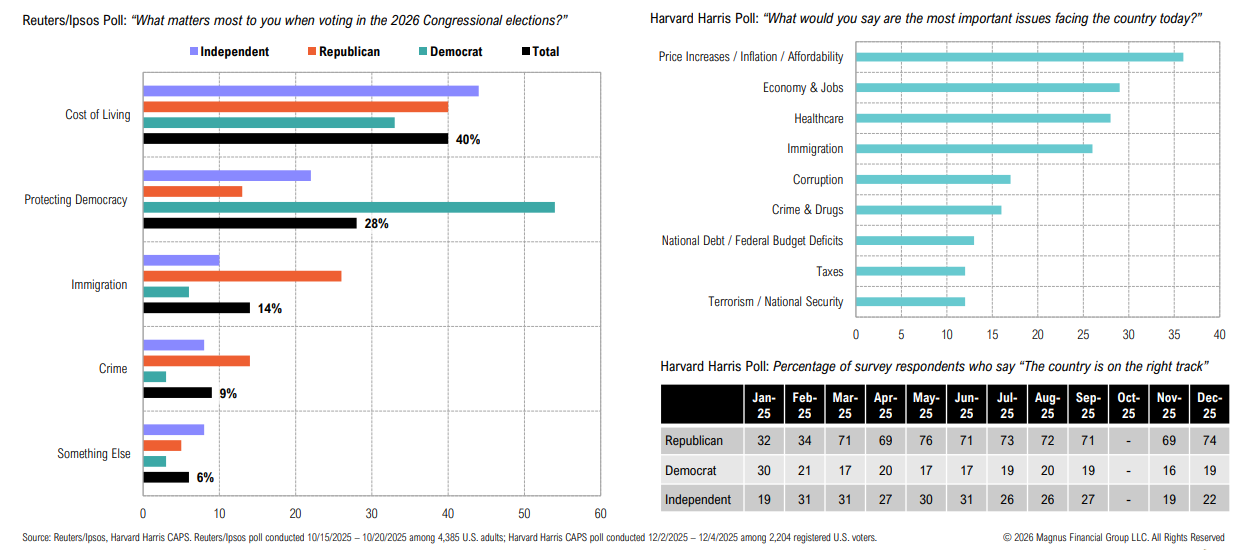
Midterms
Affordability and the cost of living are key issues for U.S. voters
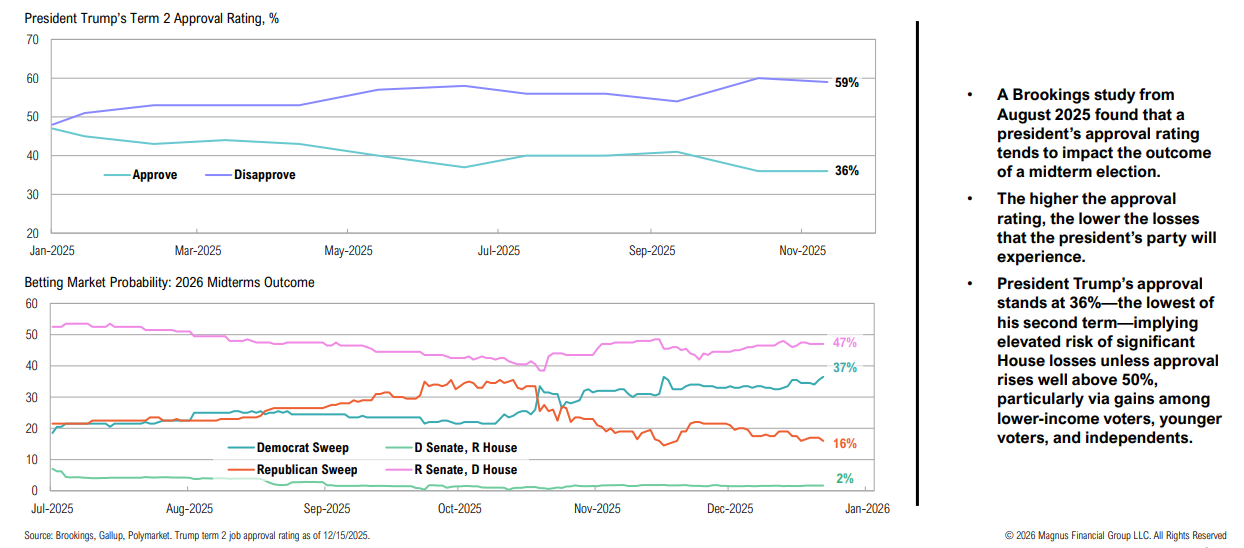
Approval ratings tend to have an impact on midterm outcomes; betting market odds currently point to the Republicans losing control of the House
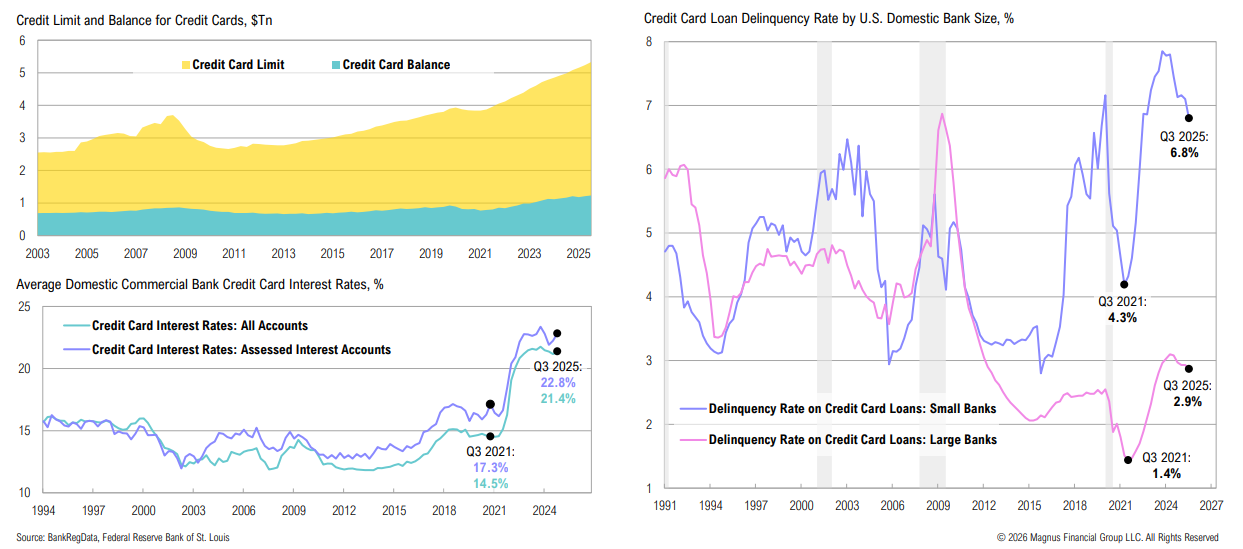
Consumer
Materially higher household leverage, at elevated rates: U.S. consumer credit card capacity, balances, and interest rates are at record highs
Affordability
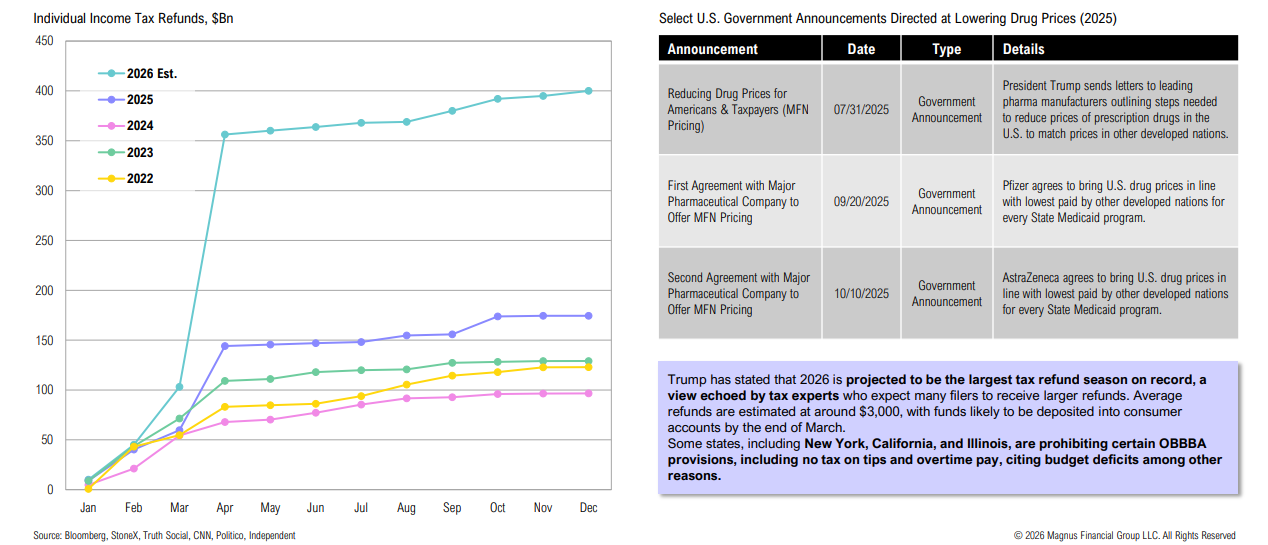
The government will need to shift focus to “affordability” to win potential voters; evidence of this shift is already starting to show (OBBBA tax breaks, lower drug prices)
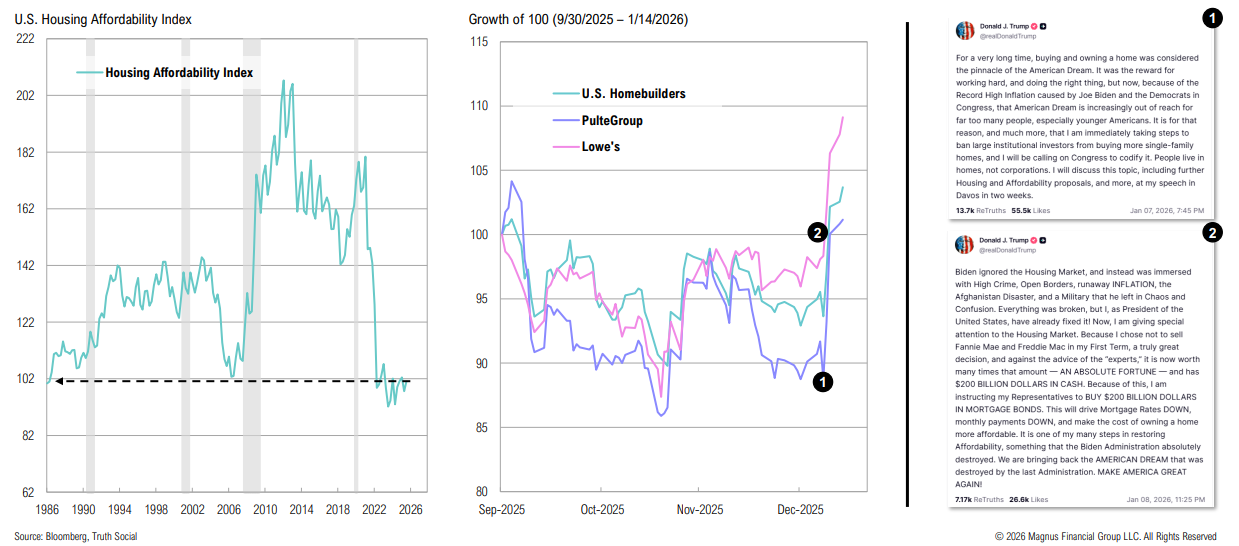
U.S. homebuilders responded well to Trump’s call to stop corporations from buying homes and his order for Fannie Mae and Freddie Mac to purchase $200bn worth of MBS
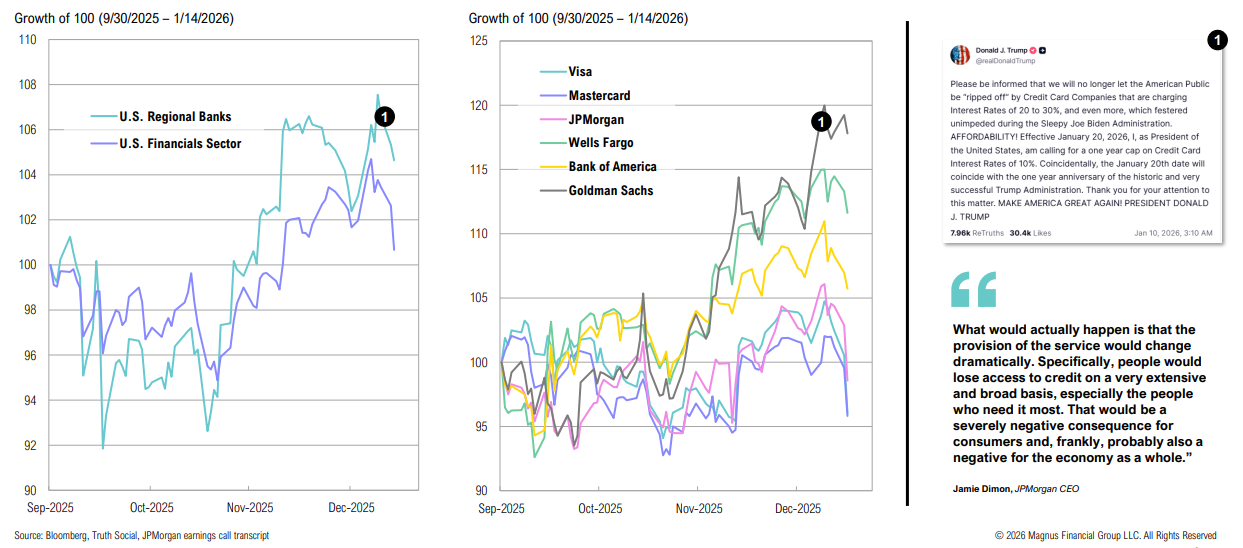
U.S. bank stocks did not respond well to Trump’s call for a one-year 10% cap on credit card interest rates
The Fed
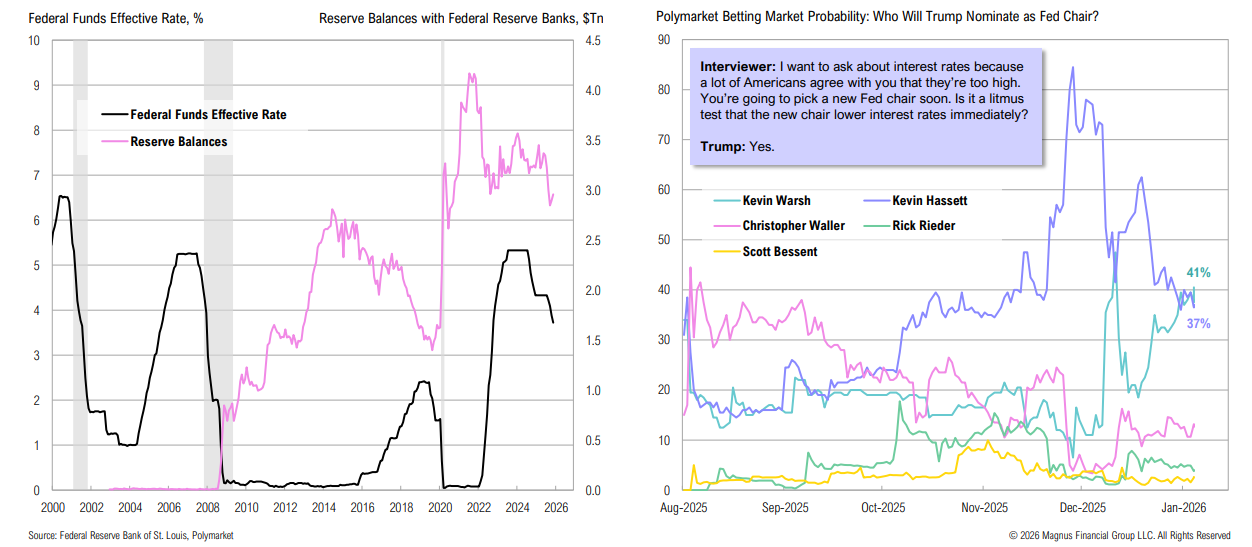
More K’s: the Fed is purchasing Treasuries while lowering interest rates, and a battle of the Kevins for the next Fed chair (per betting markets)
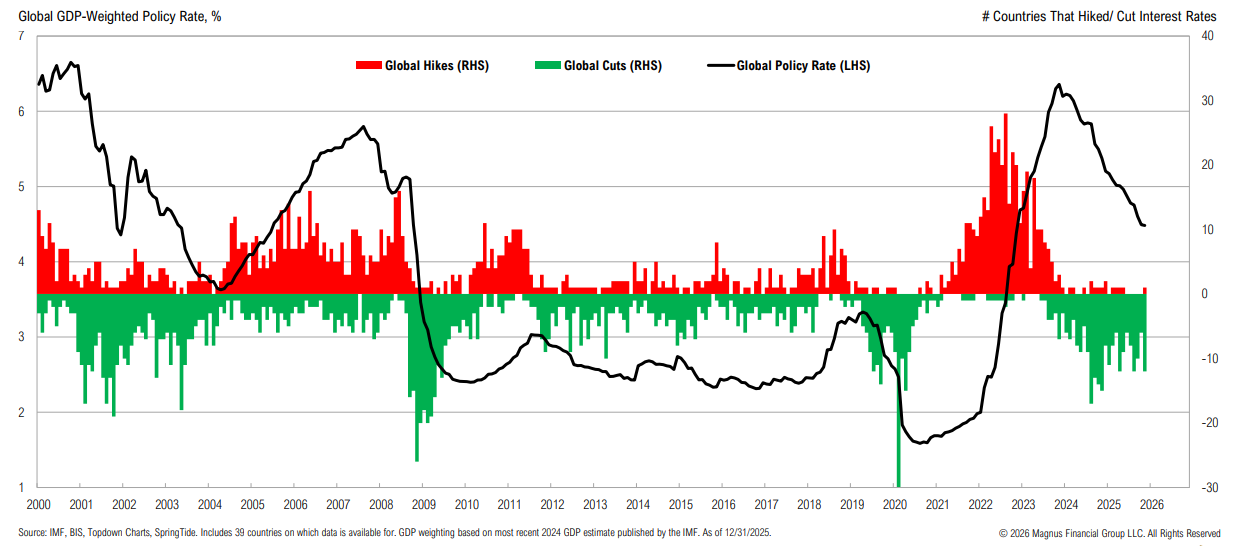
Monetary Policy
The global GDP-weighted policy rate now stands at 4.5% compared to 6.4% at the start of 2024
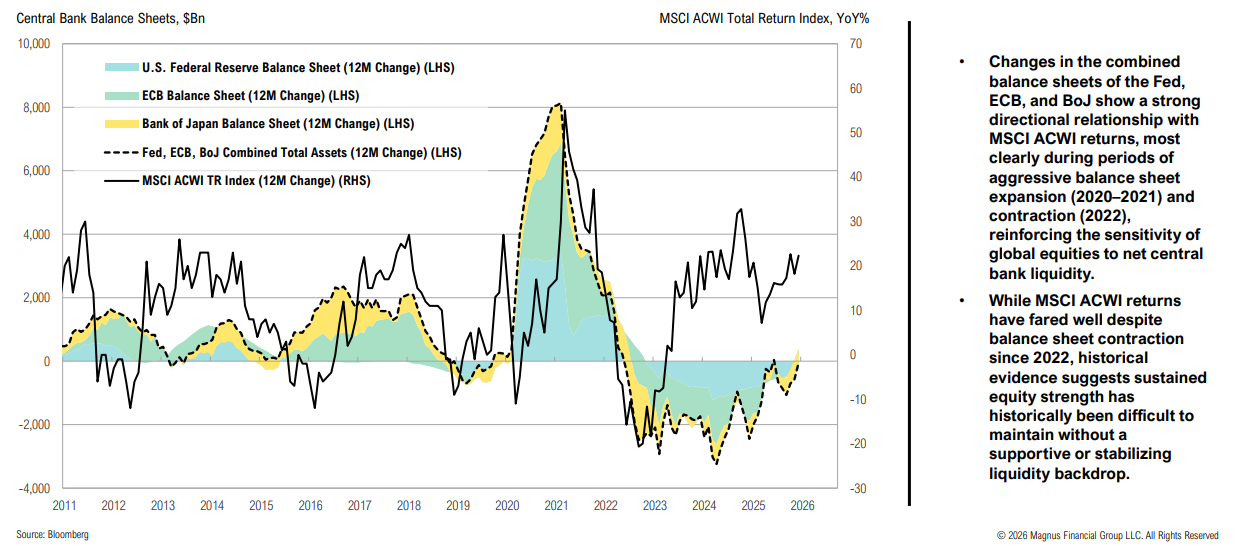
Monetary Policy
Renewed balance sheet expansion from central banks could further boost global stock performance
Sentiment
Will the administration’s attempts work? Consumer sentiment may be bottoming, and turning higher, albeit from low levels
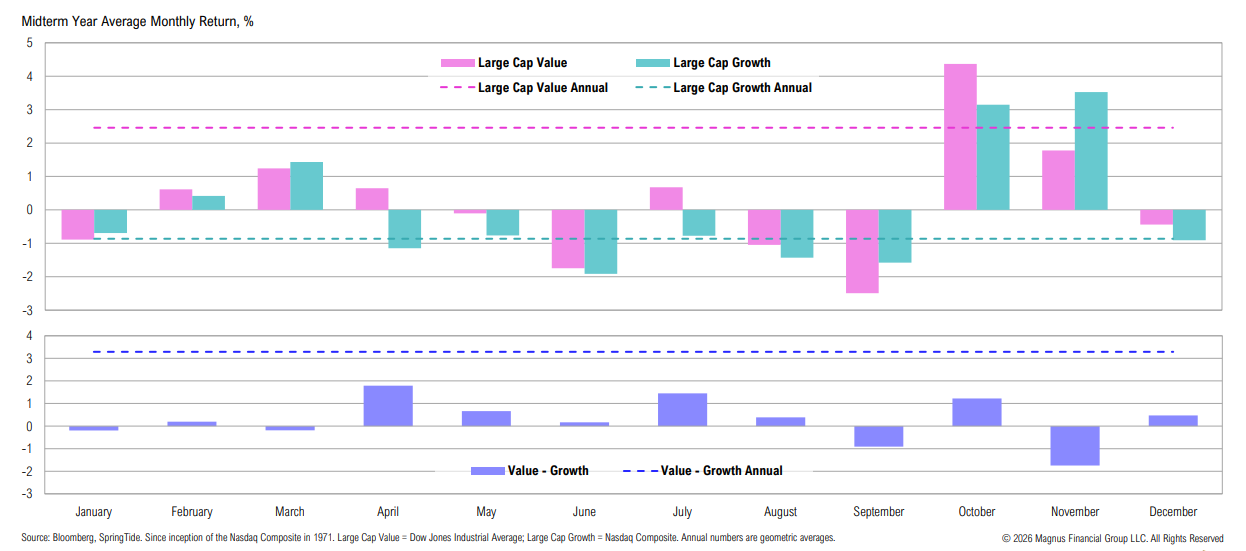
Midterm Volatility
Returns in midterm election years tend to be volatile early on, with performance typically improving later in the year
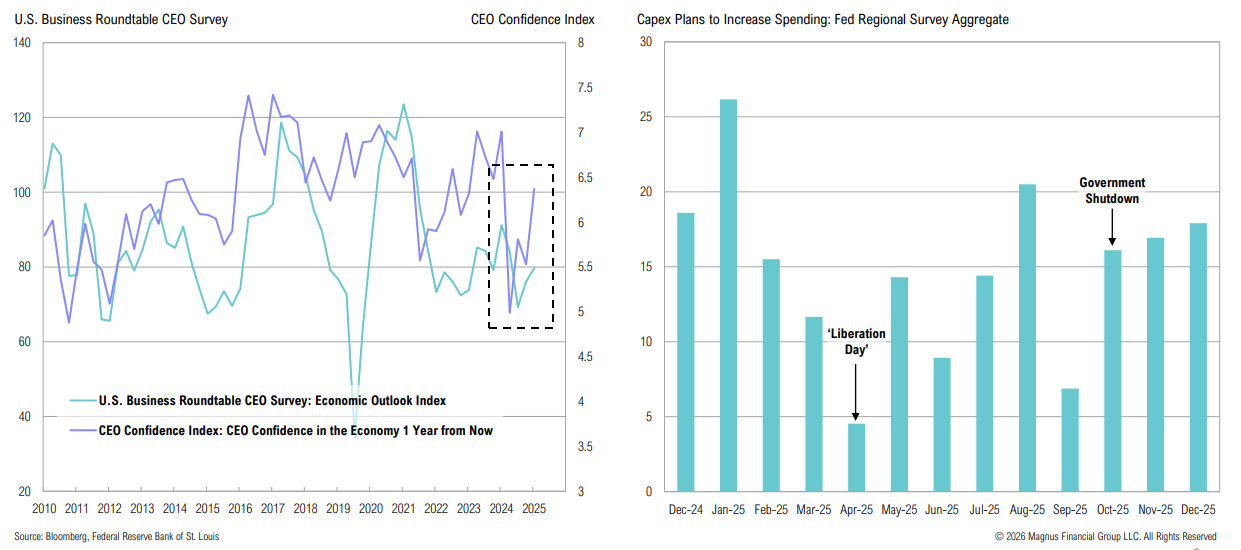
Corporate Sentiment
CEO confidence is rising, with broader (non-AI-related) capex spending plans increasing
U.S. Large Cap Stocks
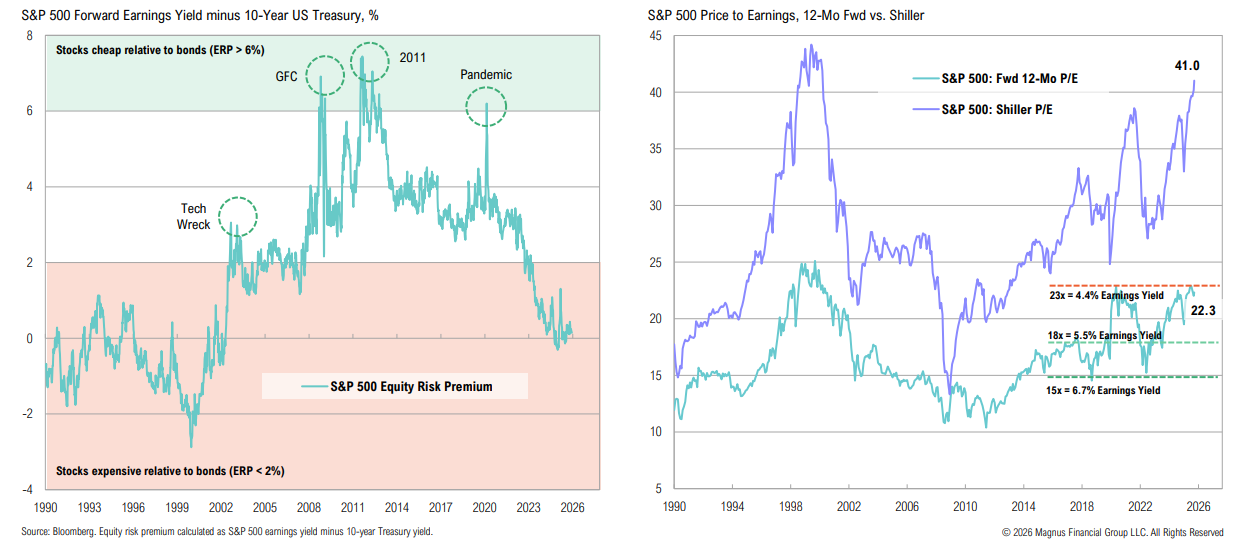
Using a simple yield-to-earnings yield comparison (ERP), U.S. stocks are less attractively priced vis-à-vis bonds than at any point since the 1990s; U.S. large cap valuations remain near extremes
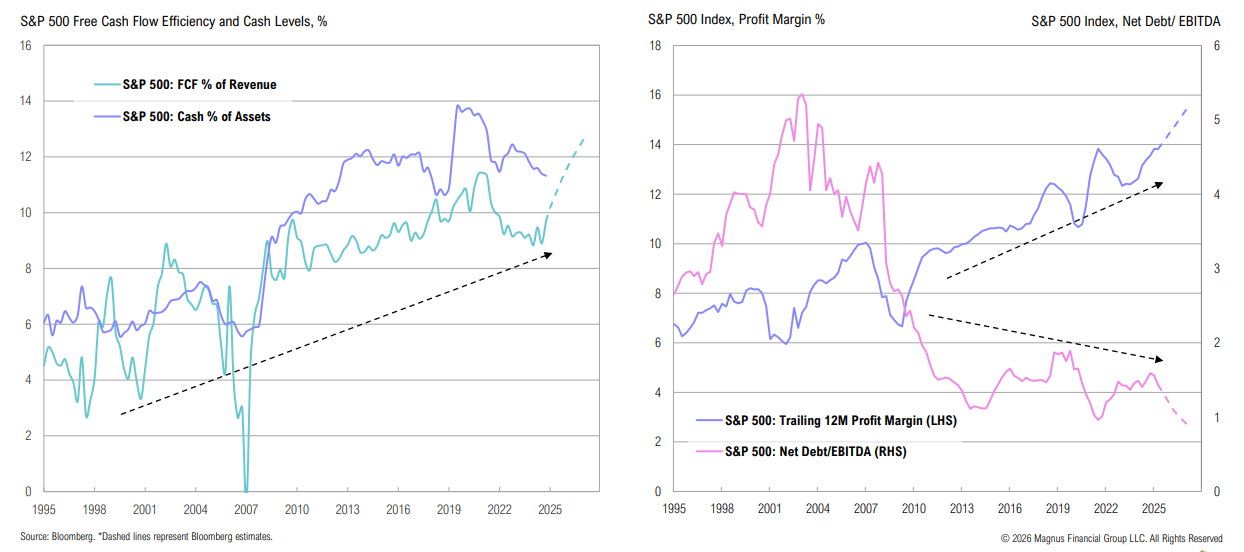
The corporate sector is strong by historical standards: capital expenditures, R&D, and tech investment have boosted scalability and efficiency, enabling improved margins and reducing debt
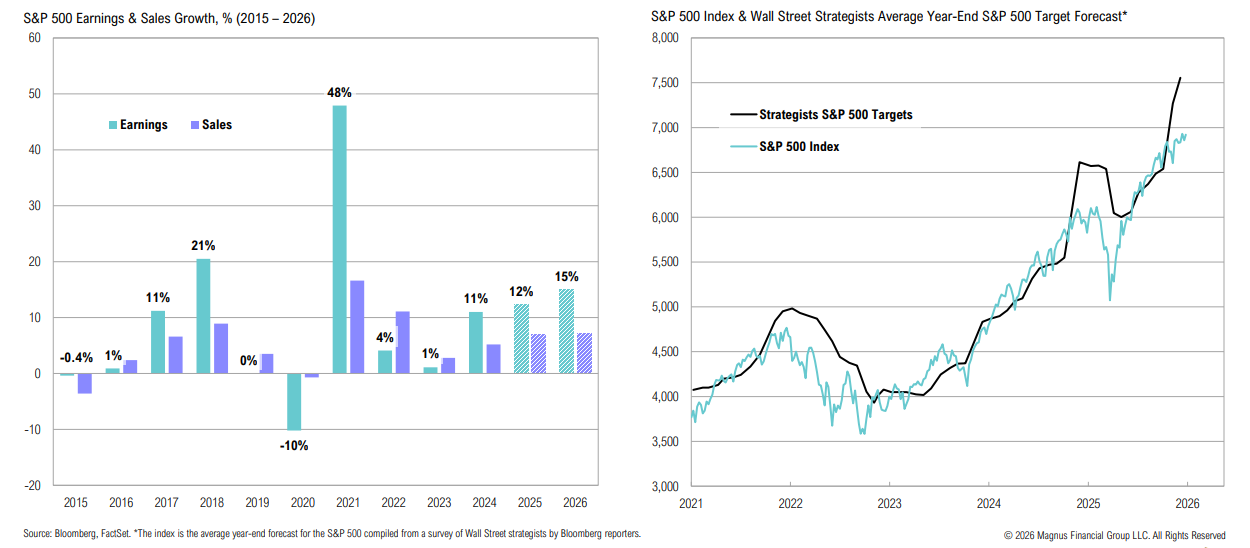
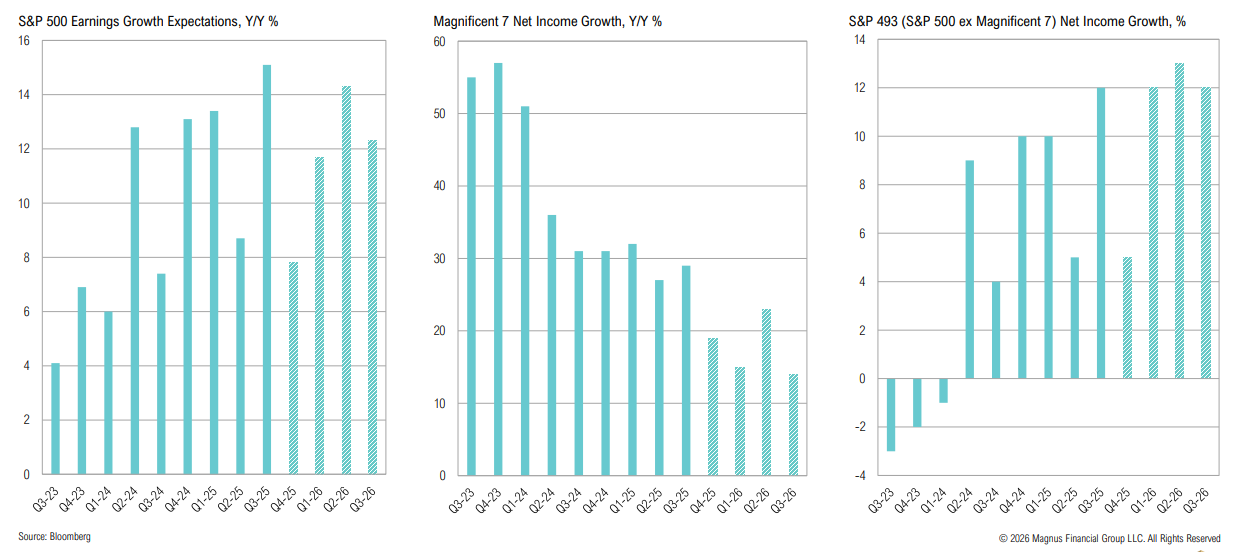
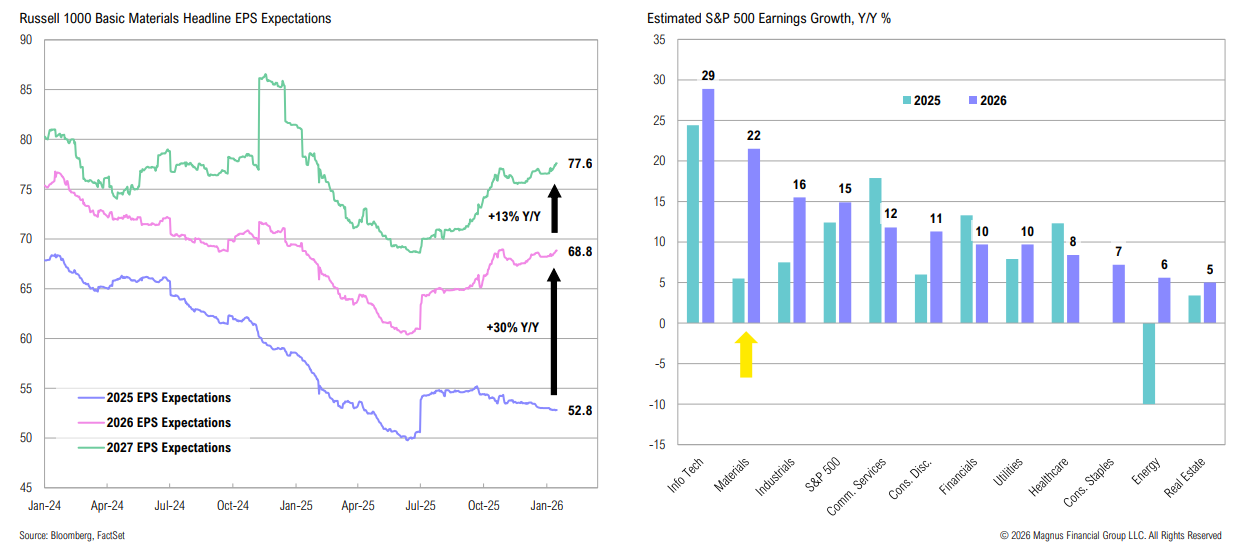
S&P 500 earnings are expected to grow 15% Y/Y, with net margins anticipated to reach the highest level since 2008; strategists have high hopes for 2026
The earnings growth broadening momentum continues
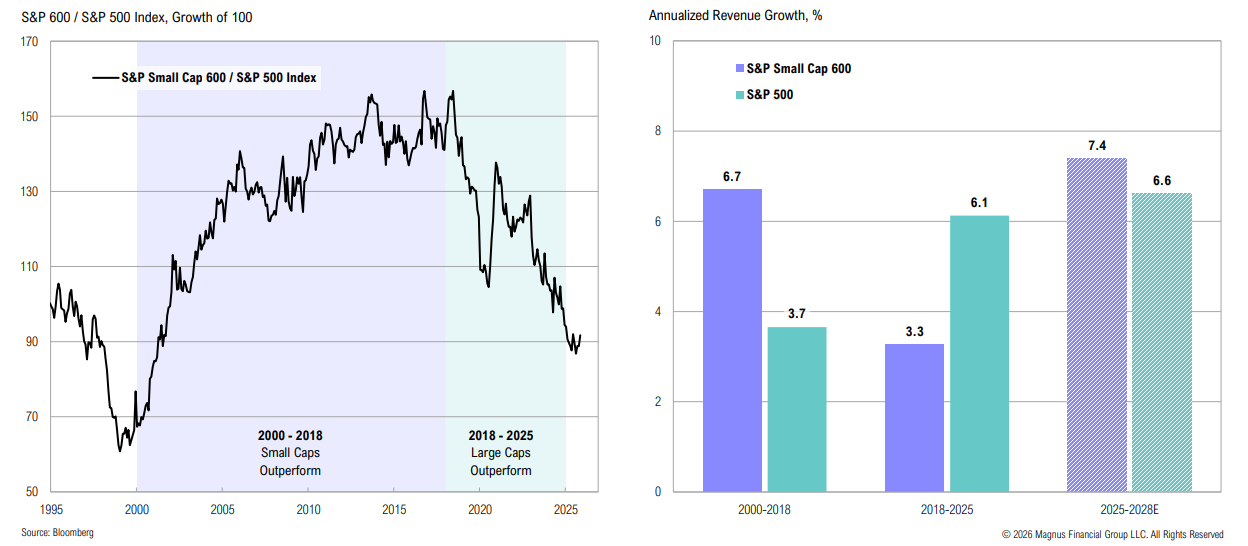
U.S. Large vs. Small Cap Stocks
Revenue growth has contributed to relative performance between small- and large-cap stocks, with small caps expected to outpace over the next three years
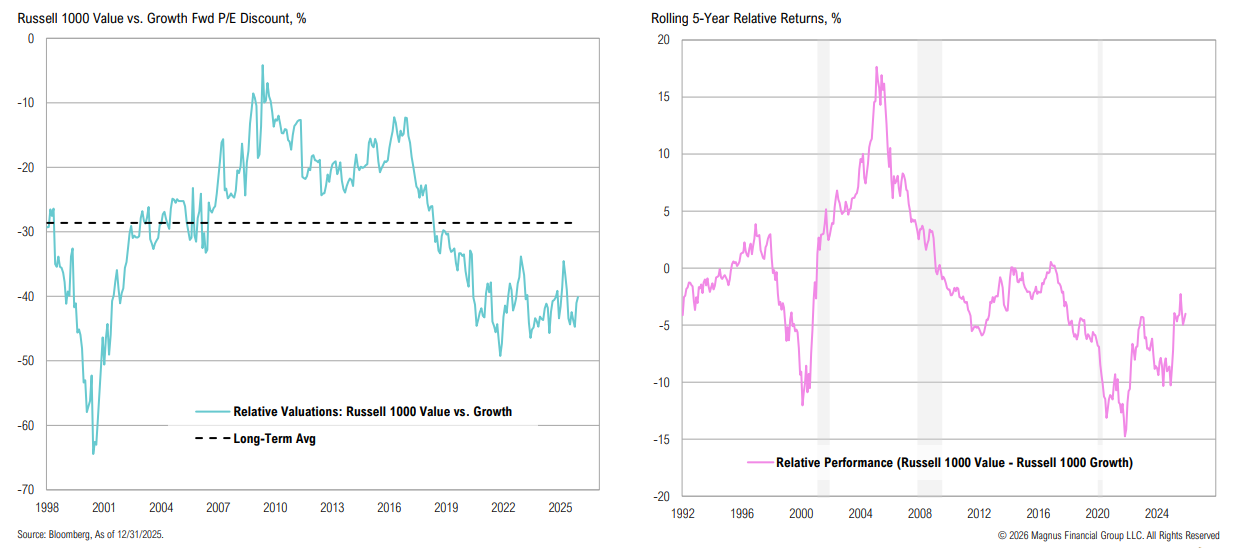
Growth vs. Value
Historically, U.S. large-cap growth and value stocks experience extended cycles of relative over- and underperformance; value currently trades at a 40% discount to growth versus a 29% LT average
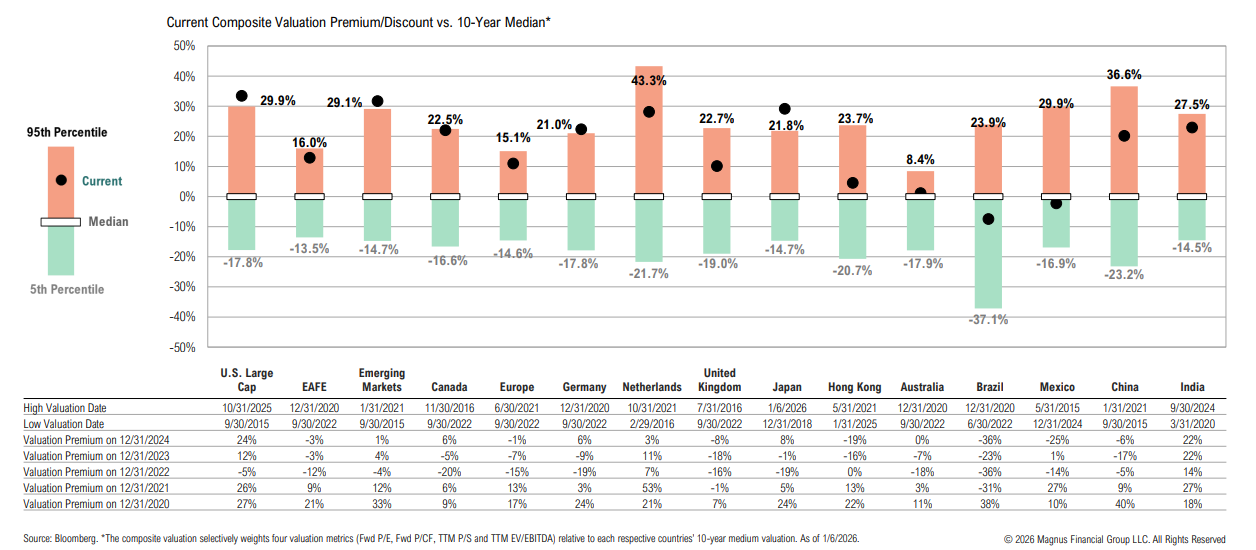
Global Valuations
Brazil & Mexico are the only countries trading below median, with Hong Kong and Australia near median valuations
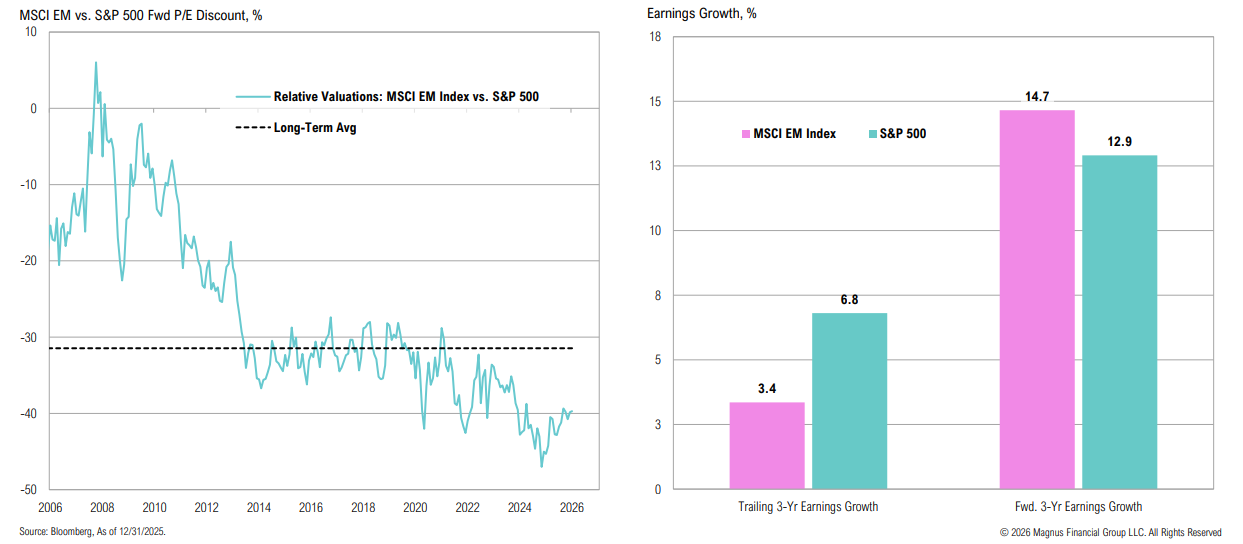
Emerging Markets
While EM stocks (like DM ex-US) trade at historically wide discounts to the S&P 500, earnings growth is expected to outpace U.S. equities over the next three years
Emerging Markets
Like U.S. stocks, both India and China trade above their 10-year average valuations but have stronger growth expectations over the next three years
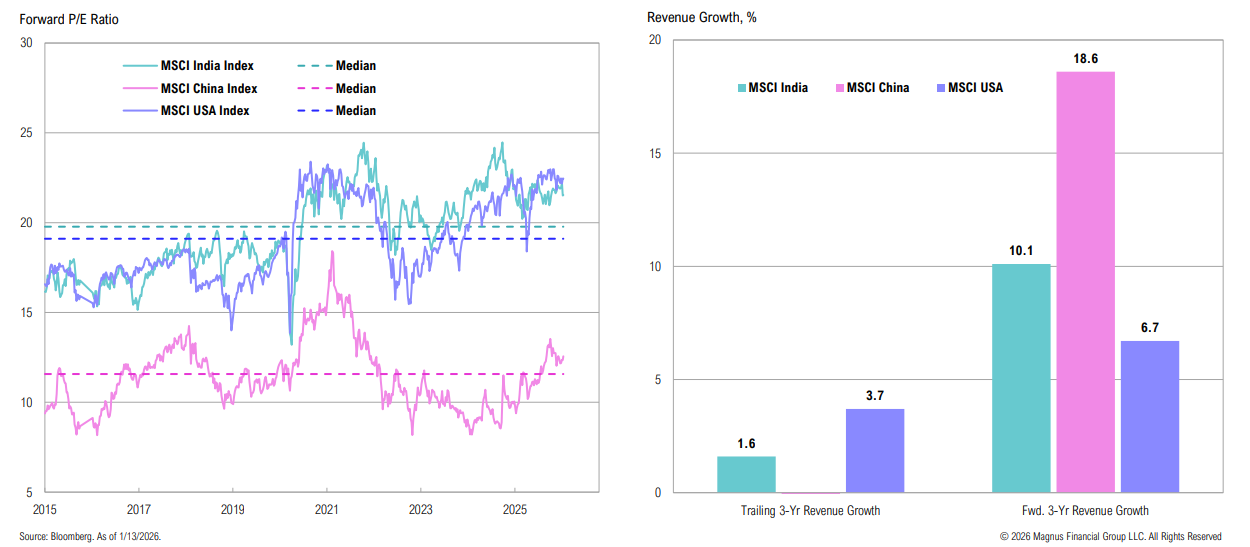
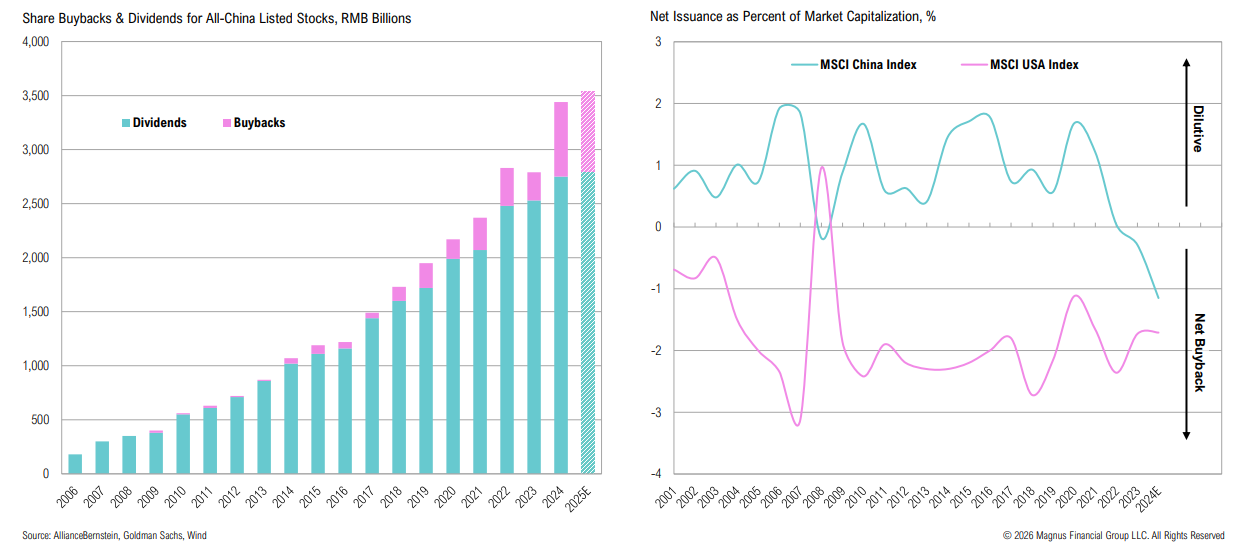
China is pushing companies to improve governance, and shareholder returns (like Korea and Japan); net buybacks have become accretive, boosting EPS
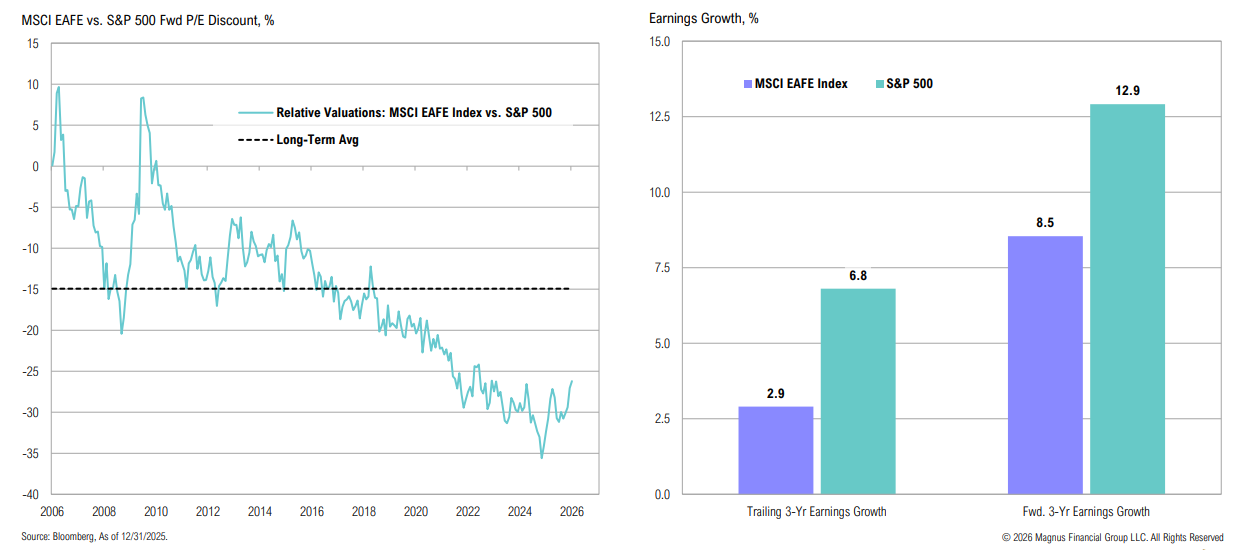
Ex-U.S. Developed Markets
While international developed market stocks continue to trade at historically wide discounts to the S&P 500, the dispersion in earnings growth (which has contributed to this discount) is expected to persist
Breakouts
Big Breakout Basket Recap: Since first discussed 6 months ago, the shift in policy towards industrialization/ onshoring has led to strong follow-through
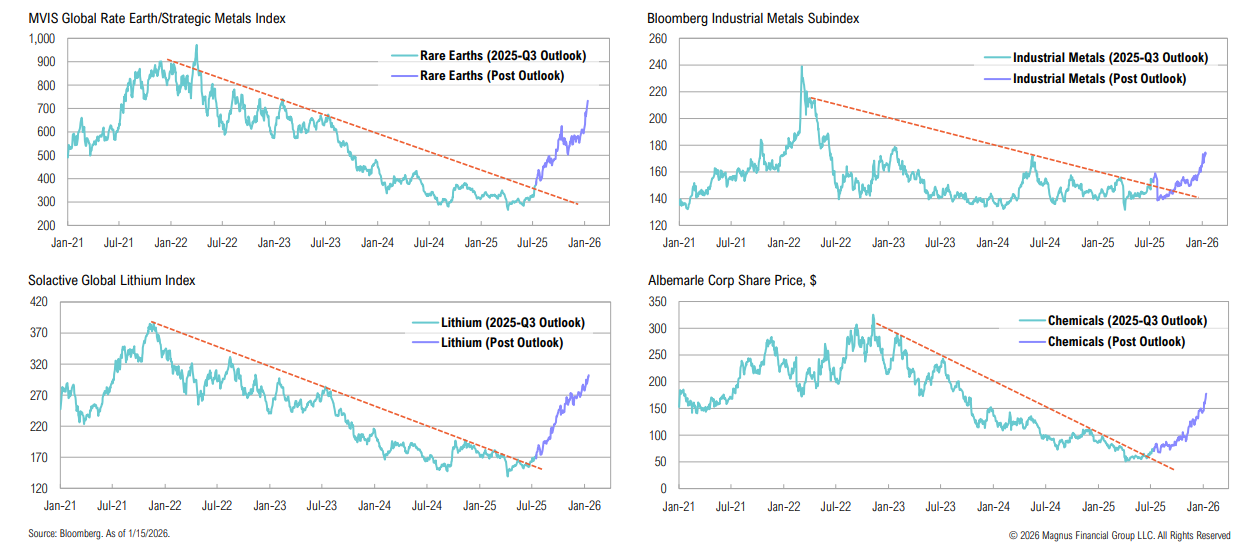
Materials
Back to basics: Basic materials have decisively broken out against 5-year resistance; the industry currently represents only 1.6% of the S&P 500
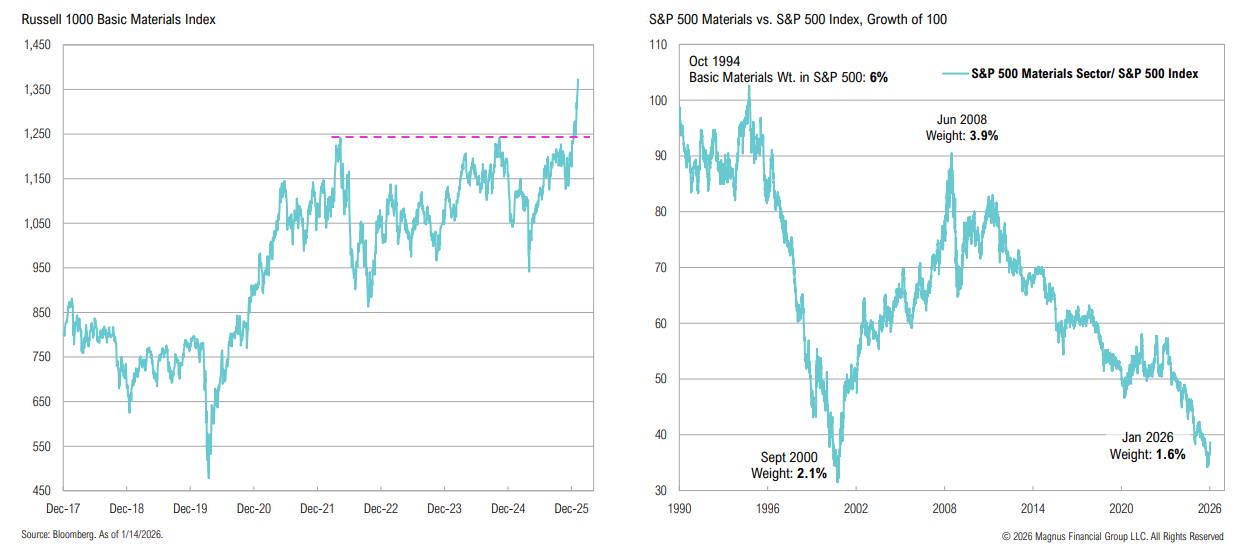
After trading sideways for nearly four years, basic materials have started to break out; the sector is expected to see the second-strongest earnings growth (after tech) in 2026
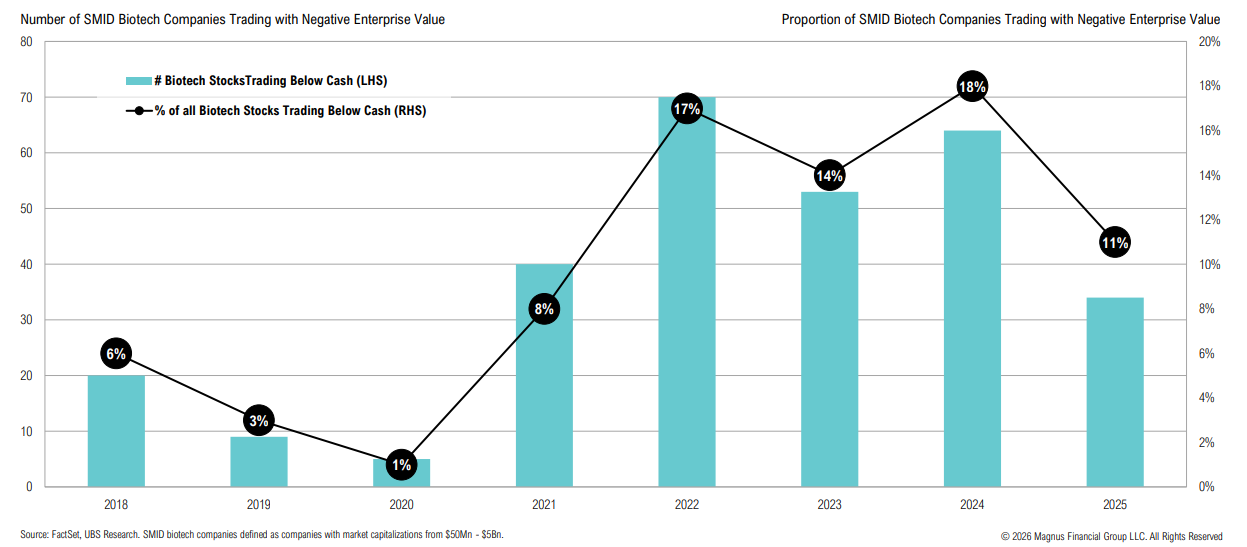
Biotech
The sharp rally in biotech stocks has resulted in fewer stocks trading below cash balances
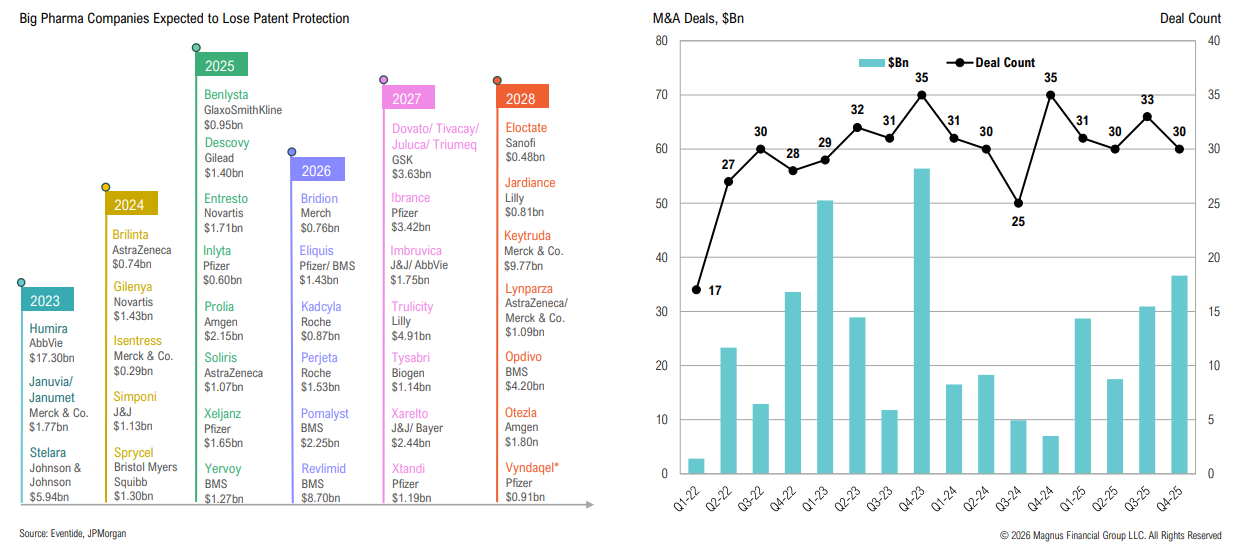
Despite recent strength, the healthcare sector continues to face structural headwinds from regulatory, financial, ethical pressures, and an ongoing patent cliff
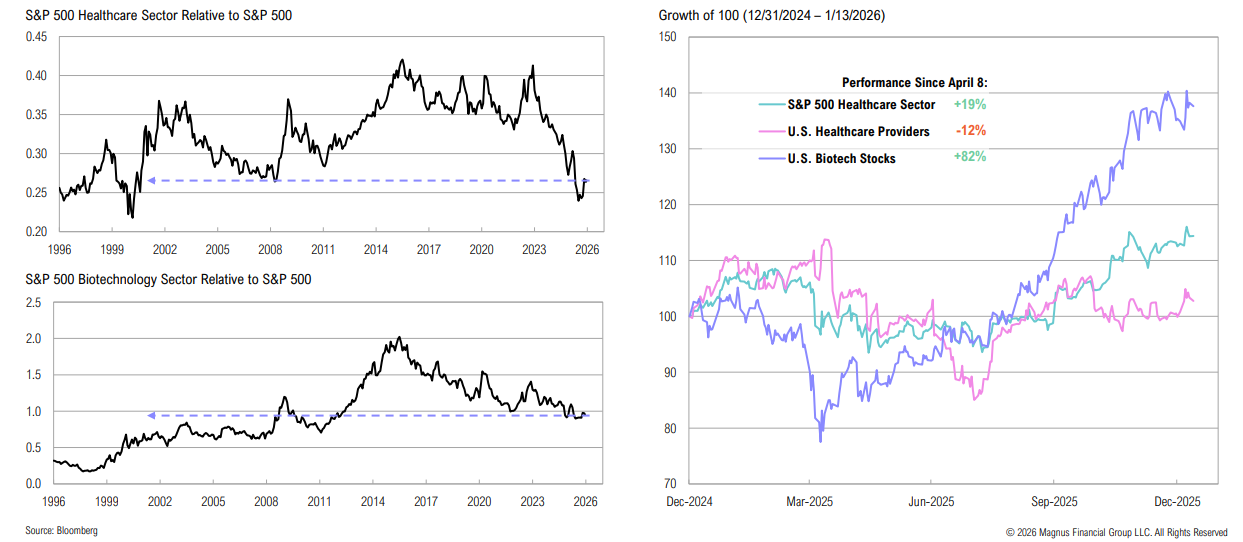
Big pharma’s “patent cliff” is well under way, with an estimated $200Bn in annual revenue lost by 2030—this positions the sector well for further M&A
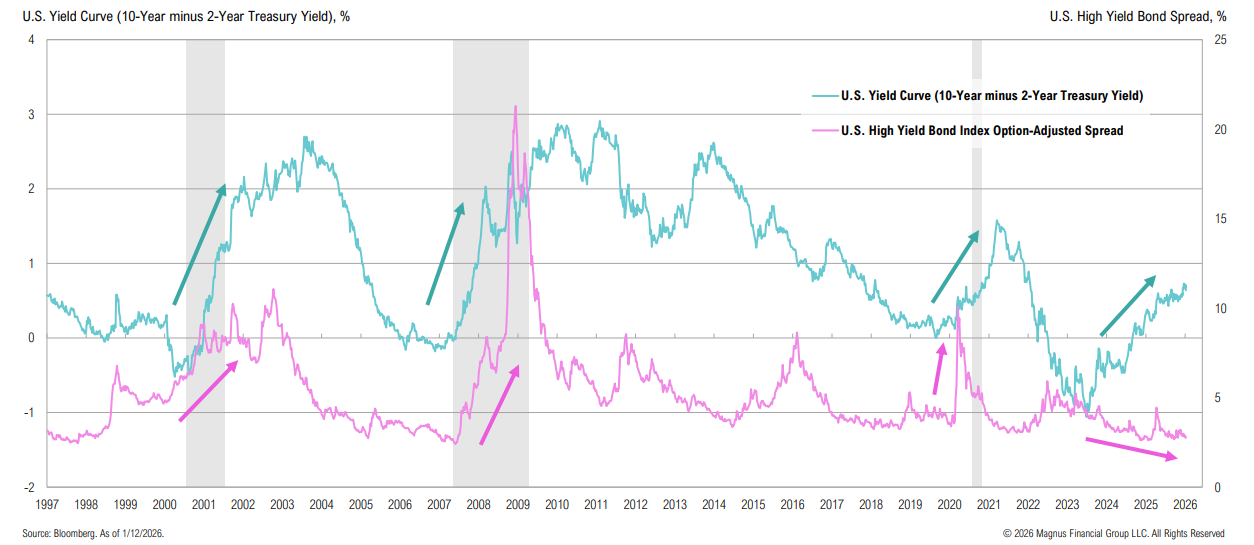
Yield Curve
Yet another K-shaped divergence: while the yield curve continues to steepen, credit spreads remain low by any long-term standard
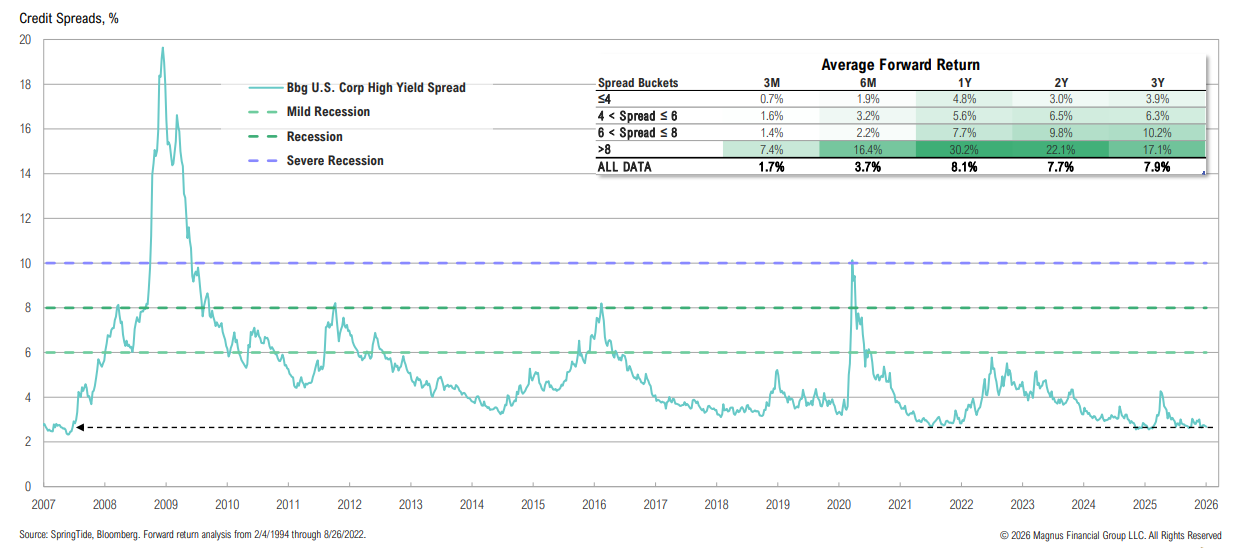
Credit Spreads
Credit spreads remain tight relative to history, ending 2025 at 2.7%; forward returns from these spreads have historically been lackluster
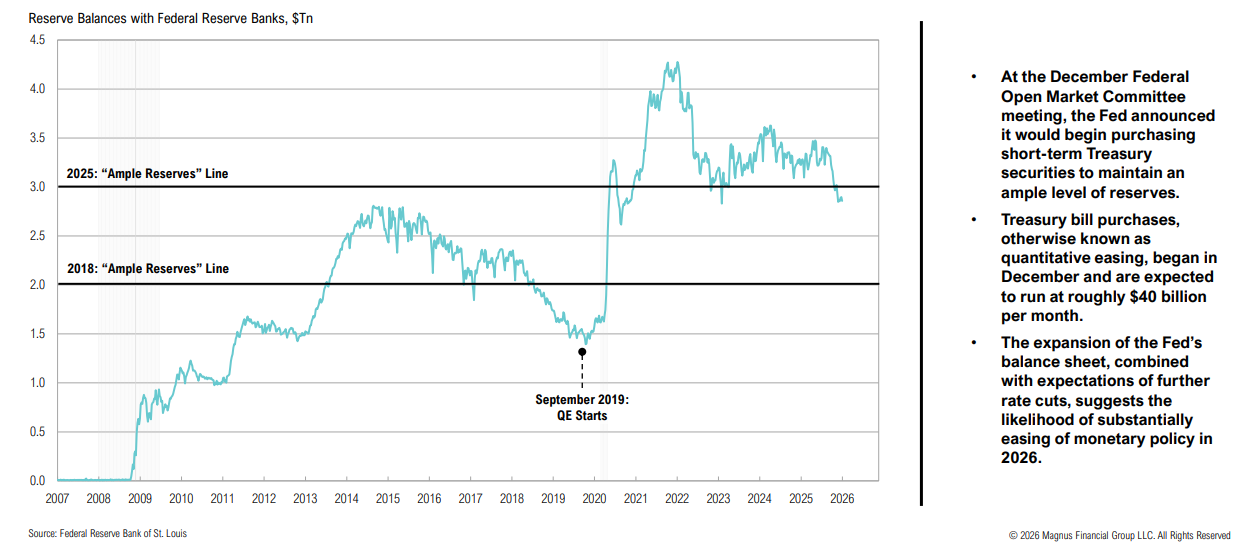
Fed Balance Sheet Expansion
The expansion of the Fed’s balance sheet, combined with expectations of further rate cuts, suggests the likelihood of substantially easing of monetary policy in 2026
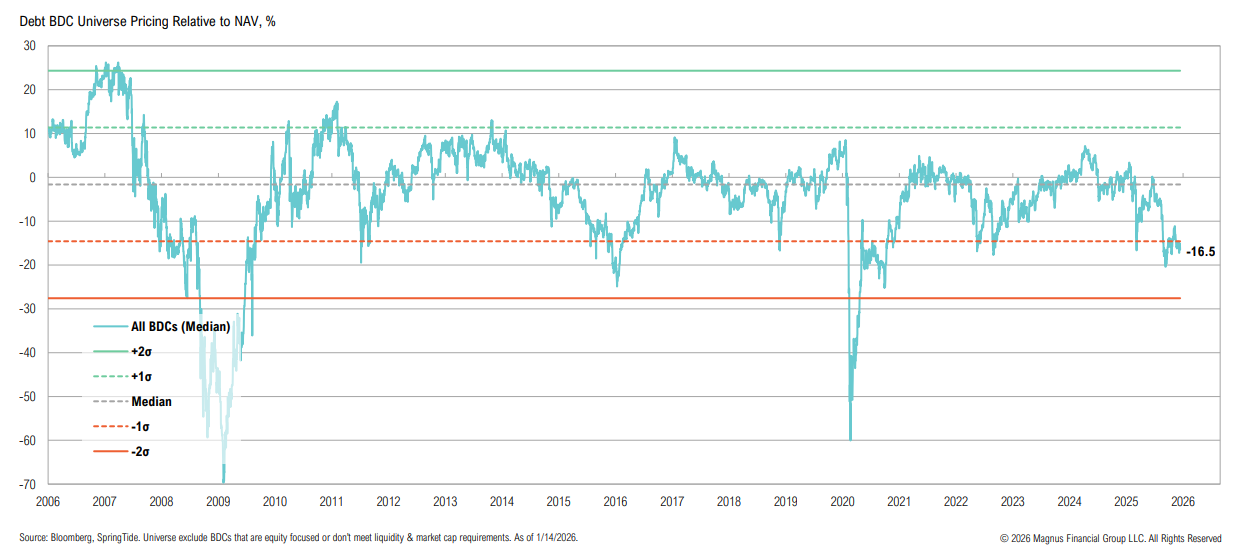
BDCs
While median discounts are at -16.5%, select funds are trading at even wider discounts, akin to recession levels
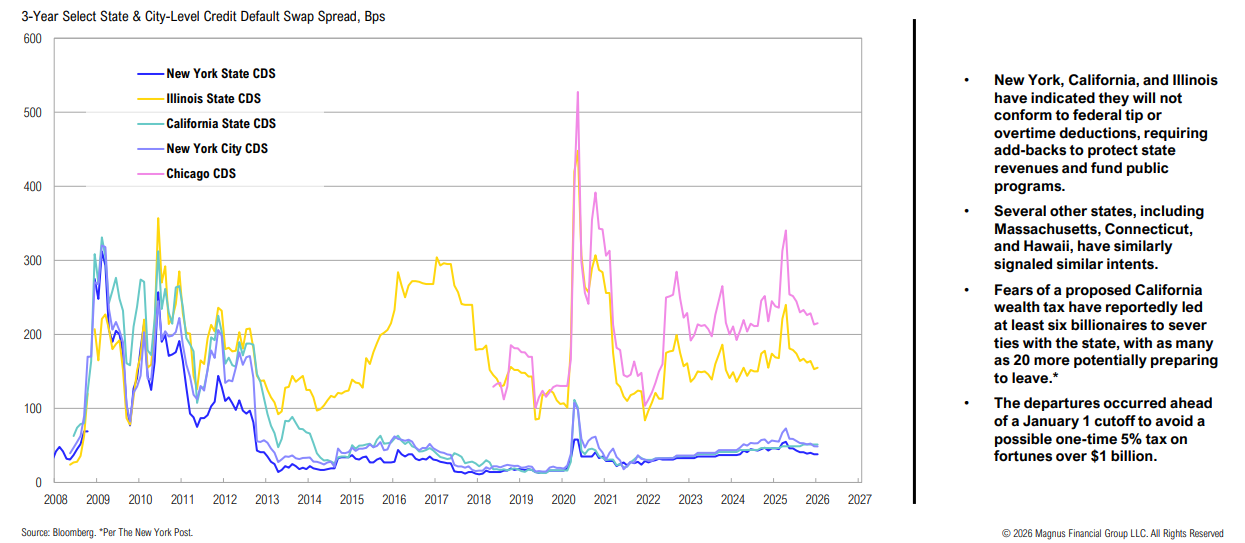
Munis
The state of some states…
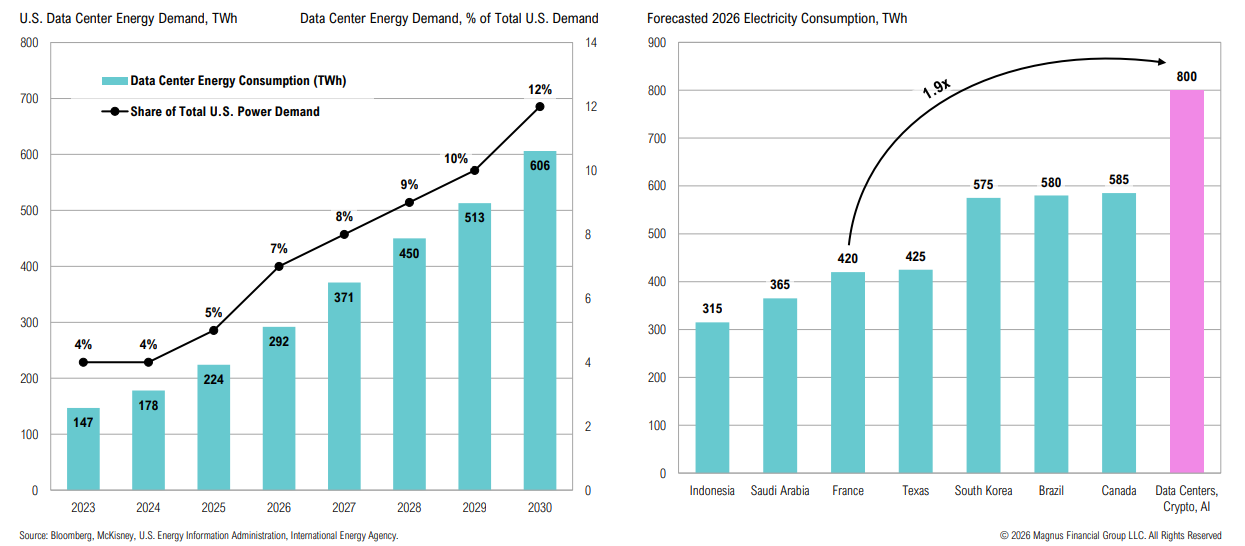
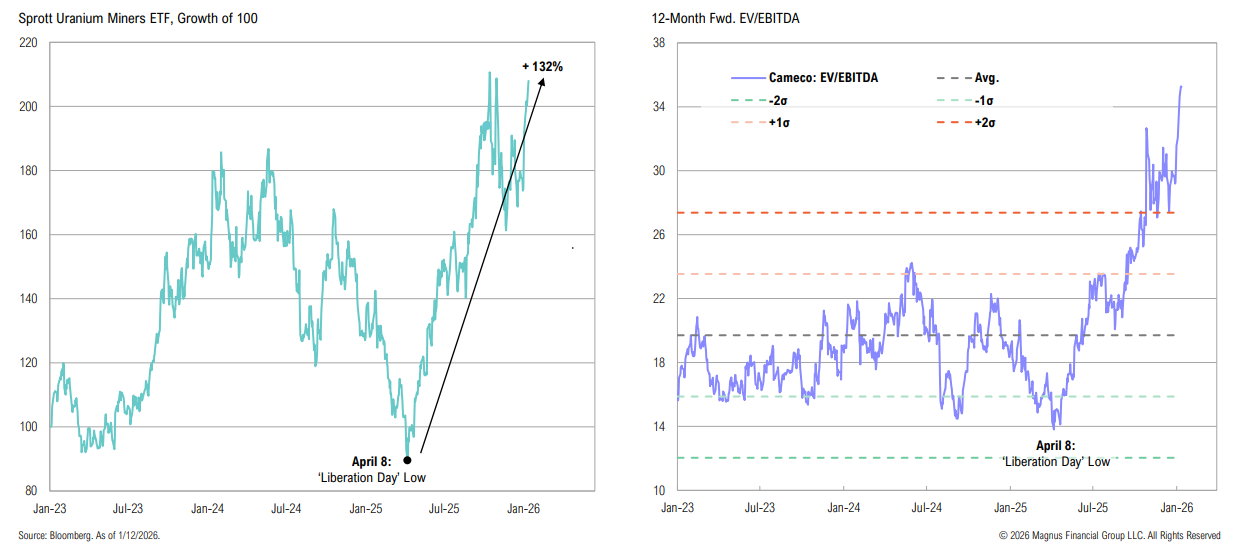
Power Play
Data centers are expected to drive U.S. power demand; in 2026, global data centers+ AI + crypto energy consumption is estimated to be nearly double that of France
Uranium and nuclear stocks have rallied >130% from the “Liberation Day” lows, driven by strong sentiment, solid fundamentals, and ongoing policy support; while the long-term thesis remains intact, valuations appear stretched
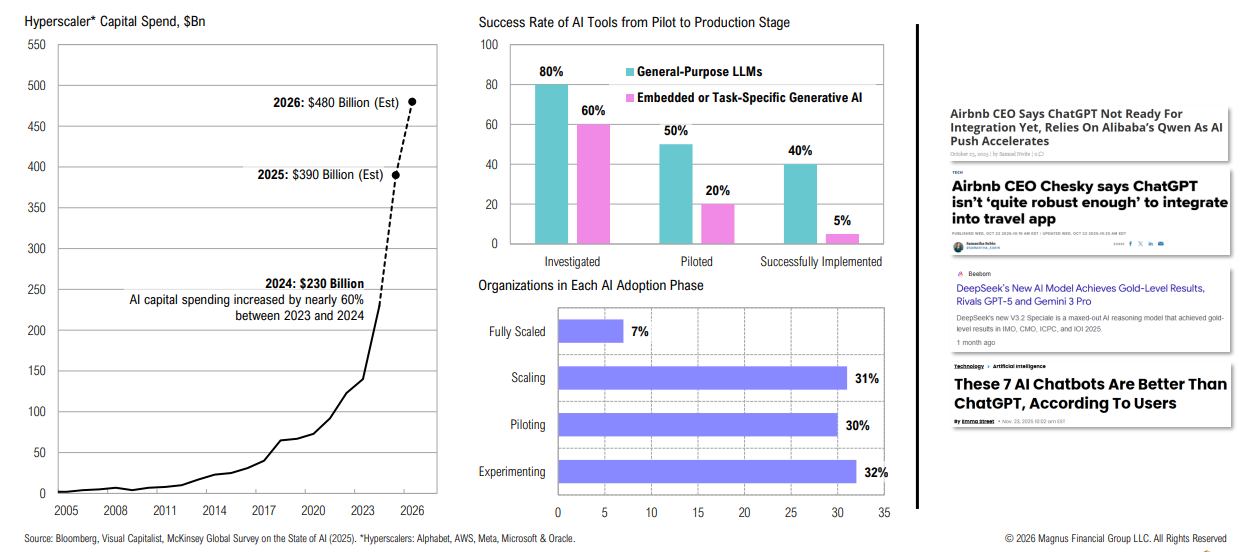
AI
Despite skyrocketing spending, the overall success rate of AI tools and adoption remains somewhat muted; what if access to the most advanced chips and models isn’t necessary?
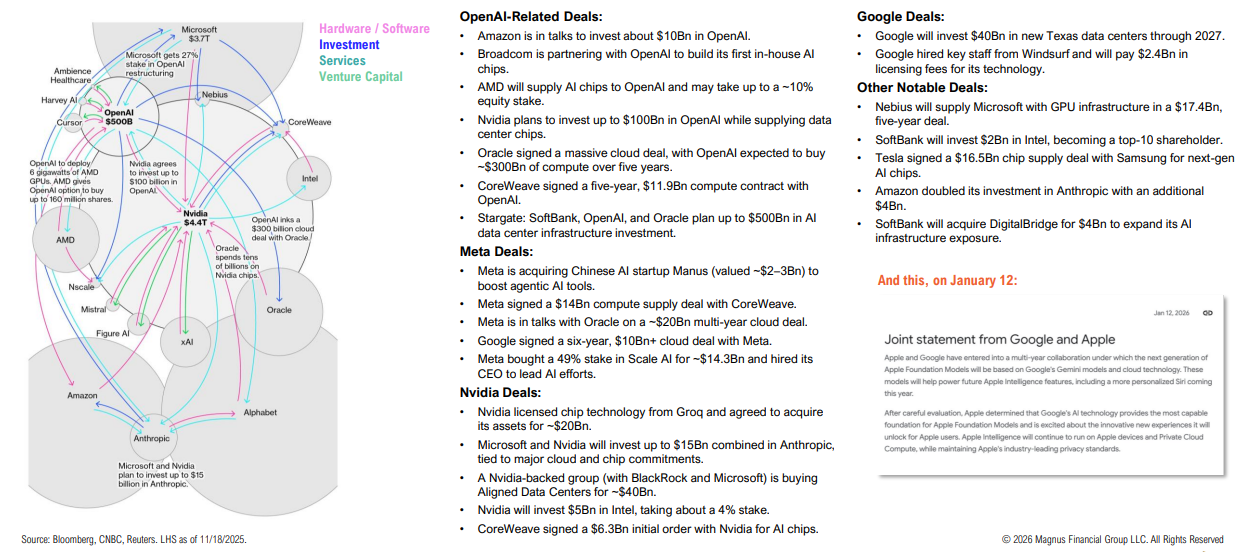
The circularity of AI investments continues to grow
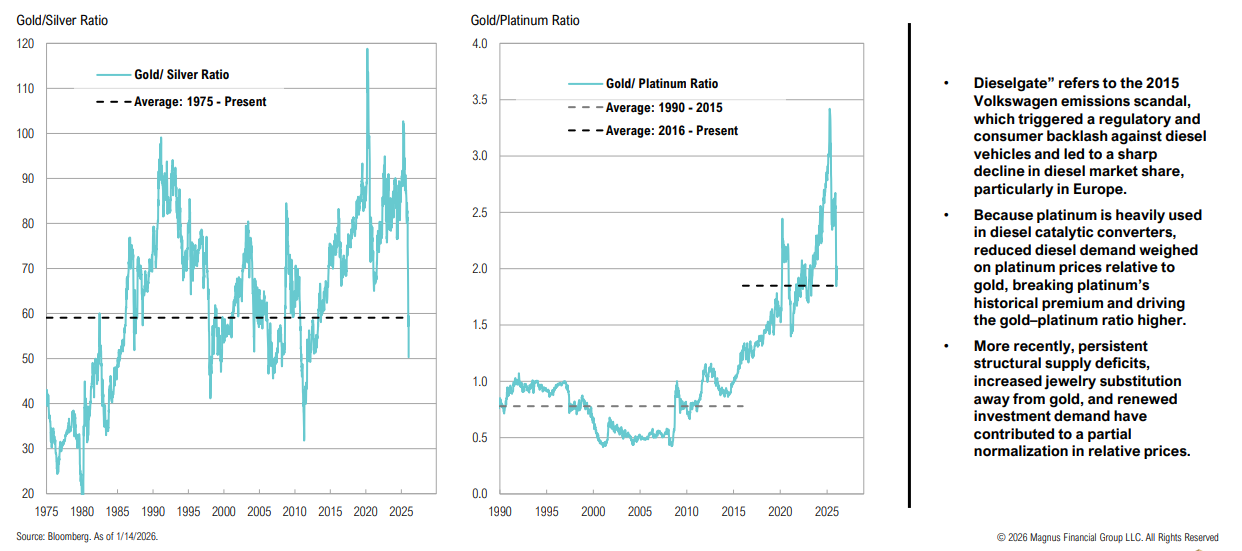
Precious Metals & Gold
After a parabolic December and YTD rally, silver has declined below its 50-year average vs. gold; the gold–platinum ratio (disrupted by “Dieselgate” in 2015) is back in line with its 10-year average
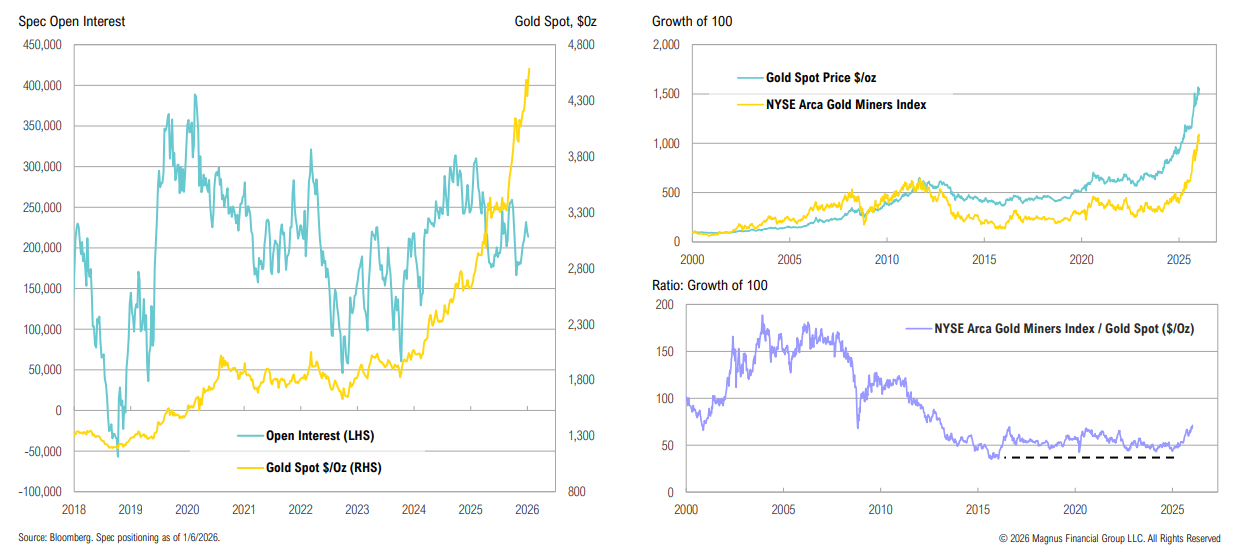
Despite gold spot prices reaching a new record high in December, spec positioning remains contained; even after rallying over 150% in 2025, gold miner fundamentals remain compelling
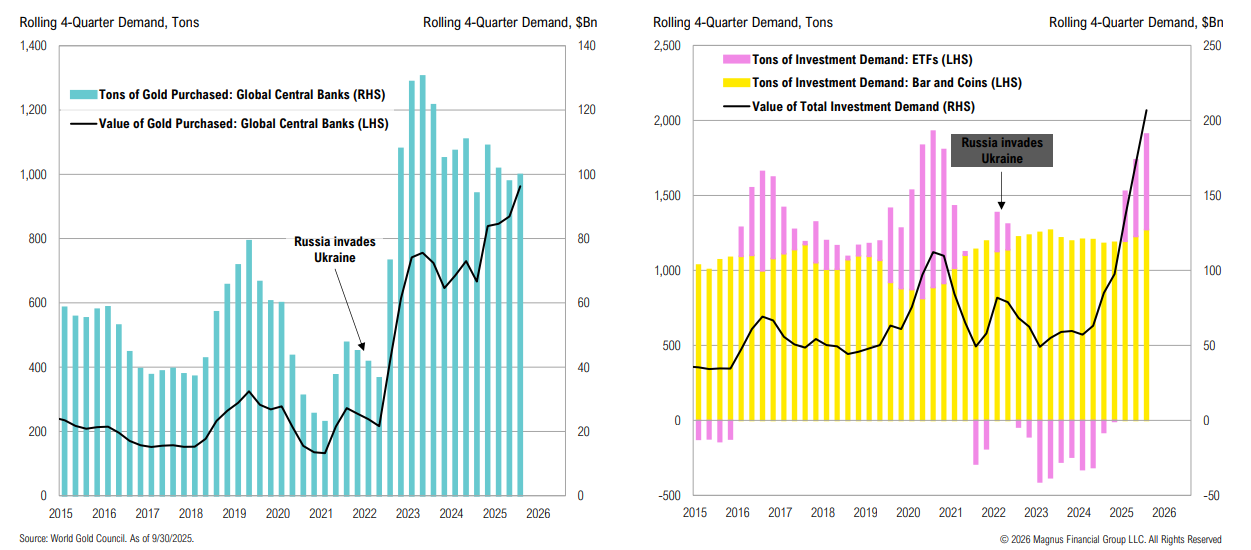
Central banks have been a key demand driver of gold since Russia invaded Ukraine, with little slowdown evident; ETF investment demand only began ramping in Q1’25 and remains well below prior peaks (in oz)
Stablecoins
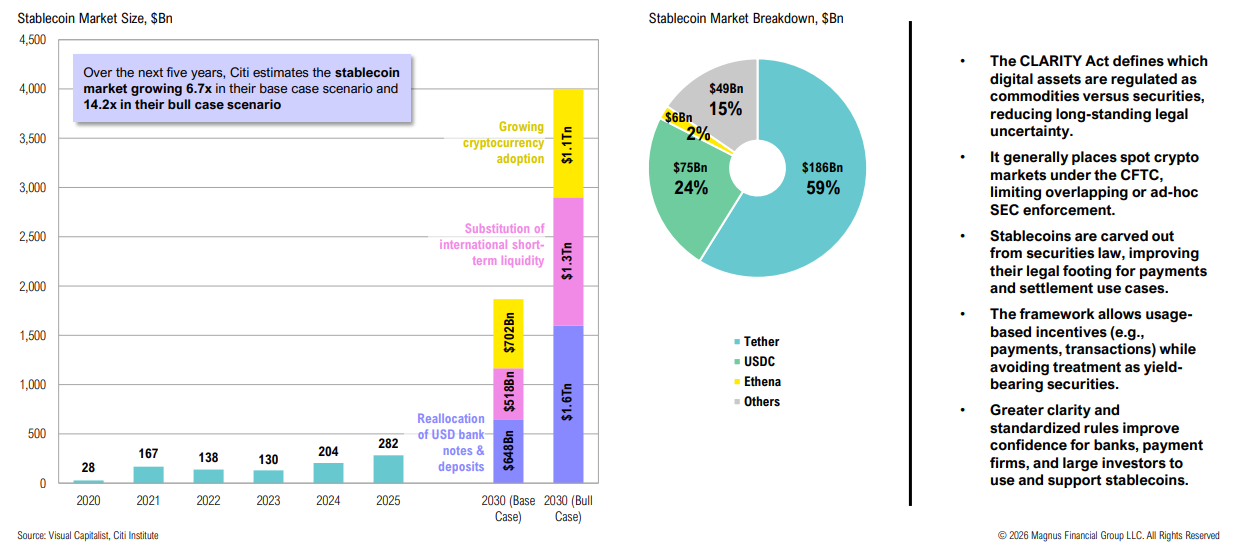
Stablecoins could benefit from growing crypto adoption and substitution of international short-term liquidity; a markup session for the CLARITY Act is set for early January
Cryptocurrencies
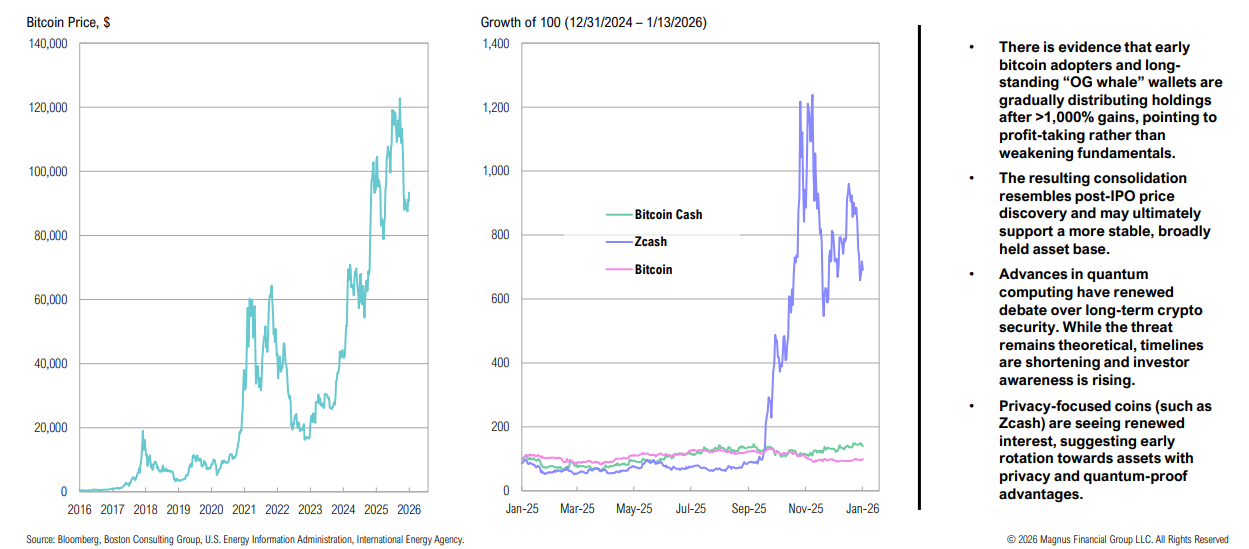
Is bitcoin having its ‘IPO’ moment or are privacy and theoretical quantum risks gaining relevance? Other coins (like Zcash) act as hedges against potential risks
CMEs
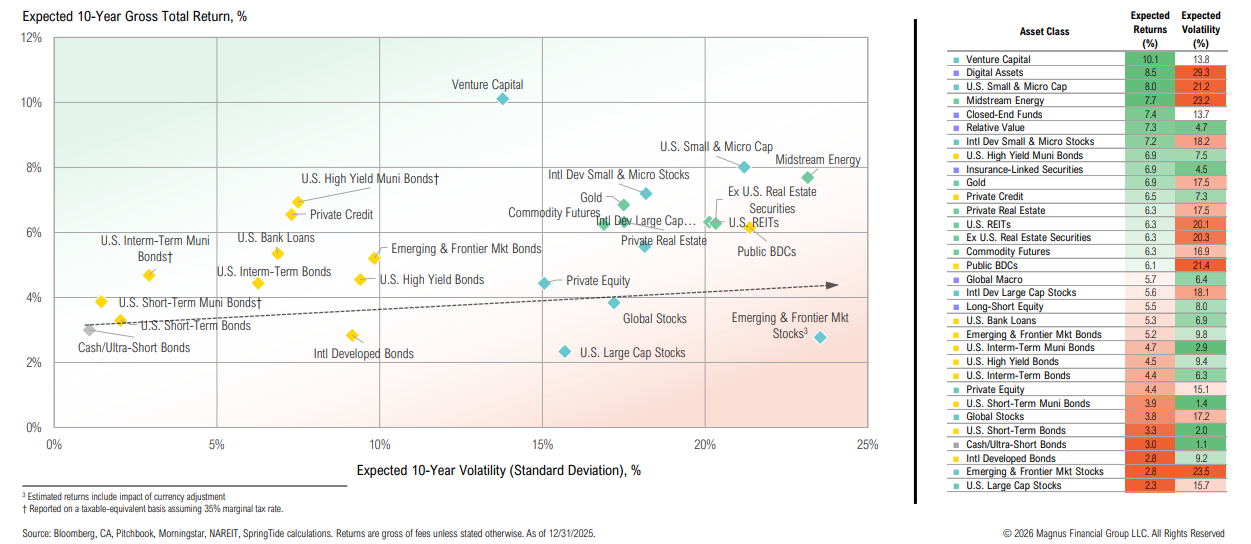
With global valuations broadly stretched across asset classes, longer-term return assumptions have declined