
Drained
There are two things which are extraordinary today, which may have different outcomes, and think of them as storm clouds. One is, the fiscal money being spent is so big, the largest in peacetime ever, with already very high deficits… [but] the biggest storm cloud is geopolitical.
Jamie Dimon, JPMorgan Chase CEO
Q3, 2023 Market Review
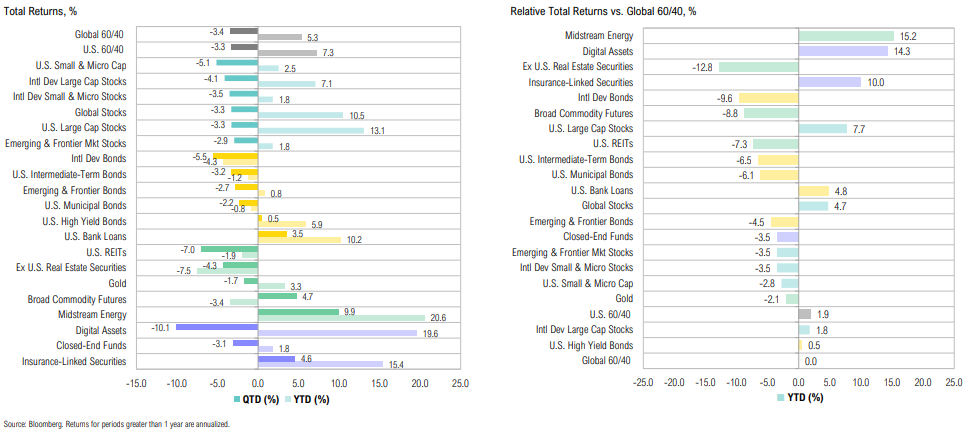
Major winners over the quarter included midstream energy and commodities; U.S. large cap stocks and intermediate-term bonds ended the quarter down 3.3% and 3.2%, respectively
Summary
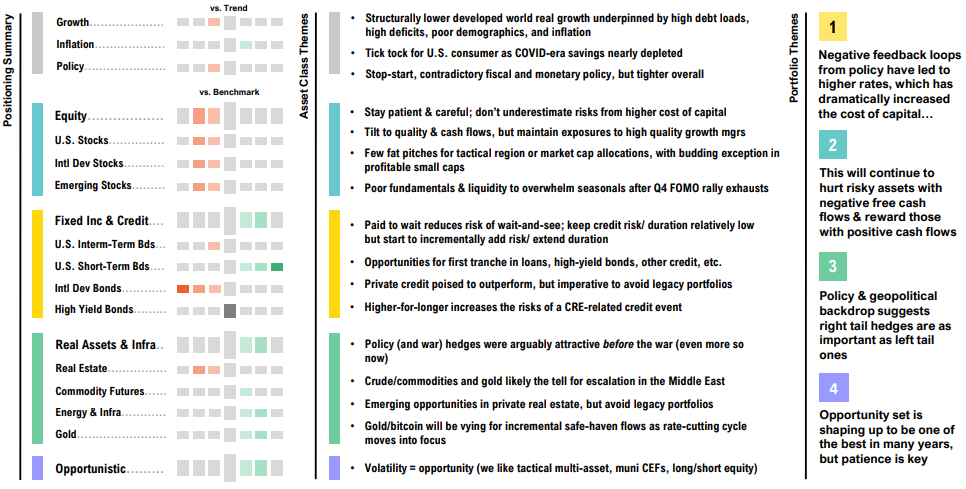
Asset Allocation Views
Our team predicts a soft landing, with a trough in the middle of next year. We see that in our customer data. Our 37 million checking customers’ spending is slowing down.
Brian Moynihan, Bank of America CEO
Growth, Inflation & Policy:
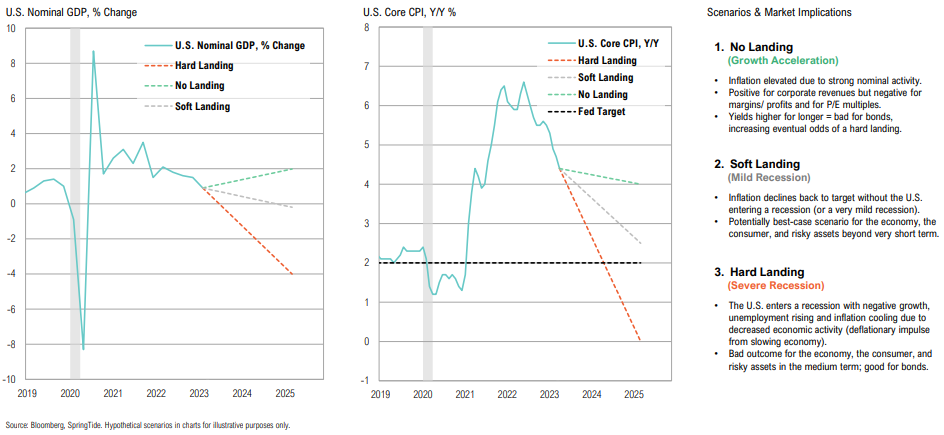
Scenario Analysis
While a ‘no-landing’ scenario seems bullish on the surface, it means yields will remain higher for longer & non-earners forced to roll debt into a hostile yield environment
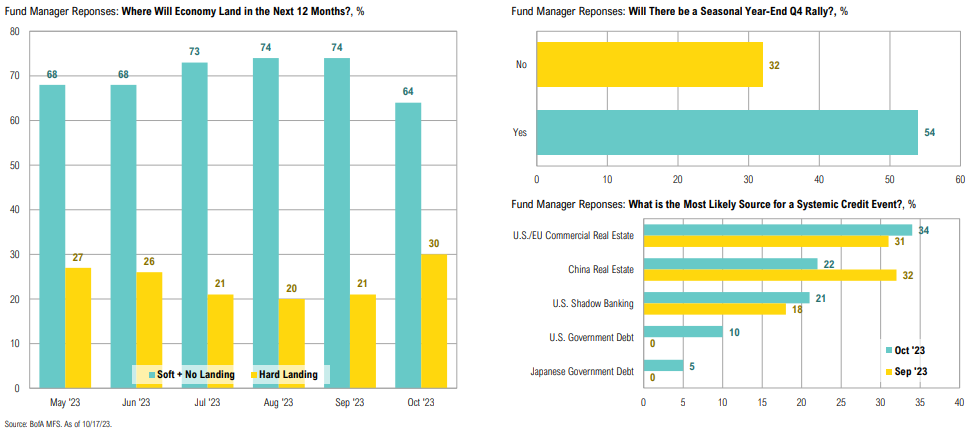
Consensus Positioning
Consensus is for a soft/no landing, a Q4 seasonals rally and a CRE credit event, if one occurs at all, implying limited upside if soft landing occurs and plenty of room for markets to be disappointed
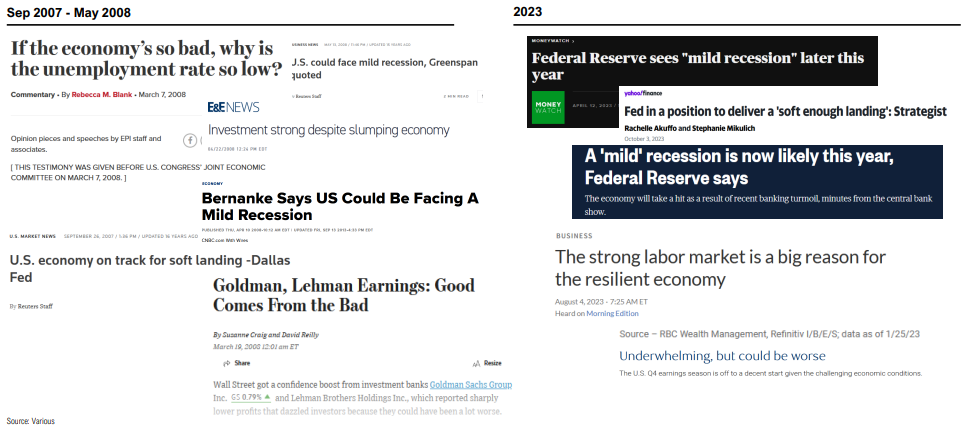
Consensus views are shaped by what has just occurred, not what may be coming (which is always unknown)
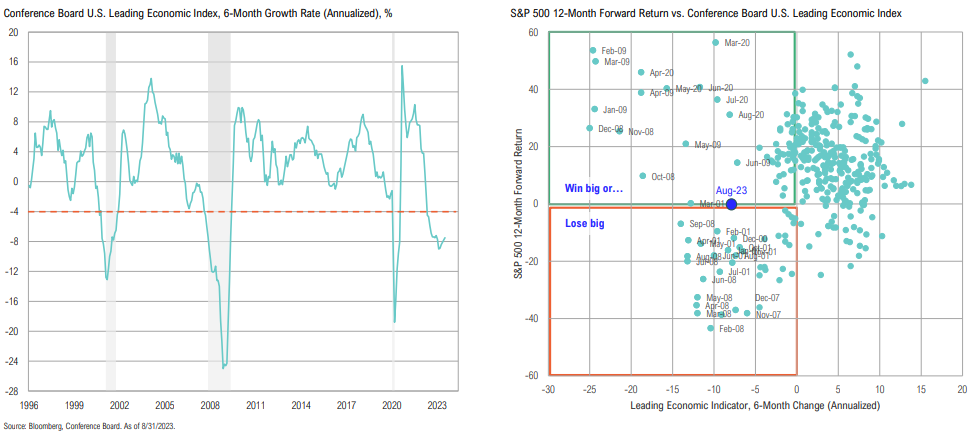
Leading Economic Index
The Conference Board LEI still signals “brief but mild recession” and weak future economic activity; S&P 500 returns when the LEI is at these levels tend to exhibit volatile win big/lose big dynamics
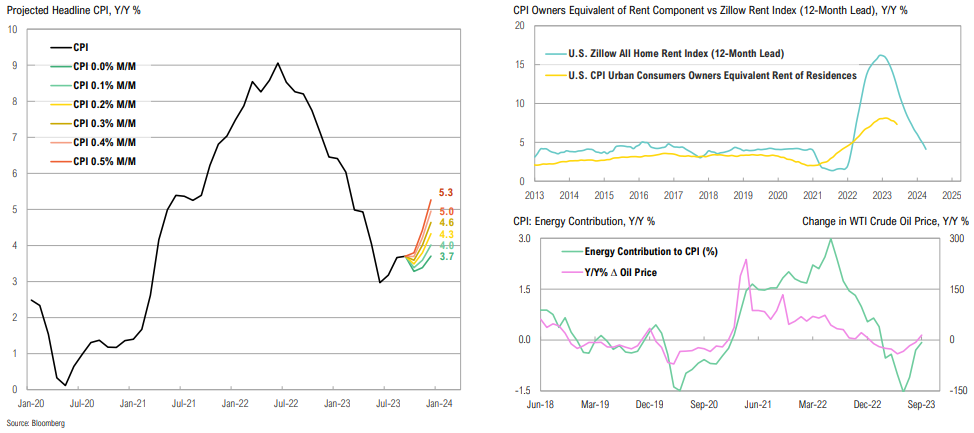
U.S. Inflation
Inflation encore: we may see further increases in headline CPI toward the end of 2023, likely even breaching 4.0% again; housing disinflation should start to flow through even as energy switches sides
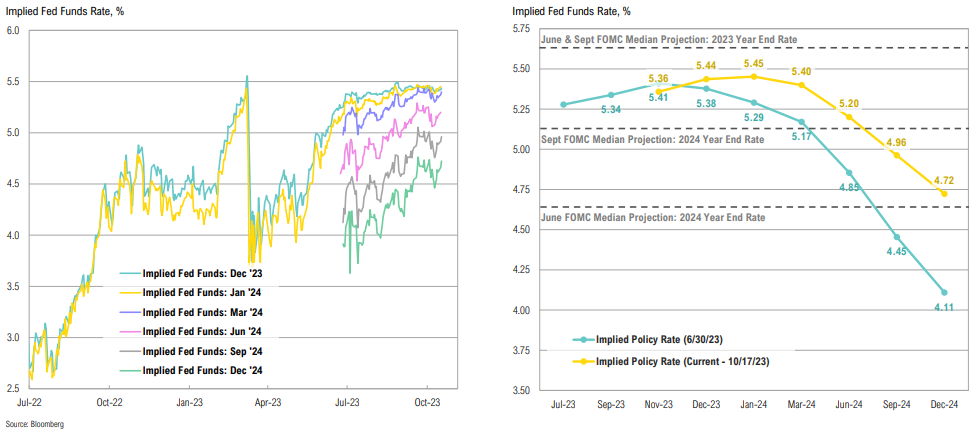
Implied Fed Funds
Implied Fed funds shifted higher following the September FOMC meeting as ‘higher-forlonger’ became entrenched; most Fed officials anticipate one more hike before year end
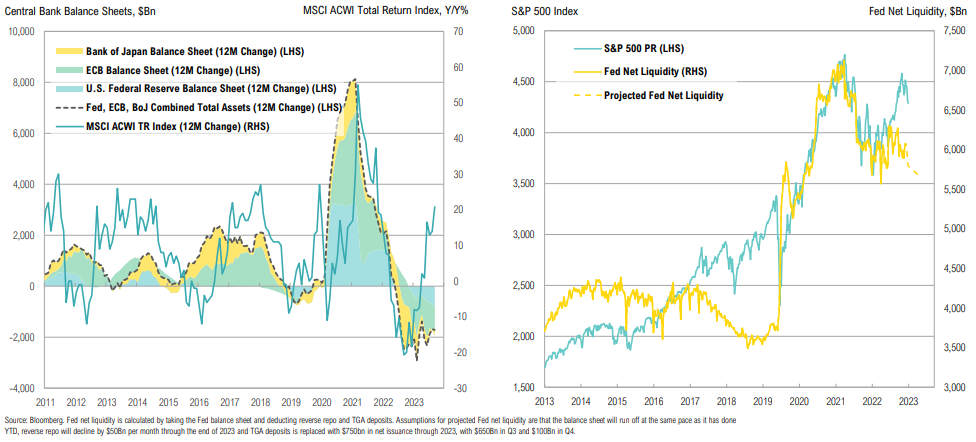
Central Bank Balance Sheets
There is an unusual divergence between central bank balance sheets and global stock performance; if the Fed continues with QT, liquidity should dry up throughout the rest of the year
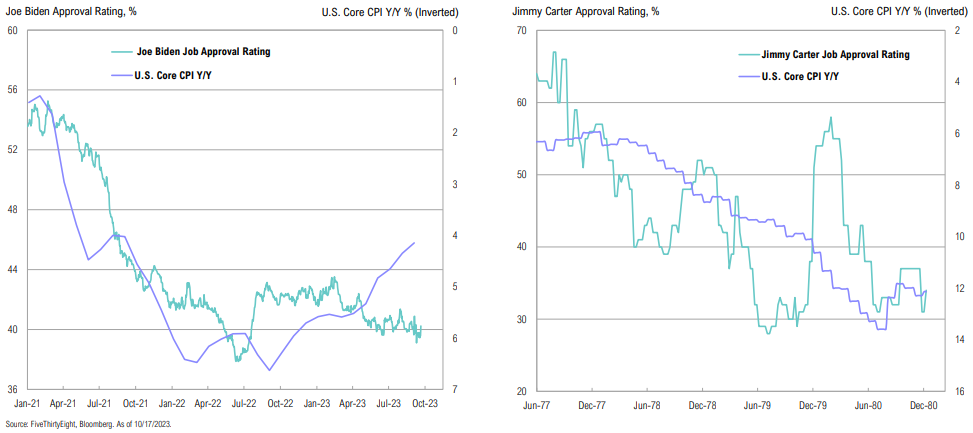
Election Trends
Biden’s approval rating has been linked to consumer inflation and gas prices; the current macro and economic backdrop has parallels to the Carter era
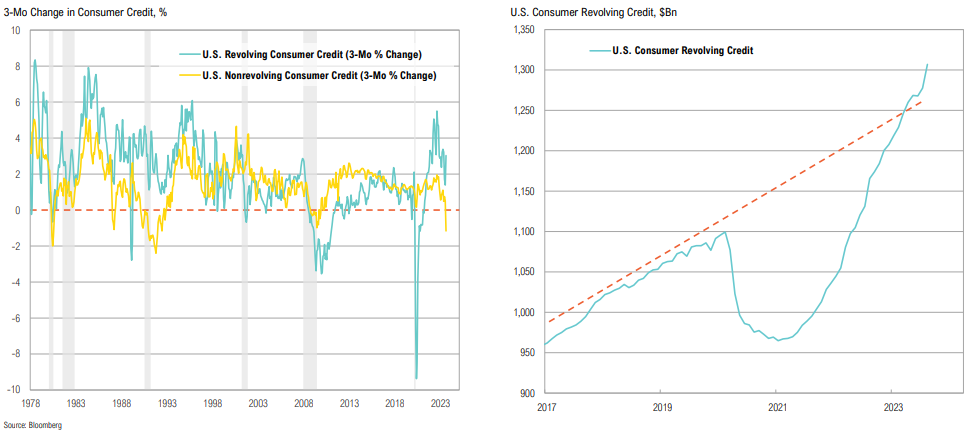
Consumer Credit
Nonrevolving consumer credit (including student loans, mortgages and other personal loans) is negative for the first time since the GFC; revolving credit continues to climb
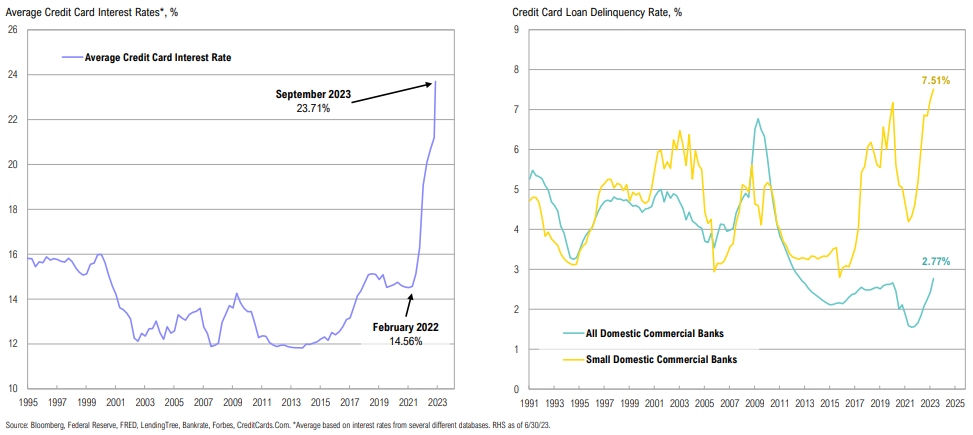
Credit Cards
Average credit card interest rates are at an all-time high and while credit card loan delinquency rates are low overall, they are at record-high levels for small banks (red flag)
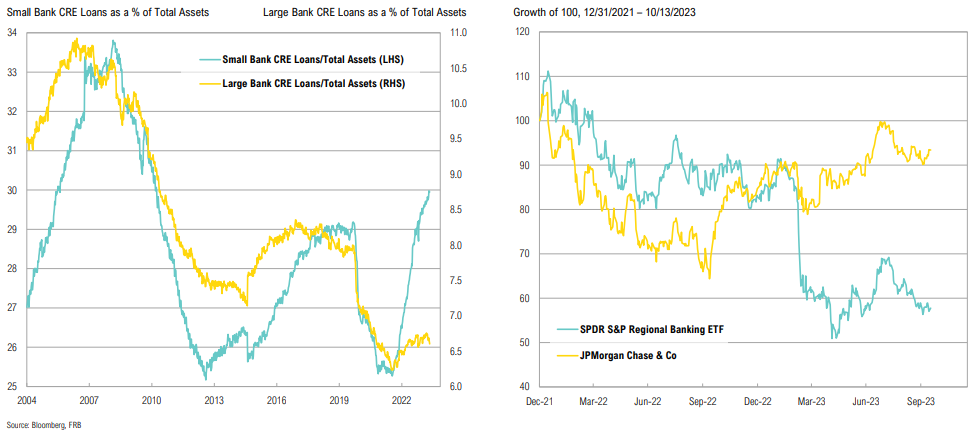
Small Banks
Another red flag for small banks: CRE loans account for 30% of small bank assets and only 6% of large bank assets; big bank performance since Jan 2022 emphasizes their strength
The inside of the stock market is the best economist I know.
Stanley Druckenmiller, American Investor
Equity:
Historical Fed
While a pause/rate cut could be on the horizon, history shows that the Fed cutting rates doesn’t stop the pain from prior hikes and their ‘long and variable’ lags
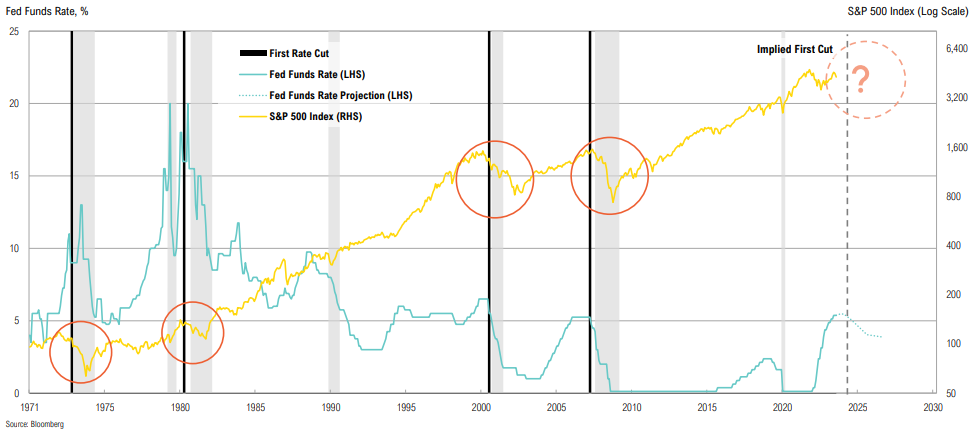
Win big or lose big: markets have had very different outcomes following the first rate cut; the historical probability of a decline is slightly higher than that of a rally
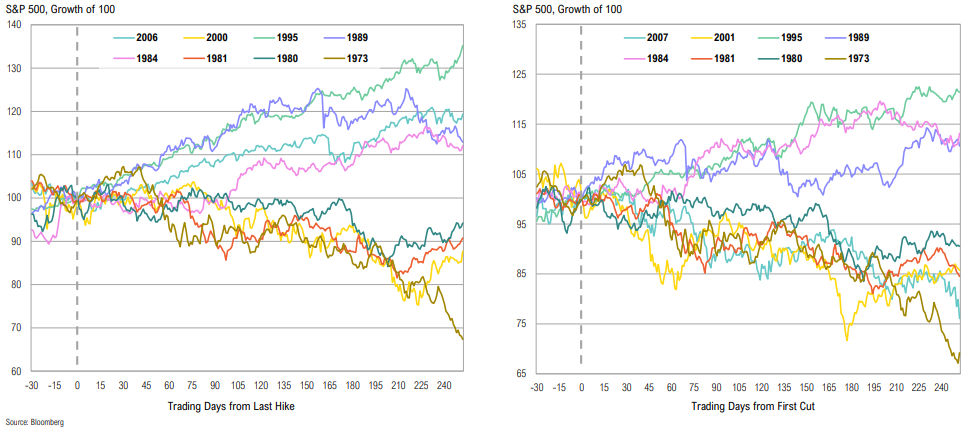
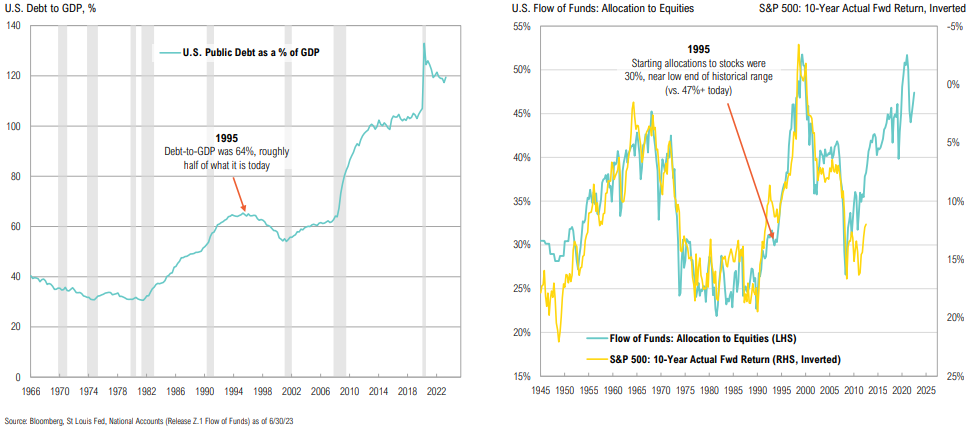
Historical Context
Are we underestimating a 1995-type outcome? We don’t think so.
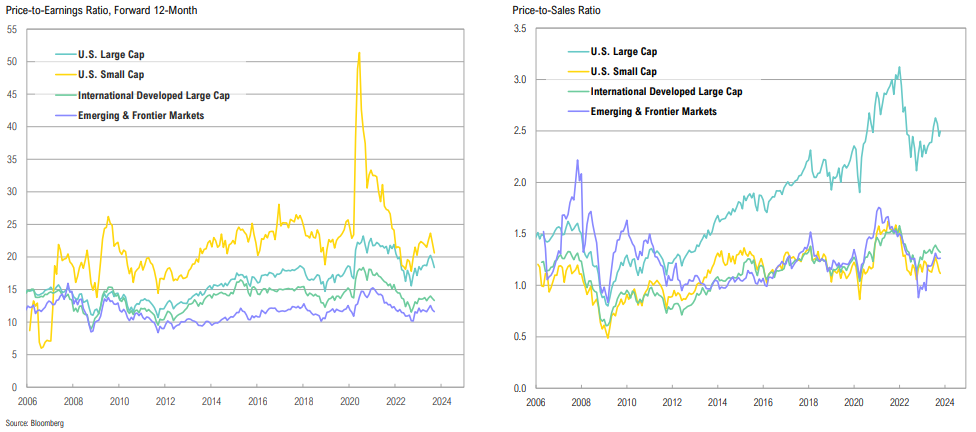
Market Valuations
Valuations ticked lower over the quarter; EM stocks remain relatively cheap vs. developed markets, but ‘value trap’ risk remains if recent growth optimism doesn’t materialize
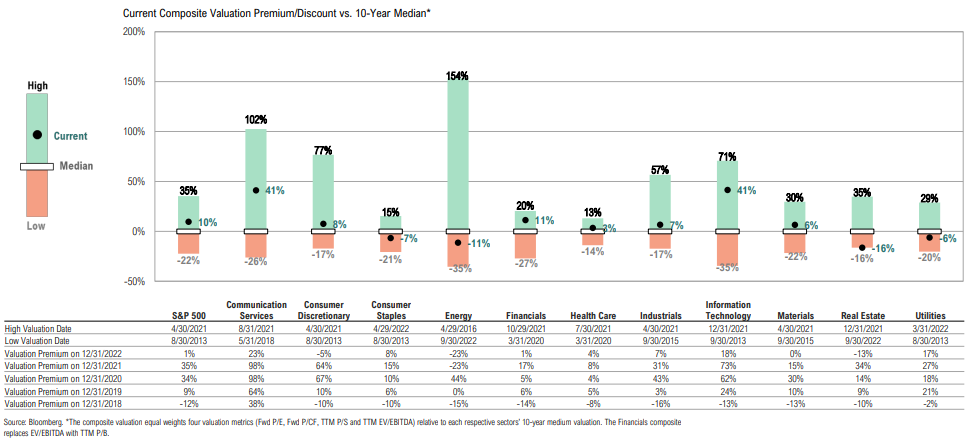
Valuations
Most S&P 500 sectors are trading at premiums to their median valuations with tech and comm. services looking stretched; energy and real estate offer value relative to their ranges
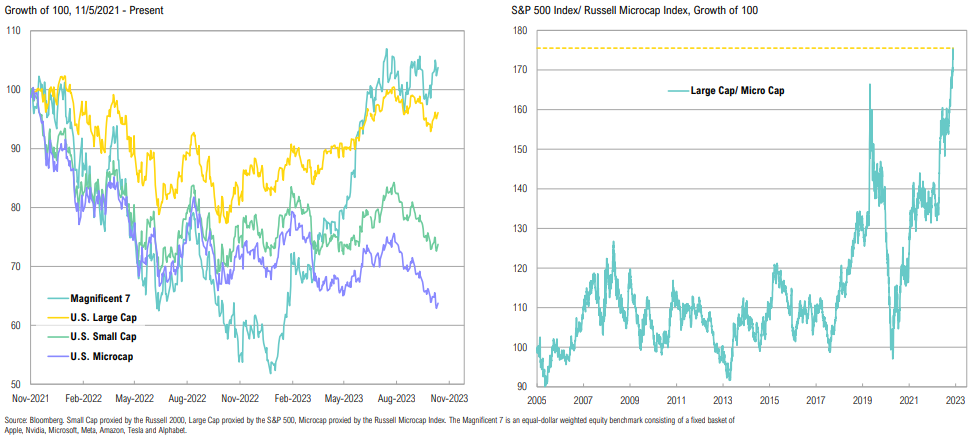
Small Cap vs Large Cap
There is a historic performance divergence between U.S. large cap and small cap stocks since Nov 5, 2021 (small cap peak); U.S. large caps have a lot going for them
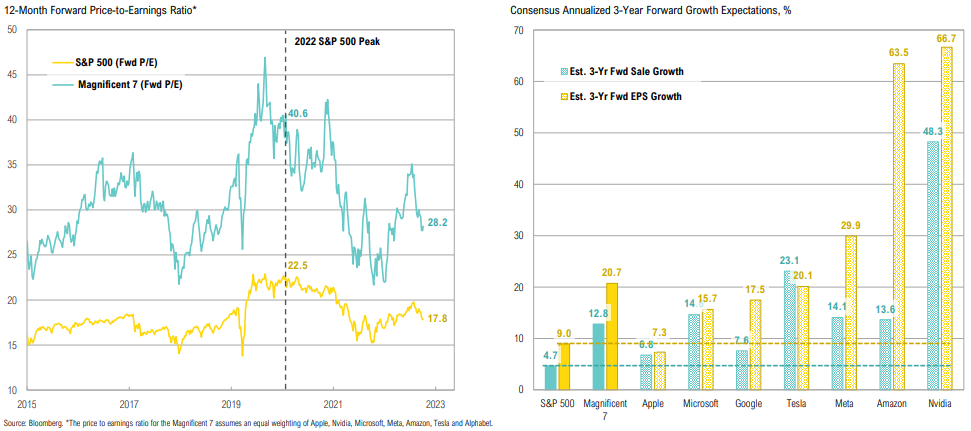
Magnificent 7 vs S&P 500
Despite market gains, Mag 7 forward valuations have dropped 30% since 2021 as EPS estimates have risen; Apple is currently trading at 30x earnings, despite single-digit growth expectations
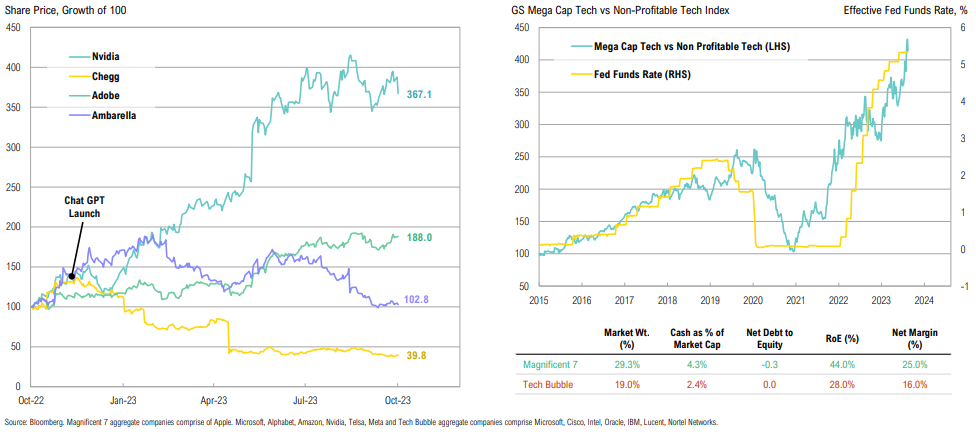
Generative AI
AI ‘winners’ and ‘losers’ are not always obvious; while we believe Mega Cap Tech is overvalued relative to rates, this is not a repeat of the Tech bubble
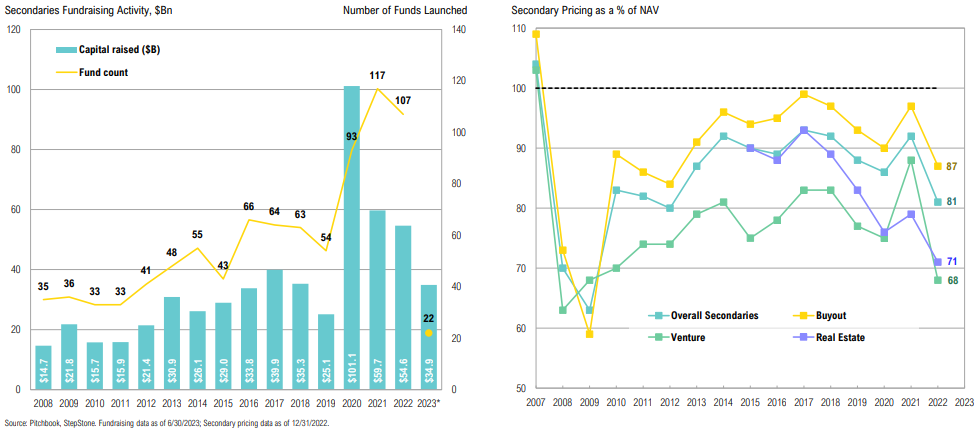
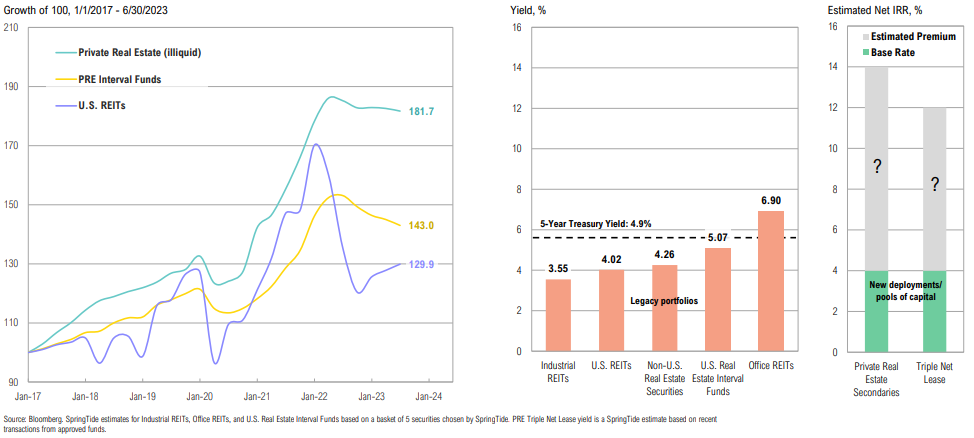
Secondaries Fundraising
After a record year in 2020, secondaries fundraising has fallen back to more typical levels
Largely thanks to highly accommodative monetary policy, we went through unusually easy times in a number of important regards over a prolonged period, but that time is over. I don’t think shortterm interest rates will be as low in the coming years as in the recent past. For this and other reasons, I believe the years ahead won’t be as easy.
Howard Marks, Co-Founder of Oaktree Capital Management
Fixed Income & Credit:
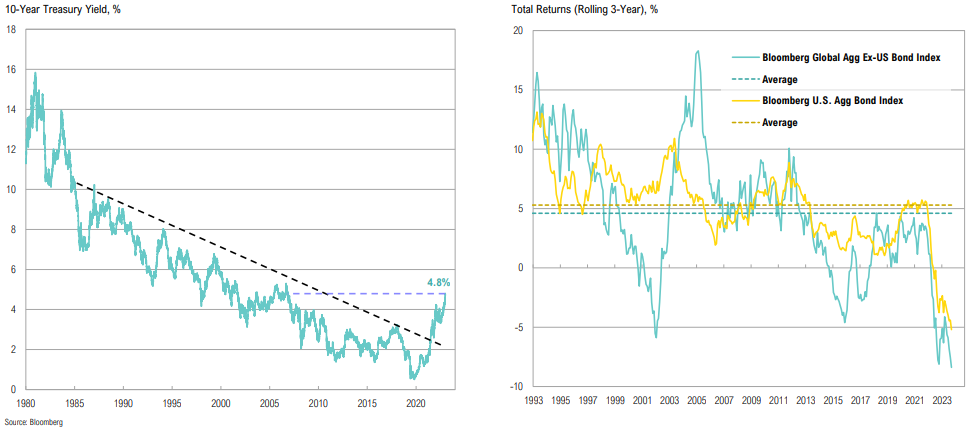
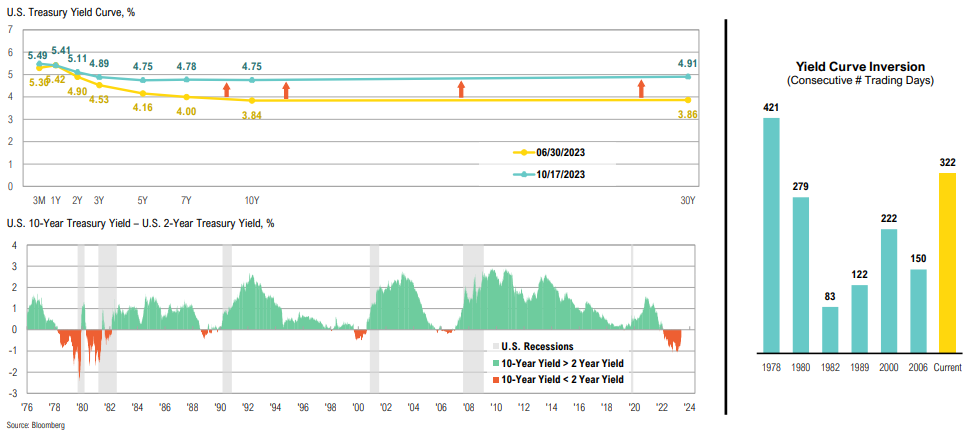
Treasury Market
‘Higher-for-longer’ pushed Treasury yields to levels last seen in 2007; we are in the midst of the worst Treasury bear market of all time, with bonds delivering the worst three-year returns in history
Yield Curve
If it takes a ‘bear steepener’ to dis-invert the yield curve, the odds that “this time is different” diminishes substantially
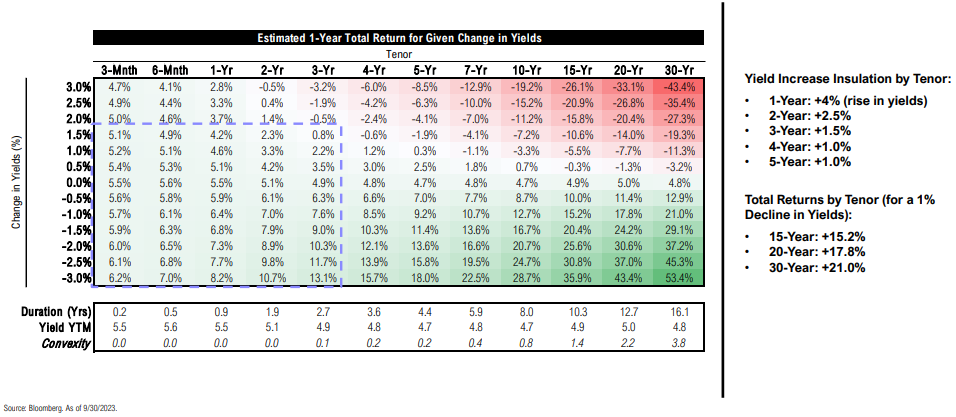
Treasury Payoff
There’s always opportunity: the 3–4-year part of yield curve has an attractive risk-reward profile—yields could move up 1.5% in the next year and total returns would still be positive
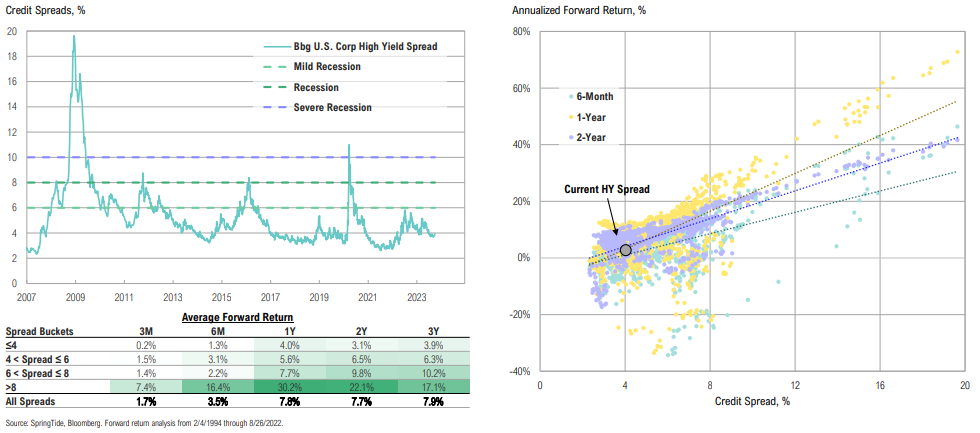
High-Yield Spreads
Tranching in high-yield bonds: some spread levels to consider are 6%, 8%, and 10%, with the goal to have each tranche be incrementally larger; current spread is 4.0% (HY spreads above 6% = above-average forward returns)
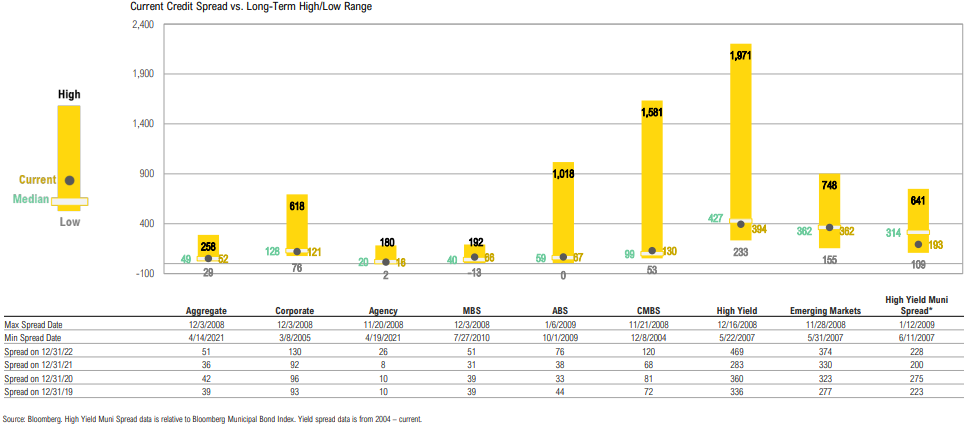
Spreads by Sector
Credit spreads are at or below median across most sectors; while a recession still seems probable based on LEIs & manufacturing data, HYB spreads at current levels don’t corroborate that view
Treasury Issuance
Q3 issuance was less than the anticipated $1tn, with Q4 issuance expected to be $852bn (and largest on record ex-2020) while the cost of outstanding debt continues to climb, now near 3%
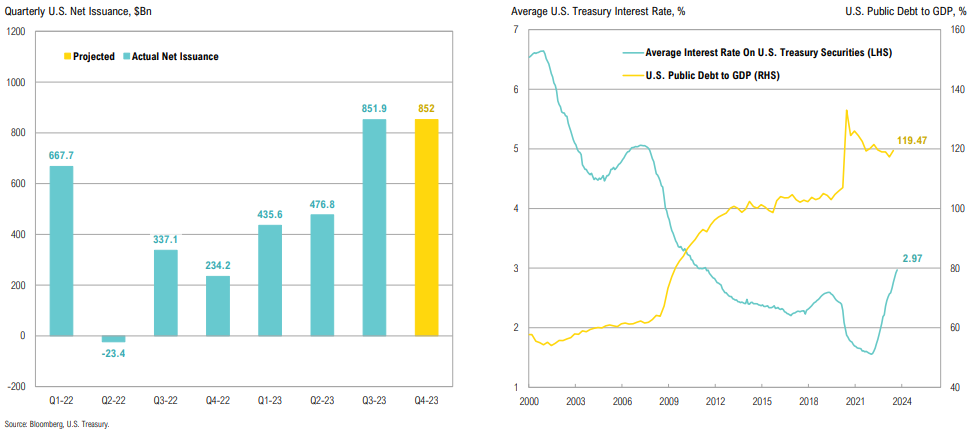
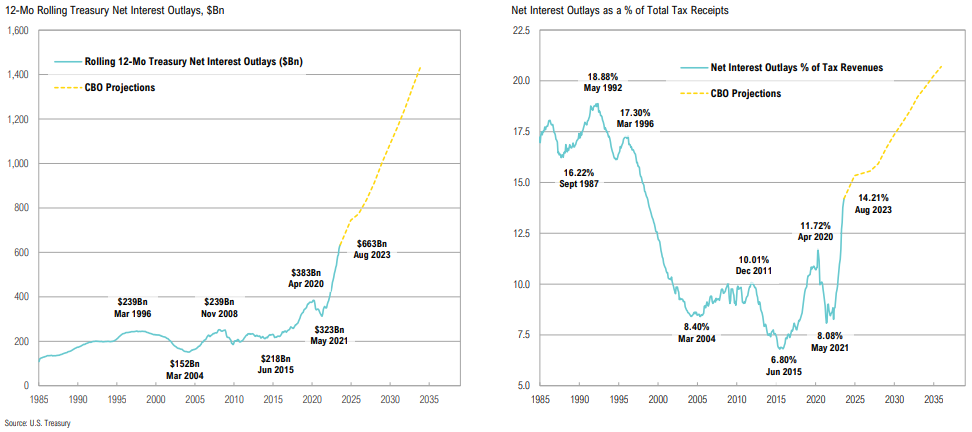
Treasury net interest outlays have climbed to $633bn, with debt outstanding increasing by $500bn over the past month; net interest outlays are expected to accelerate over the next decade
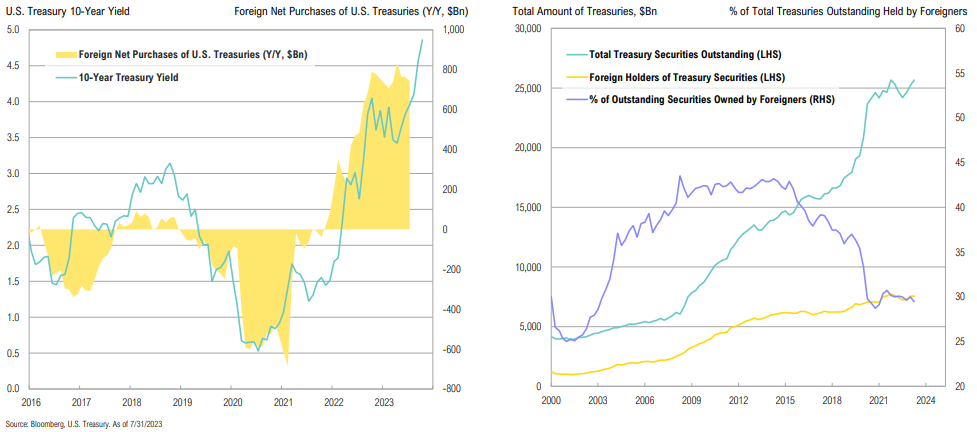
Foreign Holders
Foreign ownership of Treasuries has waned significantly since 2015 (while foreigners are still buying, they’re buying much less proportionally)
Nuclear adoption and acceptance are growing quickly in communities all over the world… And we’re already seeing movement from this, from conversations to commitments.
John L. Hopkins, NuScale Power Corporation CEO
Real Assets:
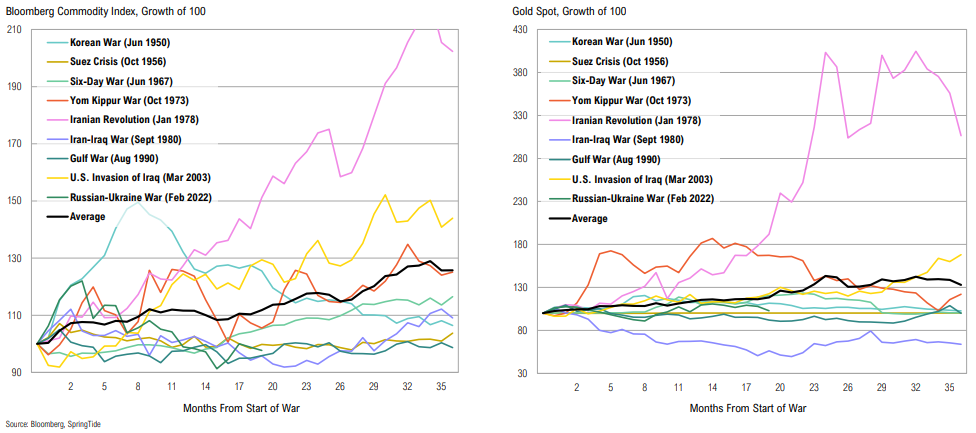
Geopolitical Risk
Heightened geopolitical risk from key global oil producers could increase volatility in the oil market; possible risk for global oil flows re Strait of Hormuz
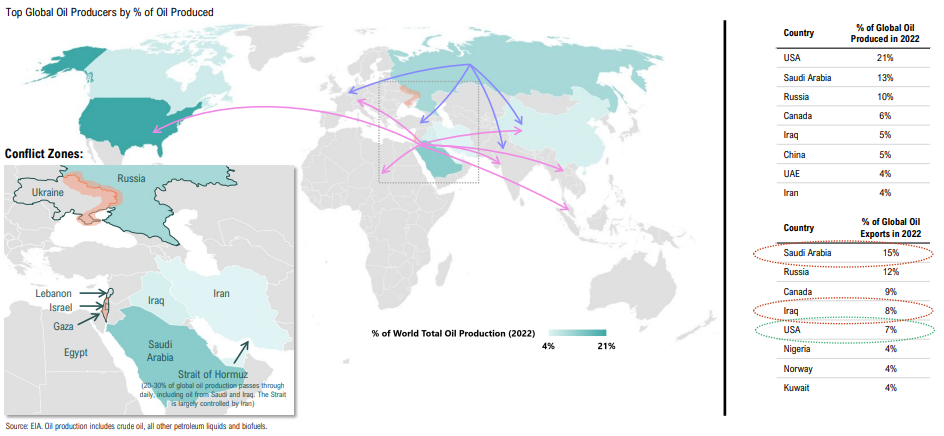
Commodities and gold tend to perform relatively well during wars and periods of general geopolitical stress
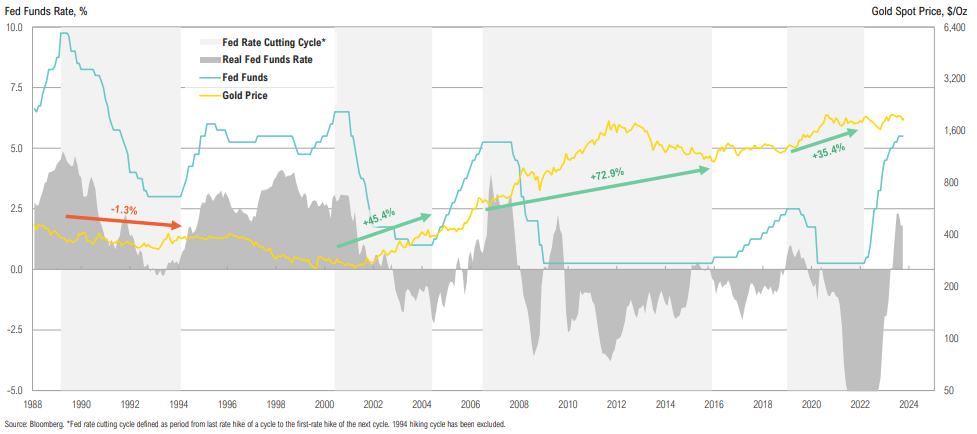
Gold vs. Fed Funds
The end of hiking cycles has tended to be positive for gold as the prospects of rate cuts reduce opportunity cost and the Fed tends to cut into a deteriorating deficit
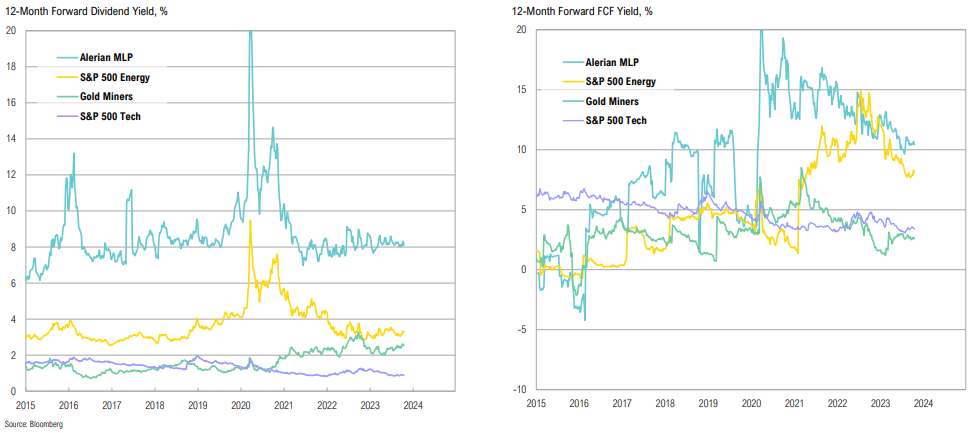
Yields
Midstream distribution yields trended lower as the sector broke out to upside but remains stabilized around an attractive 8%; free cash flow yields of the energy sector have declined
REITs
U.S. REITs have rallied 7.2% off 2022 lows, but still look wholly unattractive on a relative yield basis, despite looking more attractive on an absolute basis
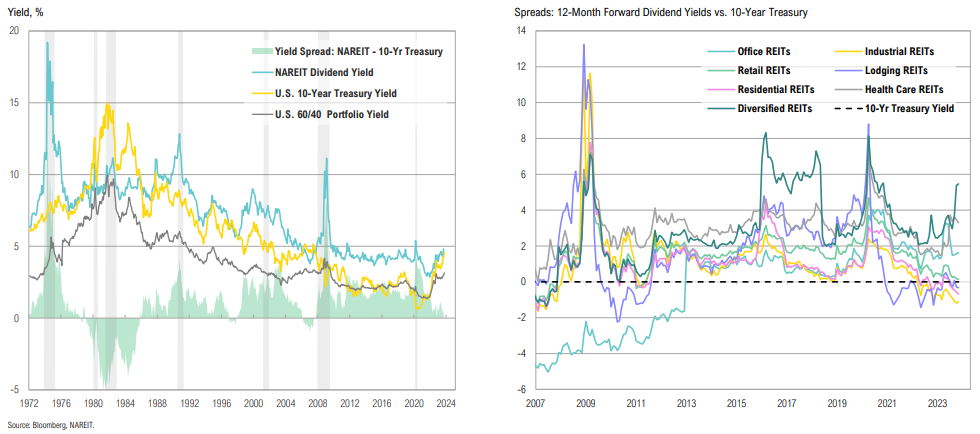
Real Estate Yields
Location, location, location! Location, sector, liquidity
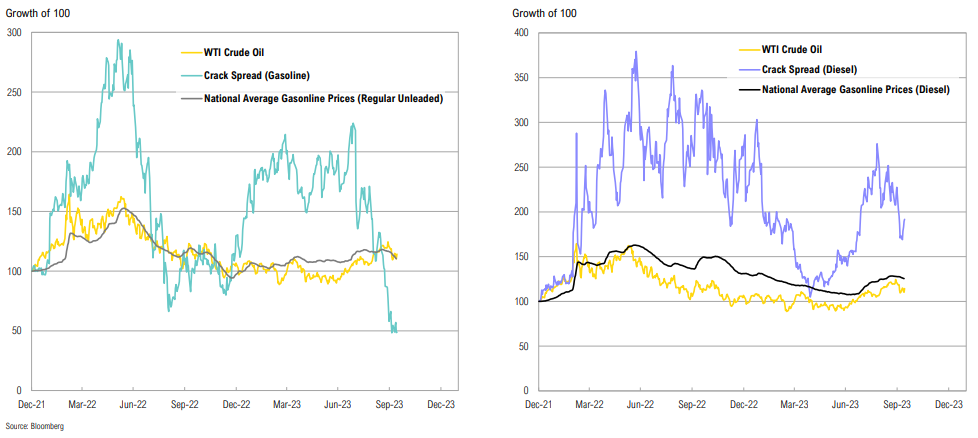
Gas Prices & Crack Spreads
Gasoline crack spreads are down to $9/barrel while diesel is still at ~$40/barrel; despite falling crack spreads in gasoline, inventories continue to build ( = lower prices at the pump)
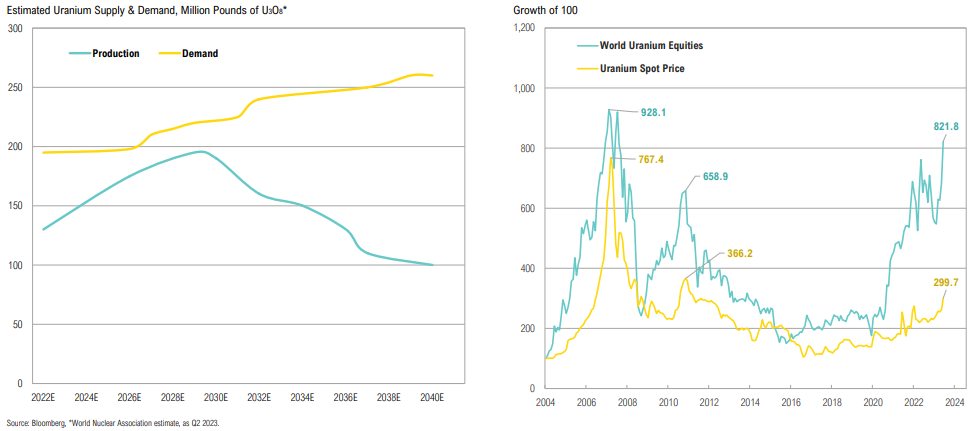
Uranium
Long term forecast point to uranium demand outpacing supply over the next two decades; uranium equities have outperformed during uranium bull markets
There are bulls and bears for every share at every price.
Nick Train, British Investor & Co-Founder of Lindsell Train
Opportunistic:
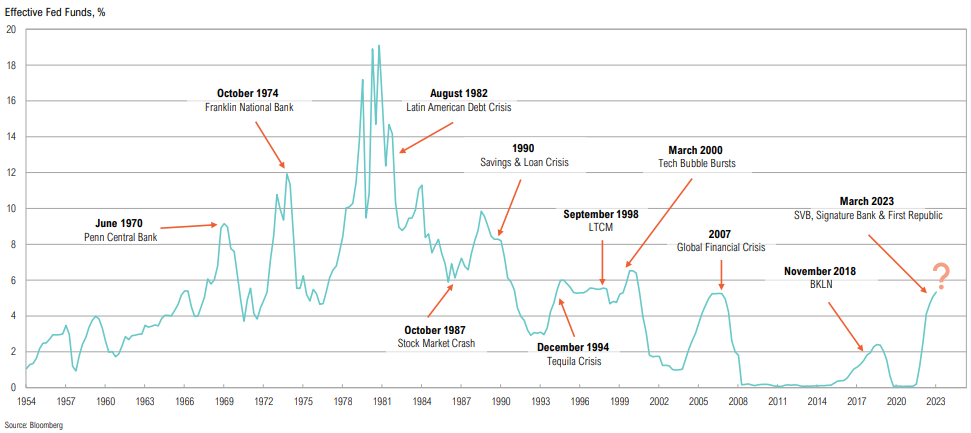
Rate Hike History
“Hike until something breaks” is typically how cycles play out
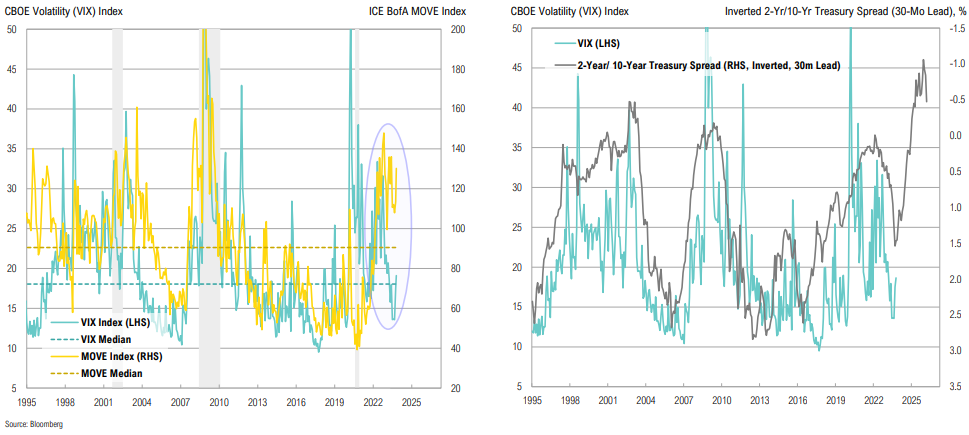
Yield Curve vs VIX
The implied bond market volatility (MOVE) isn’t showing the same level of composure as equities (VIX) and it’s unlikely that both markets are correct; 2s10s spread has historically lead equity volatility by 30 months
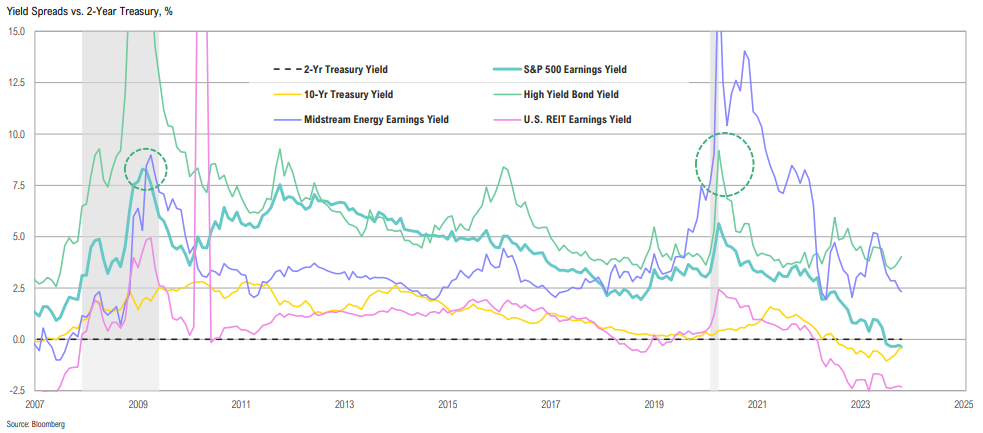
Yield Spreads
Most asset classes don’t look attractive relative to the 2-year Treasury yield; spreads have some way to go if past recessions are at all indicative
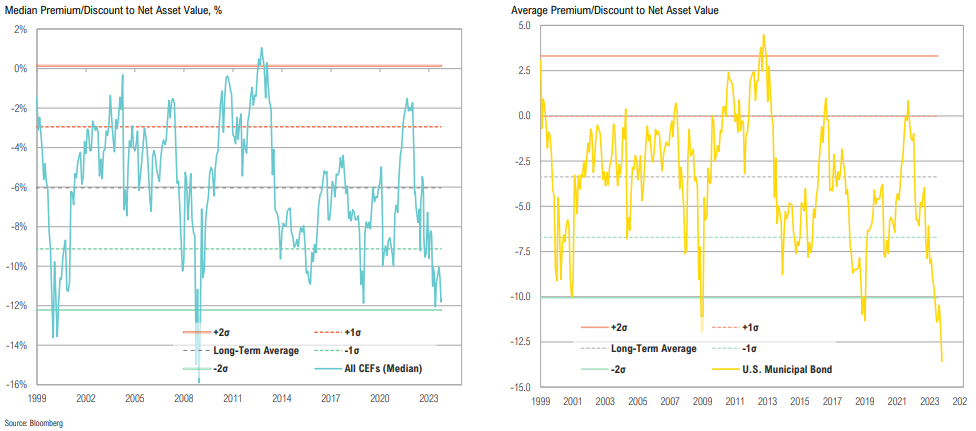
CEF Discounts
Median CEF discounts remain wide at -11.8%; U.S. Muni CEFs are trading at a 13% discount to NAV, the largest month-end discount since at least 1999…
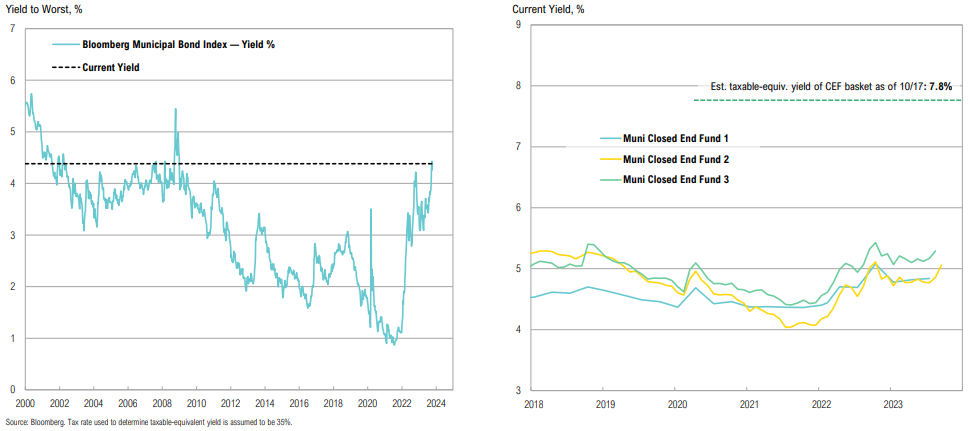
Muni CEF Yields
…However, while discounts are compelling, fund cash flows (and distribution yields) have been hurt by increased leverage costs and are not yet attractive
Inflation is a very serious subject. You can argue it’s the way democracies die. So, it’s a huge danger once you have a populace that learns it can vote itself money. It’s the biggest long-run danger we have, apart from nuclear war. Over the next hundred years, the currency is going to zero. That’s my working hypothesis.
Charlie Munger, American Investor & Vice Chairman of Berkshire Hathaway
Asset Allocation:
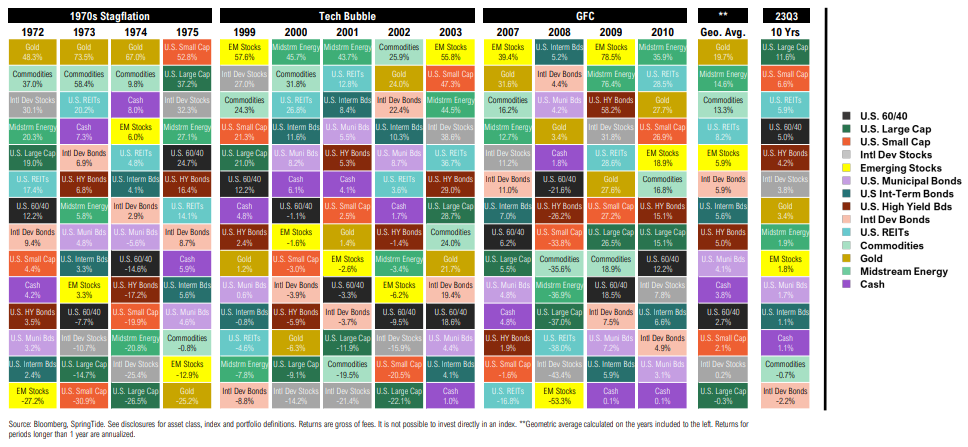
Analogies
Even if not base case, returns during periods of stress (stagflation, bubble unwinds, banking crisis) contrast so starkly with the last 10-14 years that they should be considered
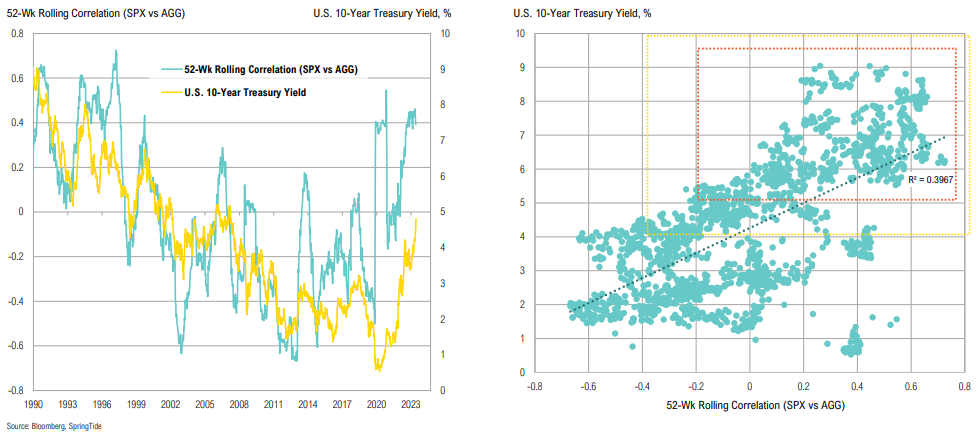
Treasury Market
With yields near the crucial 5% threshold, markets are at a key inflection point in terms of stock-bond correlations
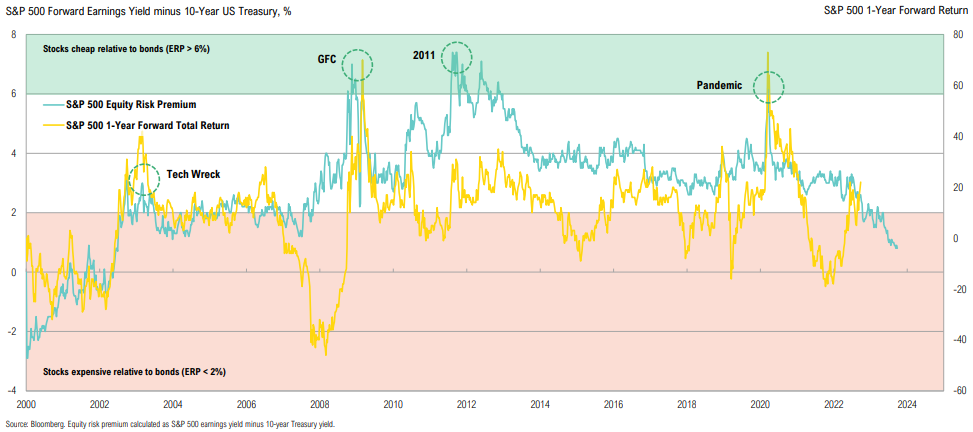
S&P 500 Equity Risk Premium
Using a simple yield-to-earnings-yield comparison (ERP), U.S. stocks are less attractively priced vis-à-vis bonds than at any point since the Tech Bubble and its subsequent unwind
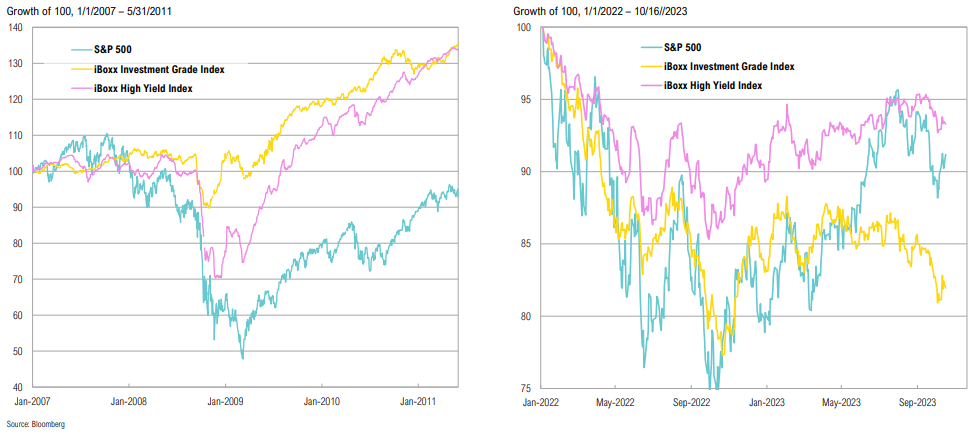
Credit vs. Equity
Can equities “wag the dog”? Credit tends to lead equities on the way out of bear markets; while there’s been a very constructive narrowing of IG and HY spreads recently, equities have decoupled
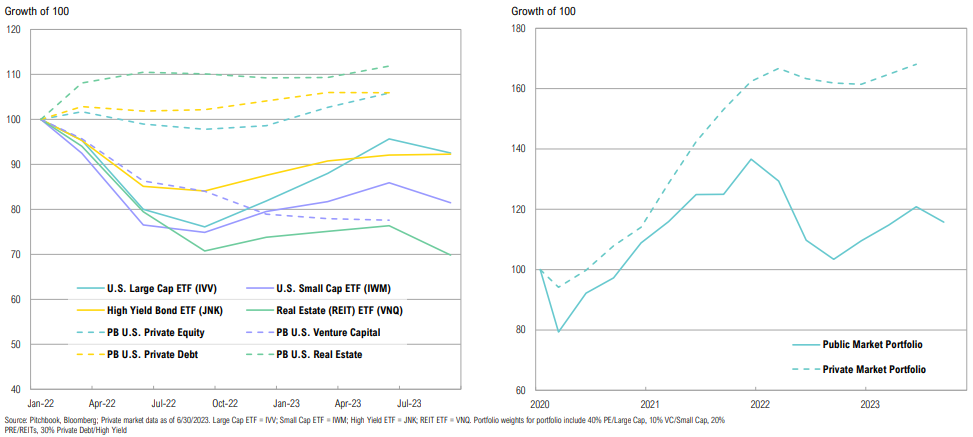
Private vs Public Market Returns
Private market funds have not marked down portfolios to account for higher rates
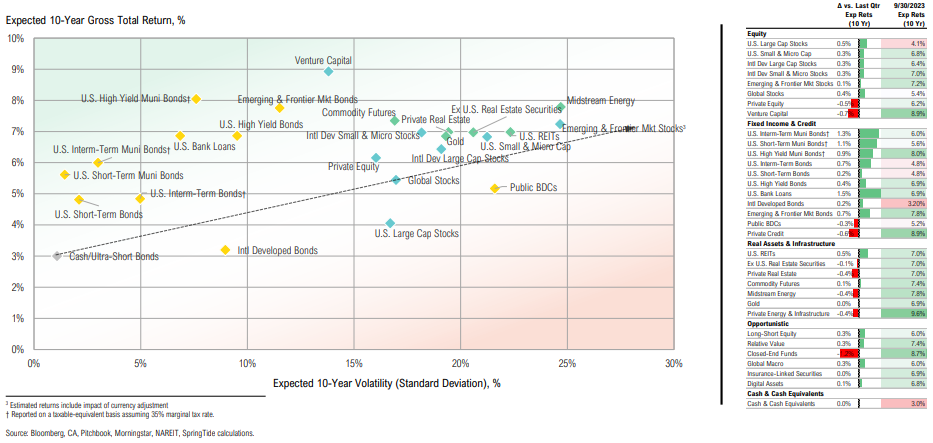
CMEs (As of 9/30/2023)
Expected 10-year returns for bonds rose with yields; municipal bonds stand out on an after-tax risk-adjusted basis
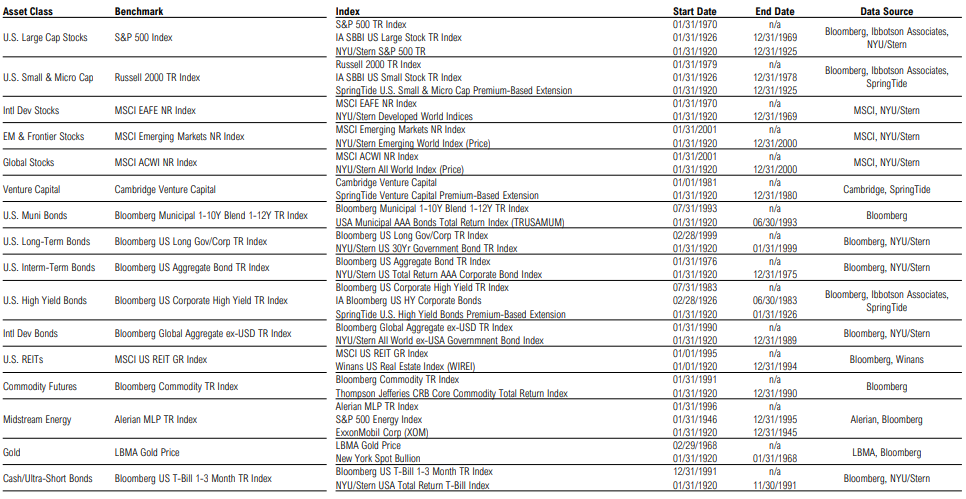
Appendix:
Asset Class Definitions