When inflation is low, you feel that you know more about the future, and are much more willing to take risks.
– Peter Bernstein, Economist & Author of Against The Gods

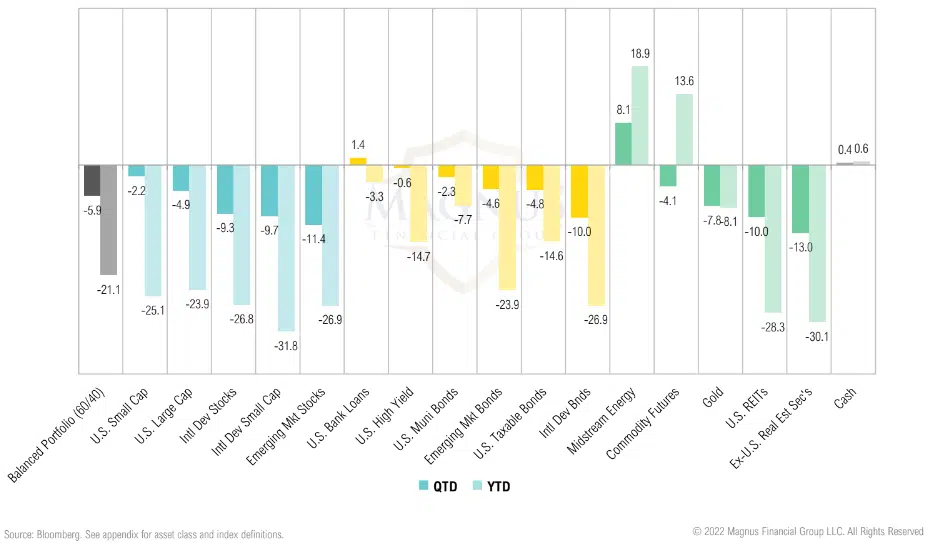
The third quarter was unusually challenging for U.S. investors as both U.S. large cap stocks (-4.9%) and bonds (-4.8%) declined together
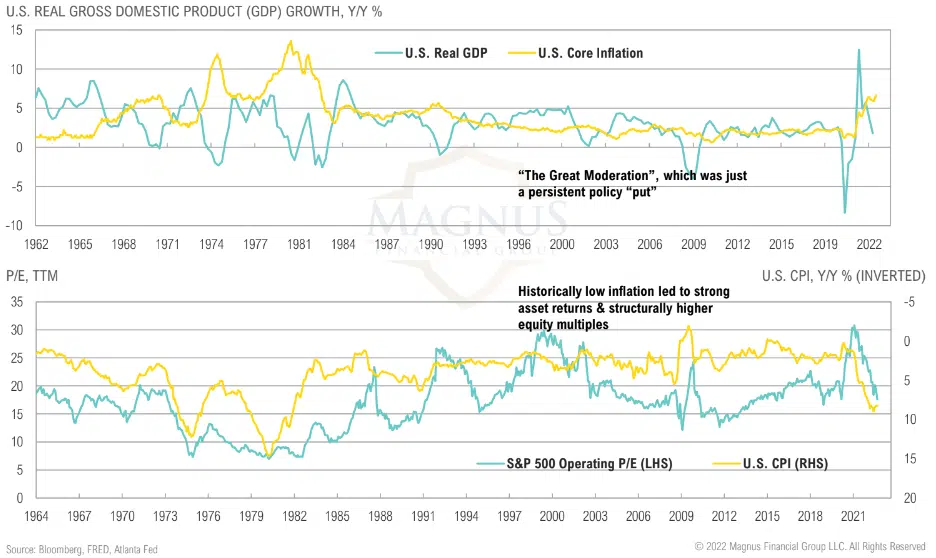
With the benefit of hindsight, the “great moderation” was just a persistent policy put resulting from historically low inflation
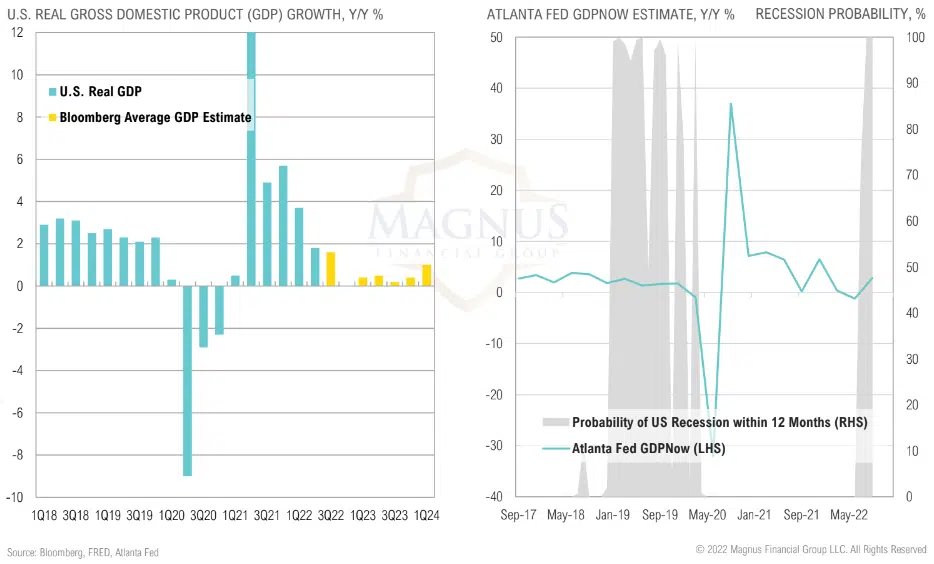
Most economic models suggest the potential for recession next year is high, arguably assured
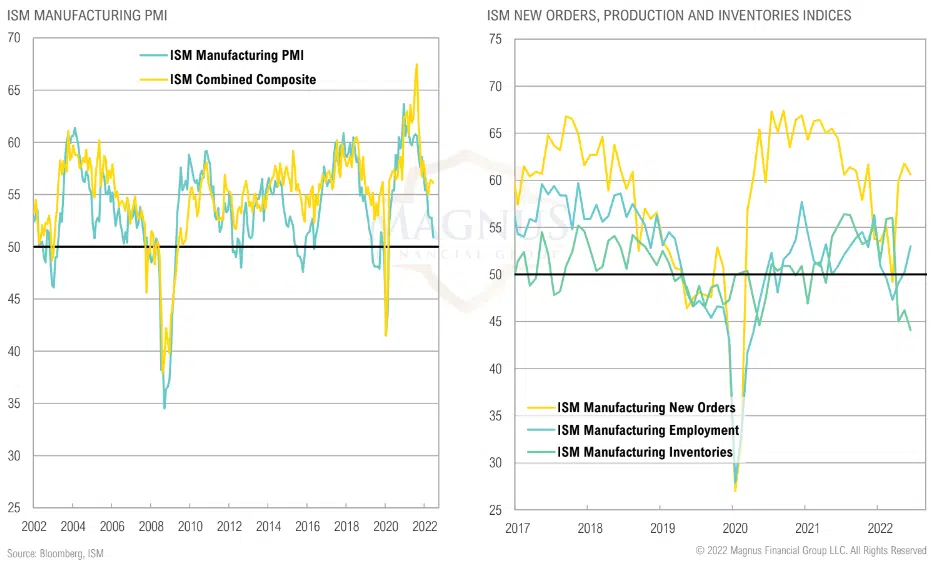
ISM Manufacturing PMI has rolled over; retailers have seen a dramatic increase in inventories; employment expanding in both sectors
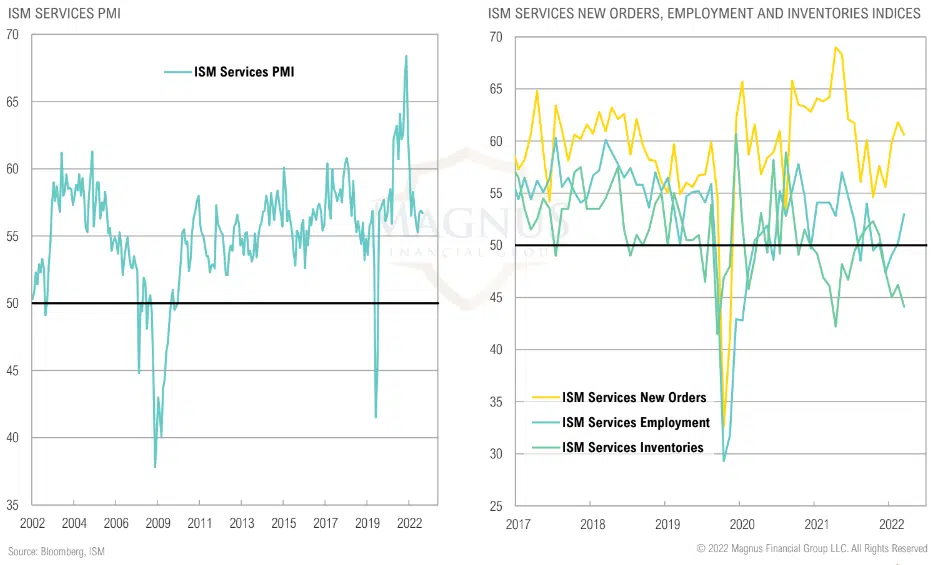
ISM services has also rolled over but in much healthier shape as consumer spending shifts from goods to services; employment expanding in both sectors
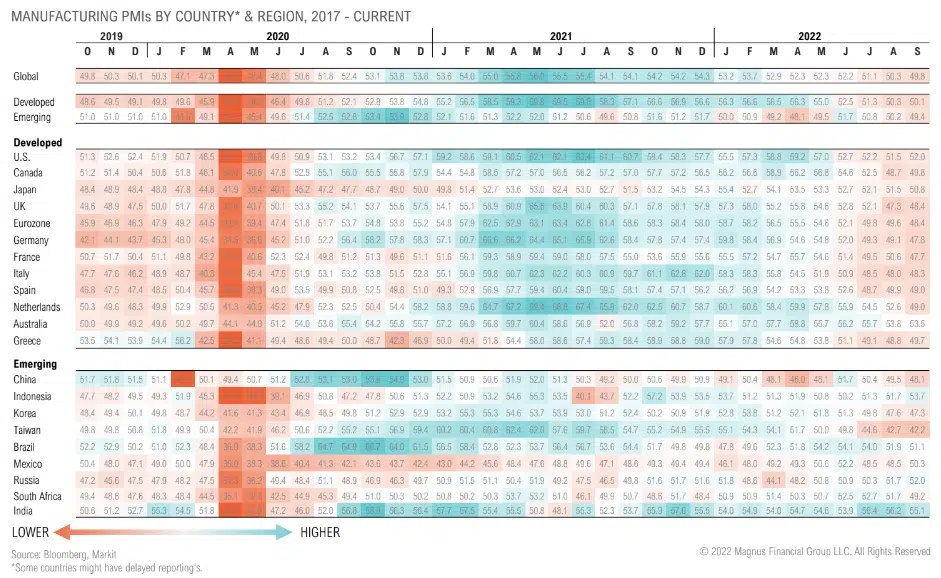
Global manufacturing activity dropped in September as emerging market activity contracted while developed market activity stalled further
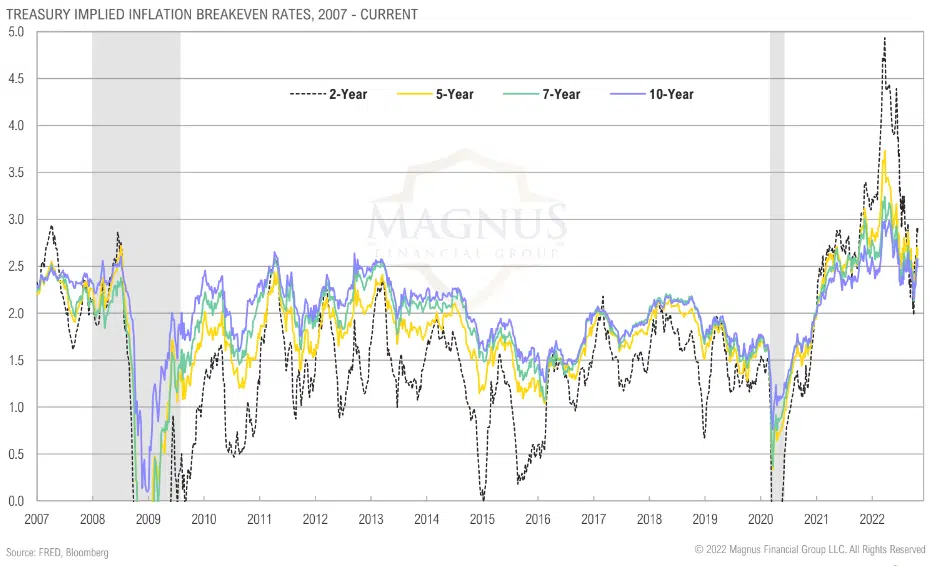
Intermediate-term inflation expectations have eased after breaking out to multi-decade highs, but they remain tethered to rallies in risky assets, frustrating the Fed
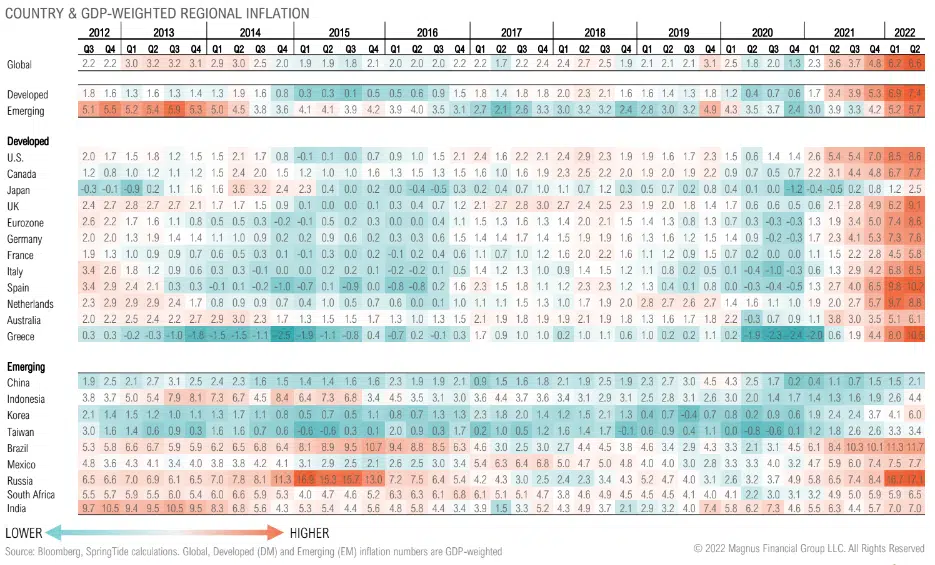
Pre-Russian invasion, global inflation was already at a decade-high due to lack of investment in commodity supply, labor tightness, rising housing prices, supply chain bottlenecks, etc.
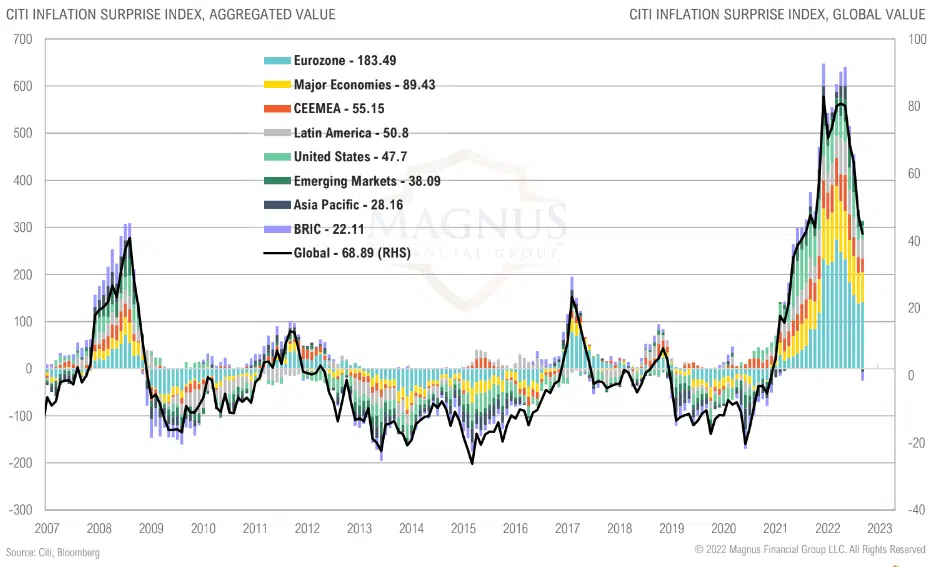
Inflation Surprise Index has rolled over, but from an extreme level; still surprising forecasts on a global scale, a first since 2008
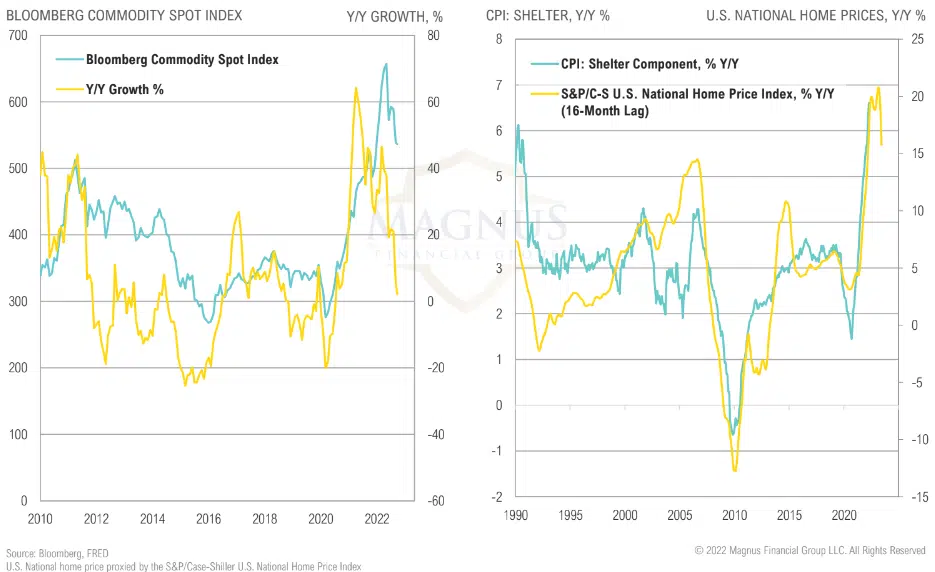
While commodity prices rolling over will help contain inflation, house prices impact the shelter component of CPI with a 12 to 18-month lag
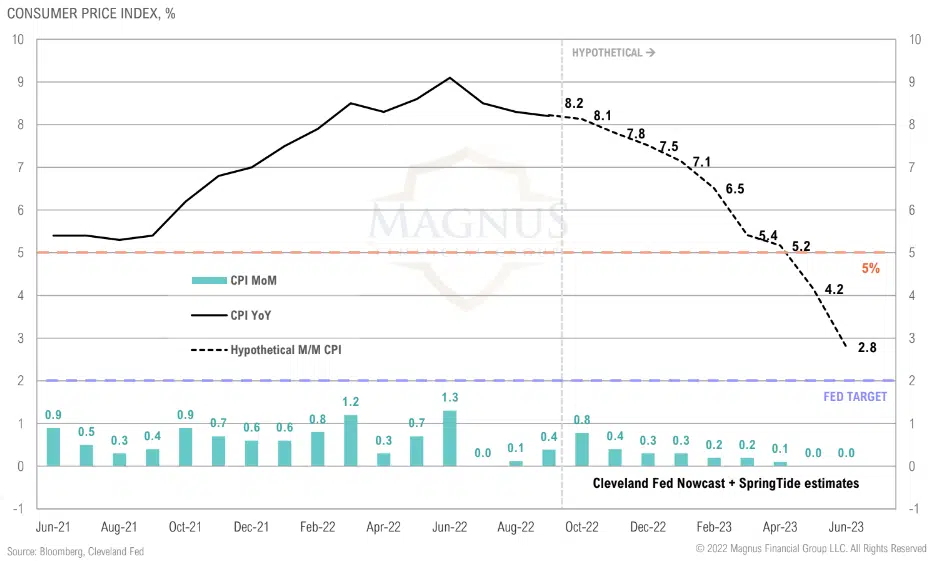
It is likely that YoY CPI will remain above 5% through Q1 of 2023
Yield curve moved higher after the last two CPI prints as market continued to underestimate the stickiness of inflation
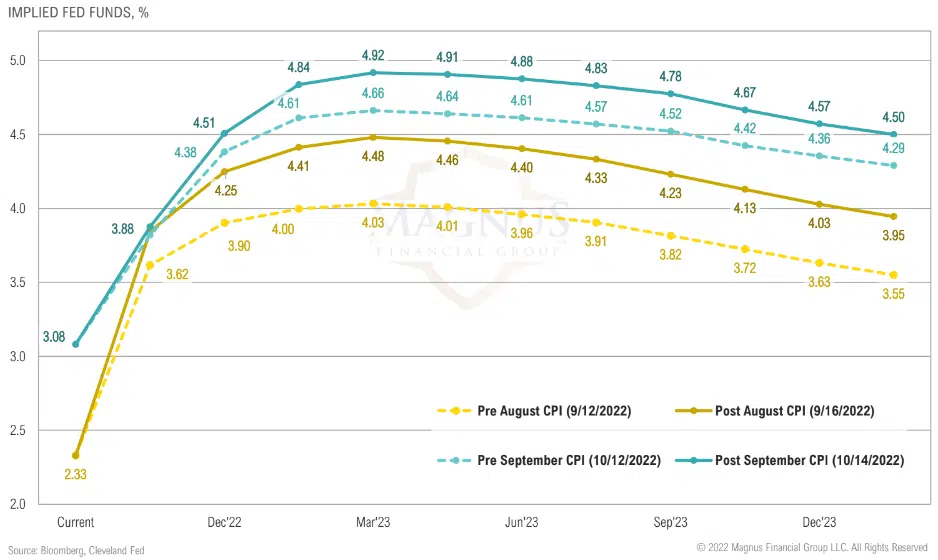
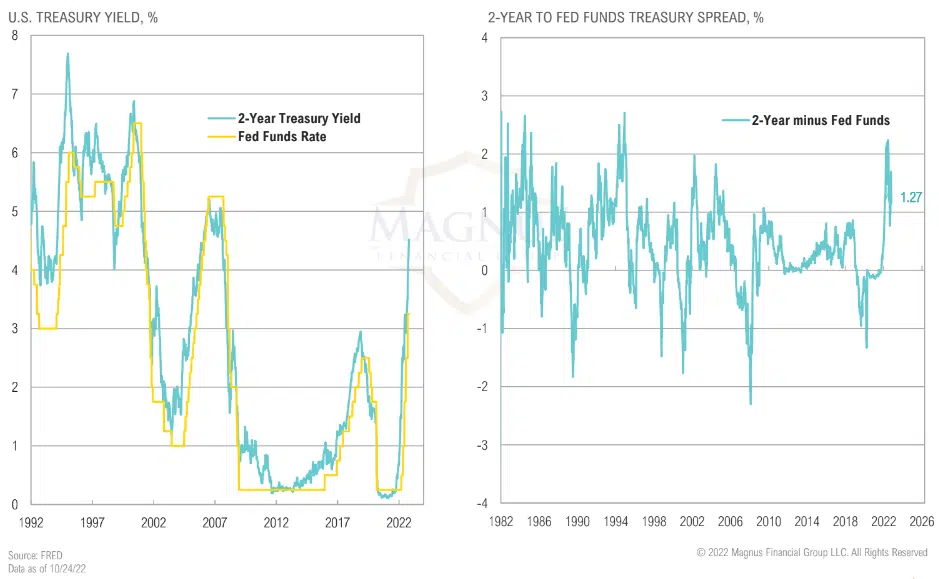
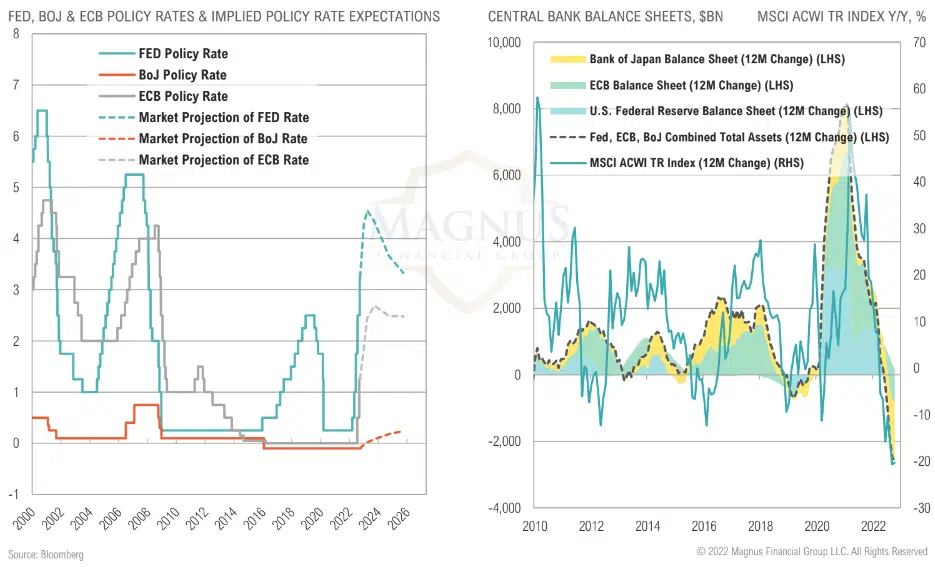
Fed funds rate is catching up with the 2-year yield as market thinks it has dialed in on an expected terminal Fed funds at around 5.0% within next couple of meetings
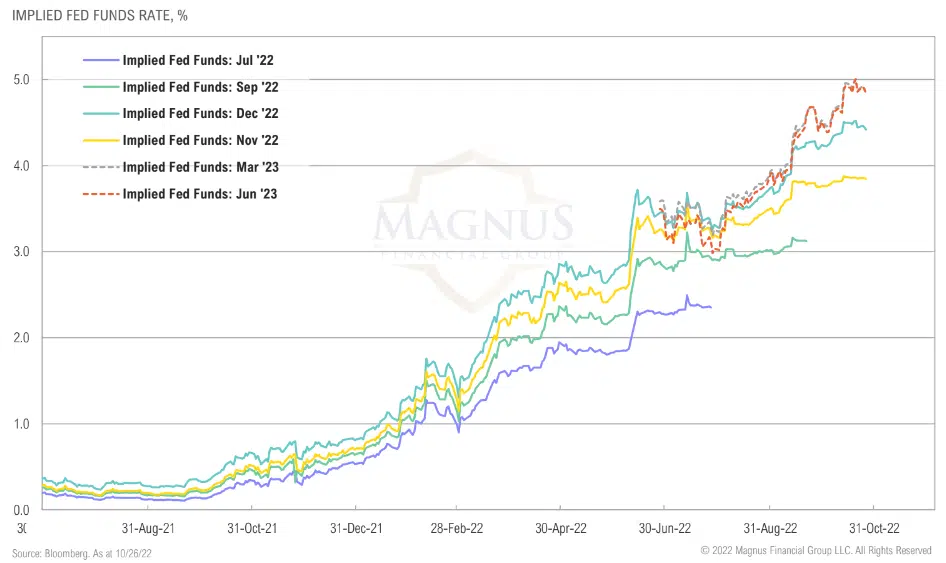
Fed funds futures expecting peak rates in March 2023 and the Fed to start cutting rates later next year
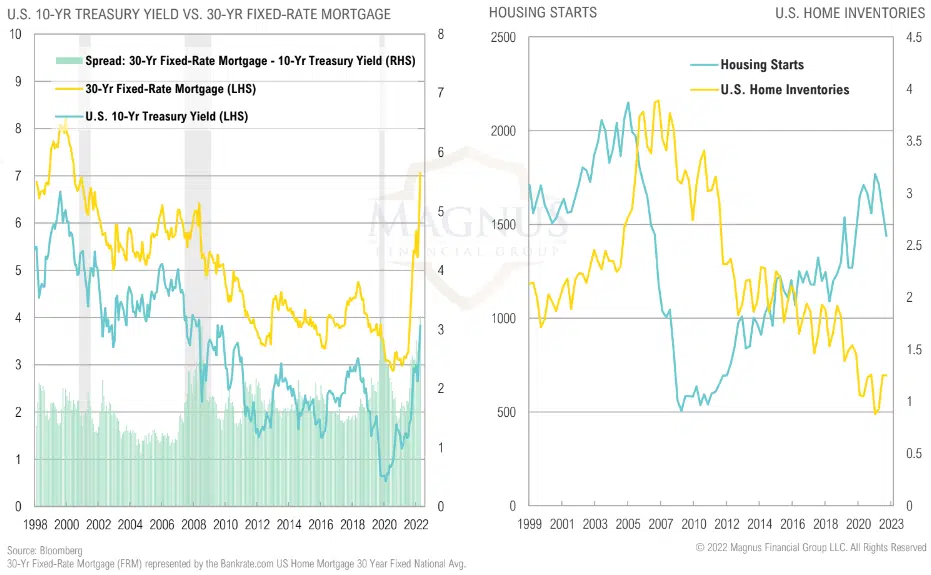
30-year fixed mortgage rates spiked in September as mortgage rate spreads vs. 10-year Treasury widened; higher rates will have a negative impact on housing and consumers with a lag
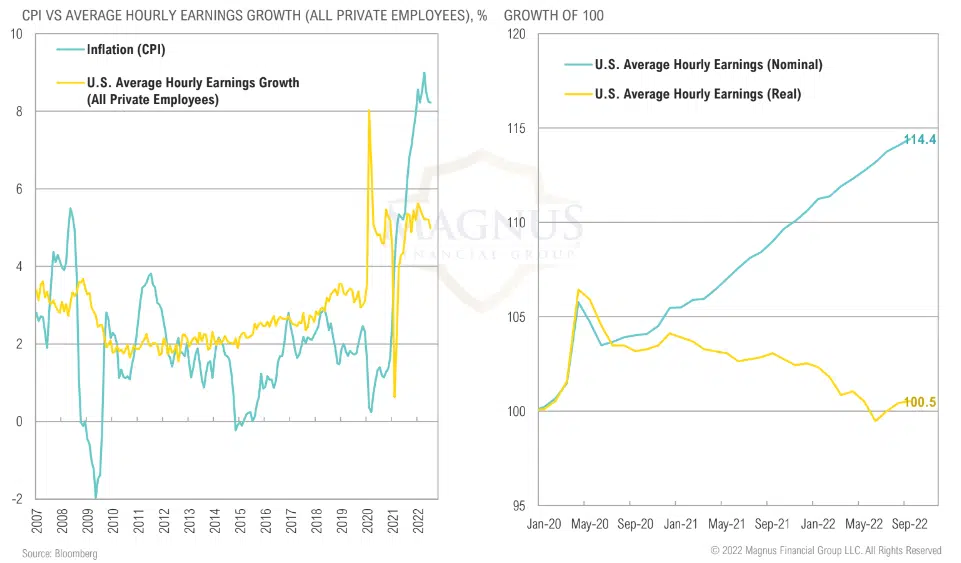
Since early 2021 inflation has outpaced wage growth, eroding real household disposable income
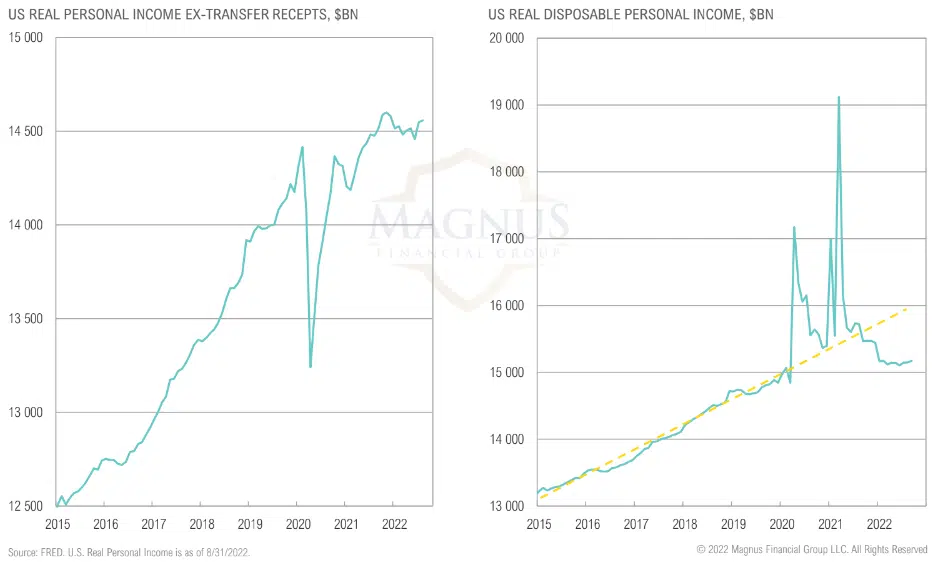
Real Income, excluding government transfers, is still grinding higher; total disposable income, however, has been treading water in recent months
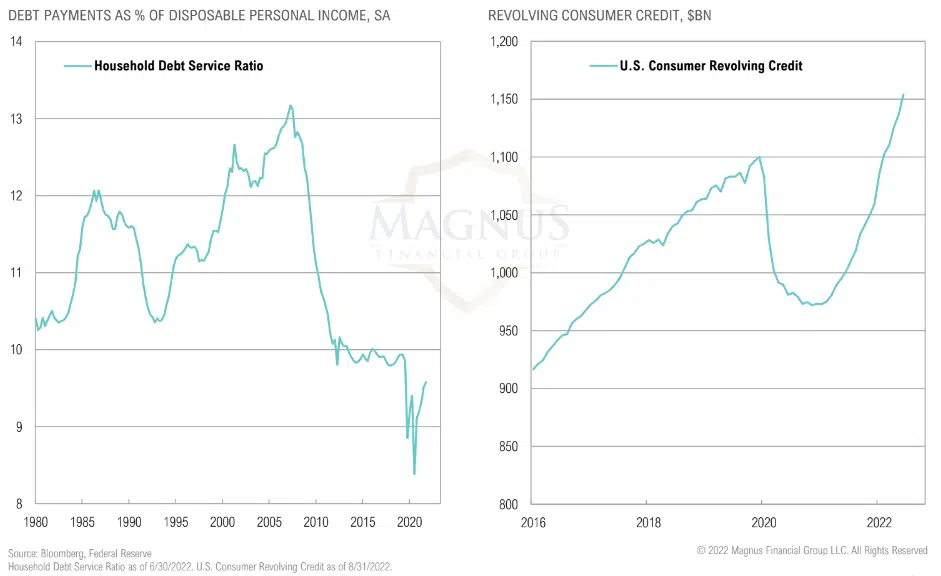
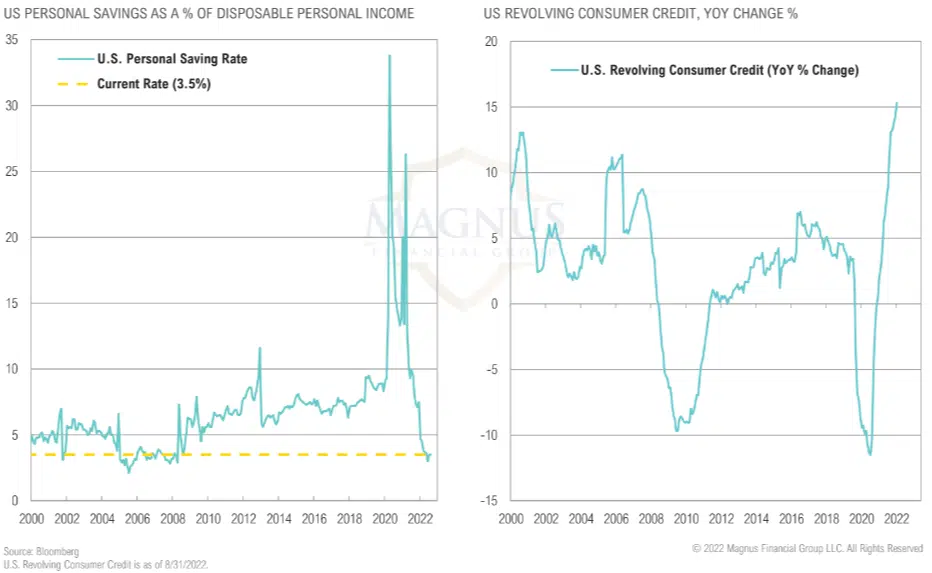
Consumer revolving credit has continued to increase, causing the household debt service ratio to rise
Consumer revolving credit has continued to increase, causing the household debt service ratio to rise
Consumer revolving credit has continued to increase, causing the household debt service ratio to rise
Consumer revolving credit has continued to increase, causing the household debt service ratio to rise
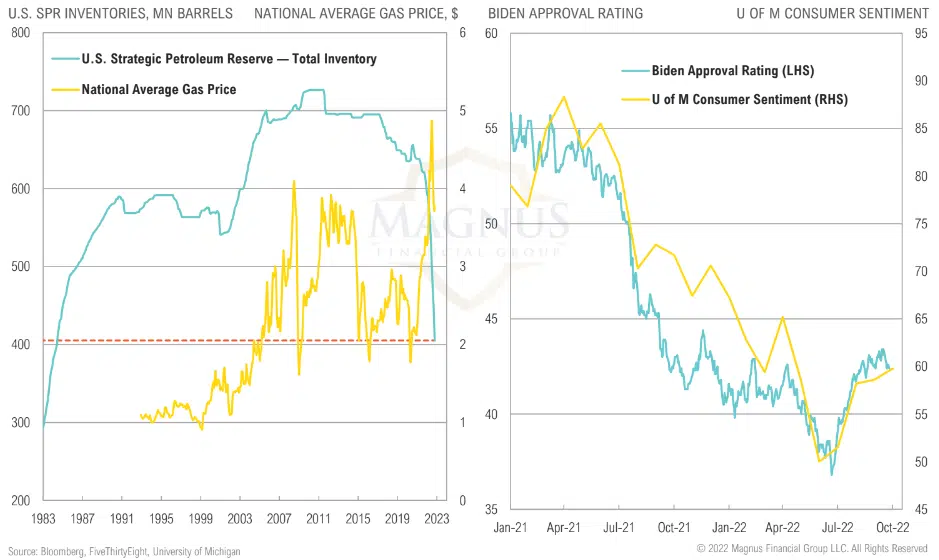
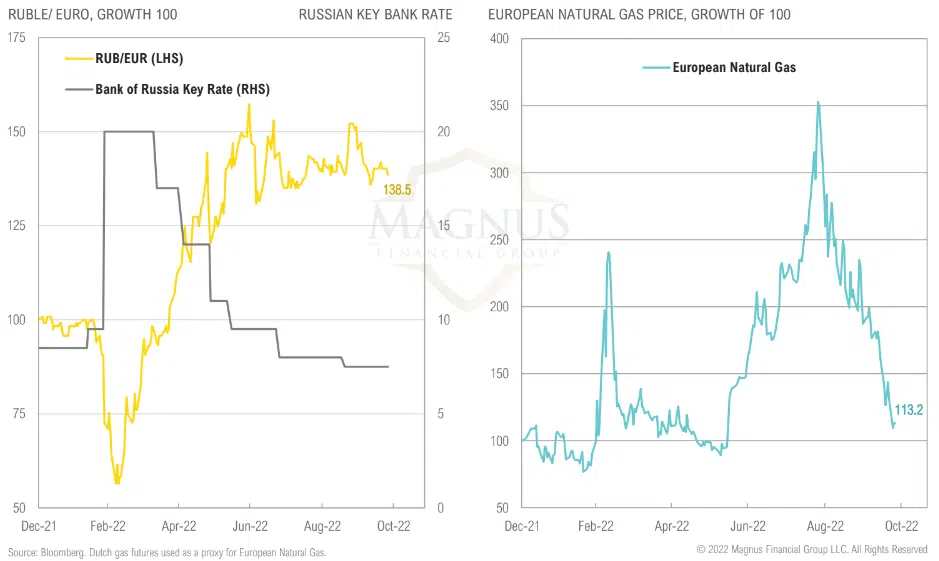
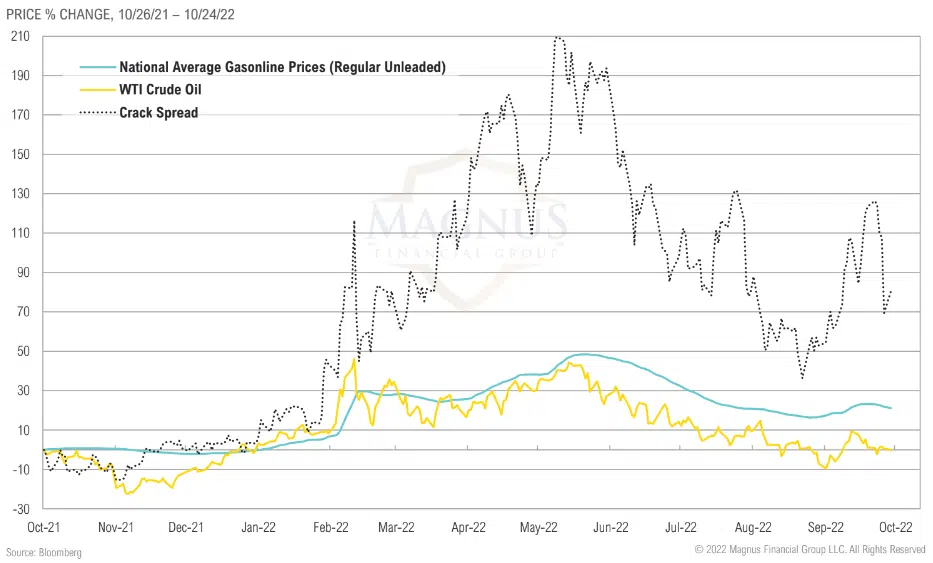
Biden’s SPR dump helped ease gas prices & inflation pressures, helped contribute to a modest improvement in sentiment (& his approval rating), but gas price trends may soon reverse
Looking ahead to November, the race for Senate control will rely on a select few toss-up states
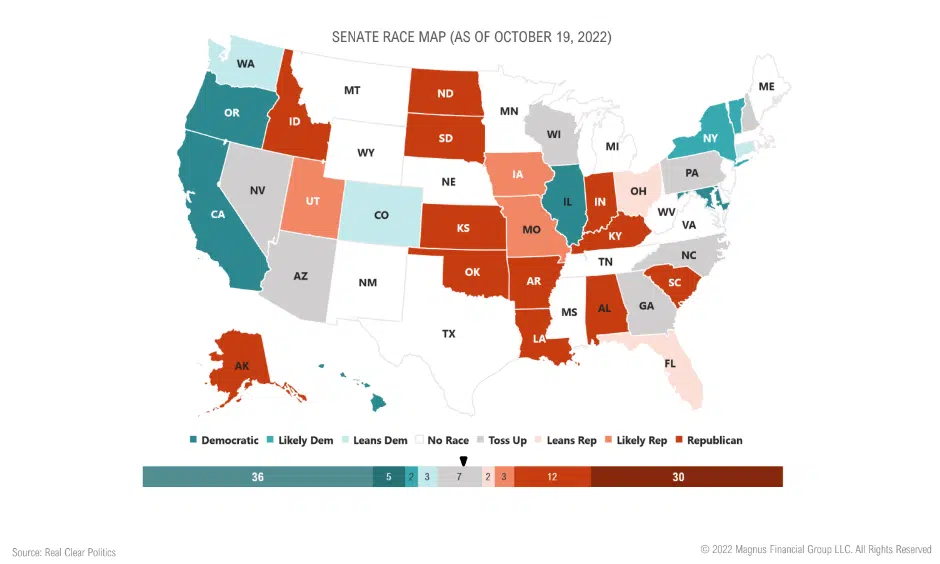
Looking ahead to November, the race for Senate control will rely on a select few toss-up states
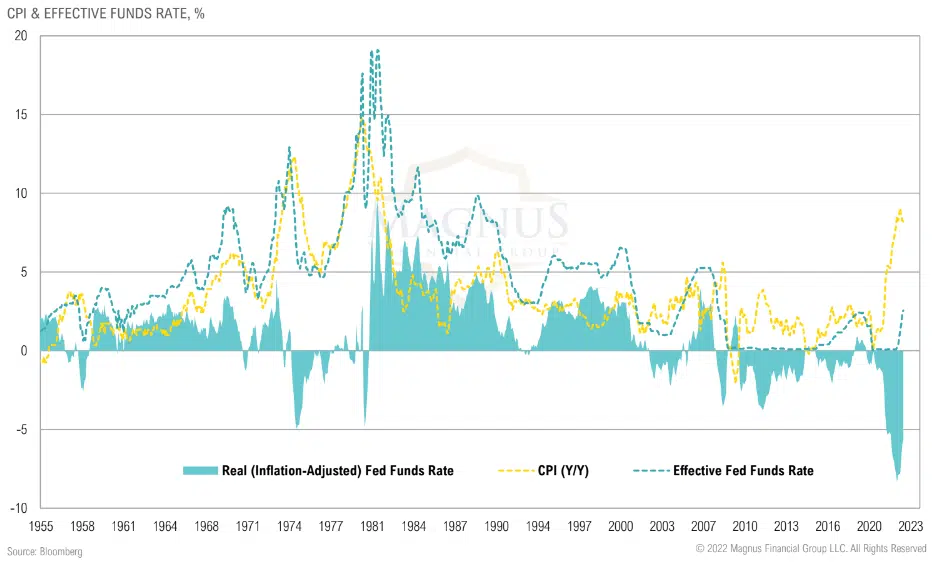
A Fed pivot at current levels isn’t justified by the data and would risk extending inflation shock and further eroding Fed’s credibility
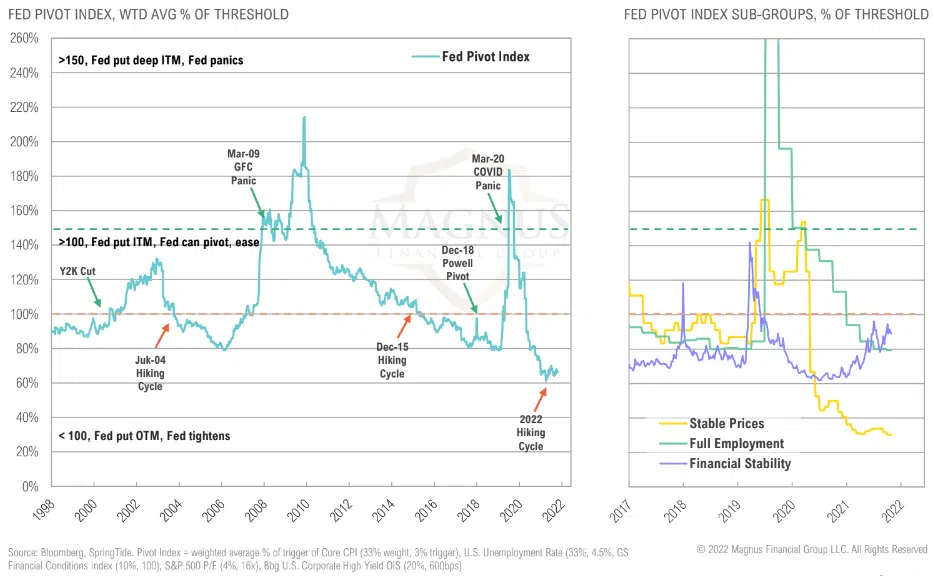
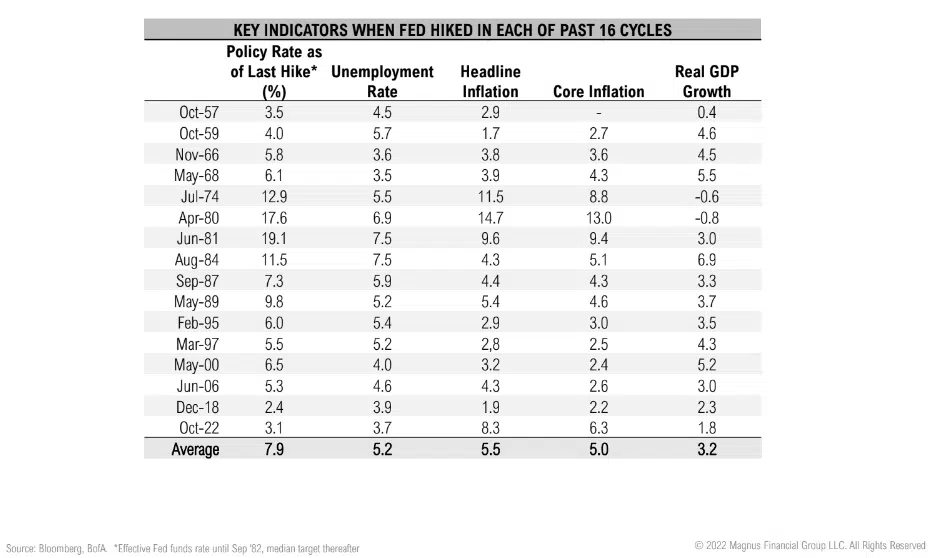
Average “pivot” (end of hiking cycle) since WWII saw Fed funds at 7.9%, headline inflation at 5.5%, core inflation at 5.0%, and the unemployment rate at 5.3%… We’re just not there yet!
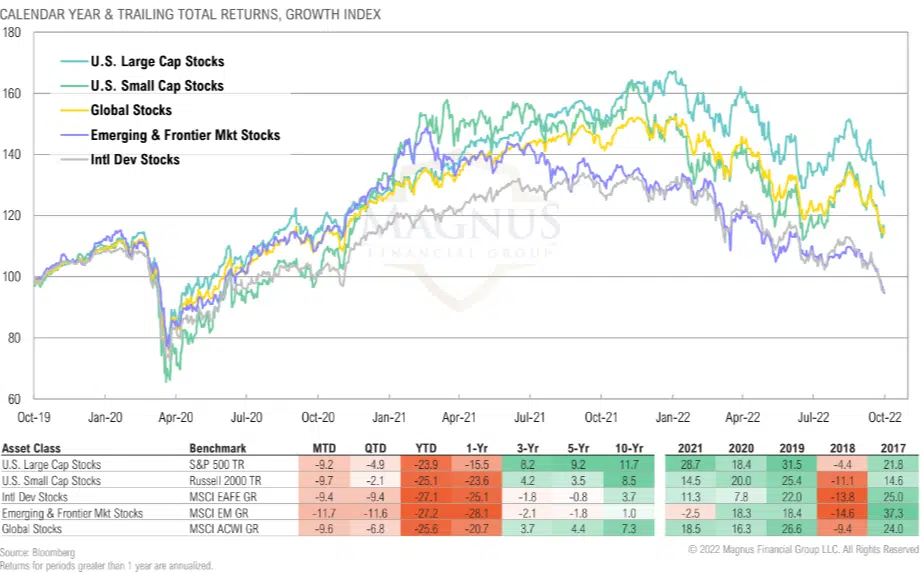
Despite dropping back into bear market territory, U.S. stocks have outperformed their international peers this year; EM underperformed over the quarter
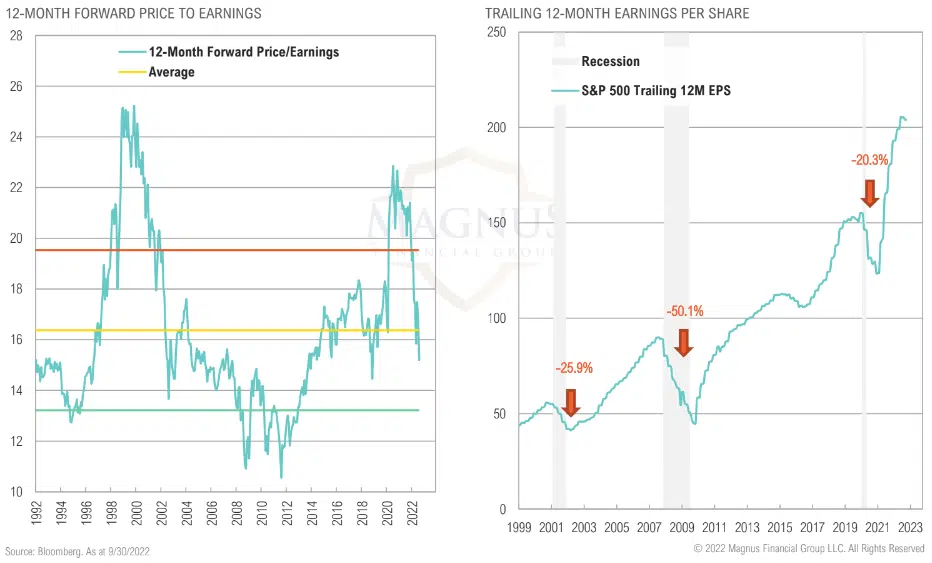
Forward valuations have improved due to bear market, slightly below average relative to history; focus now shifts to earnings decline; history suggests baseline should be at least 20% drop
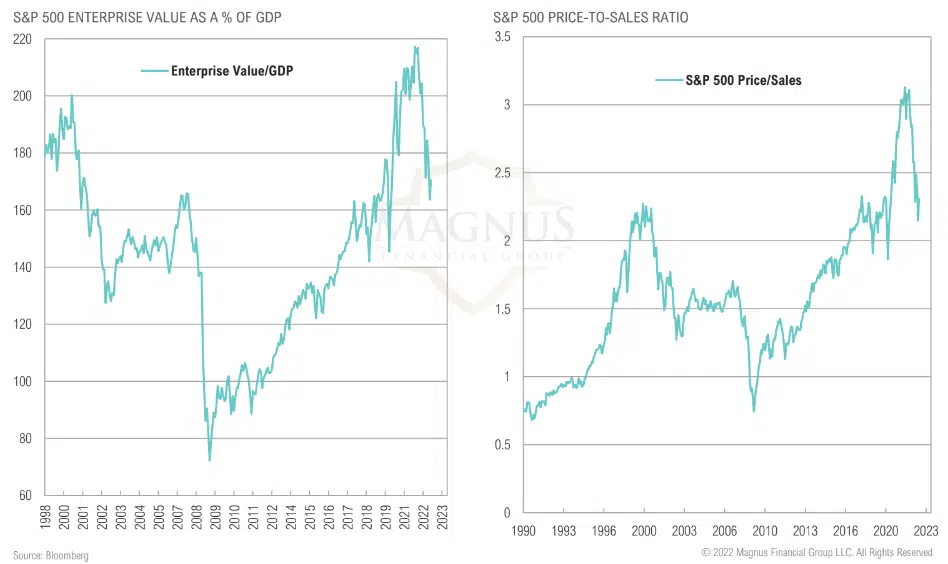
Adjusting for record-high margins, equity valuations are not compelling
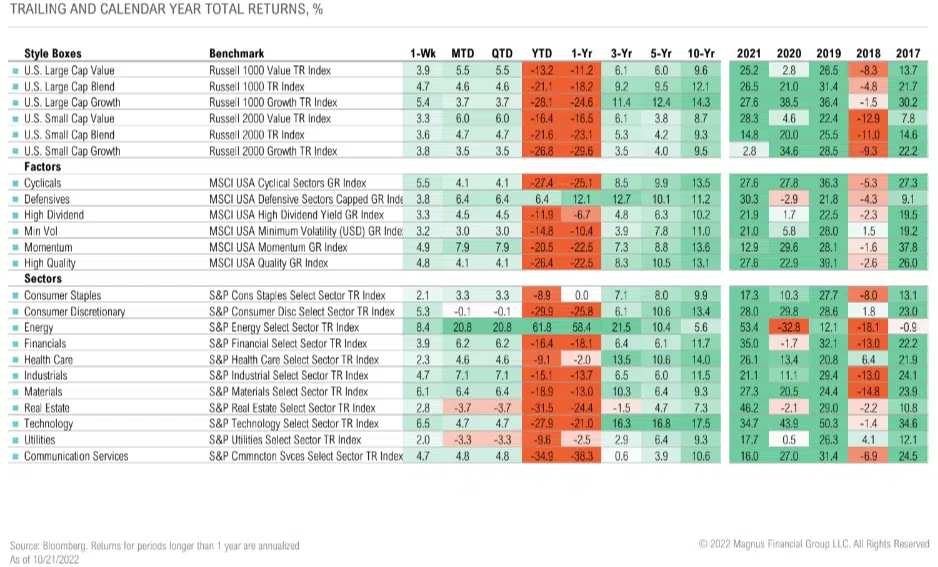
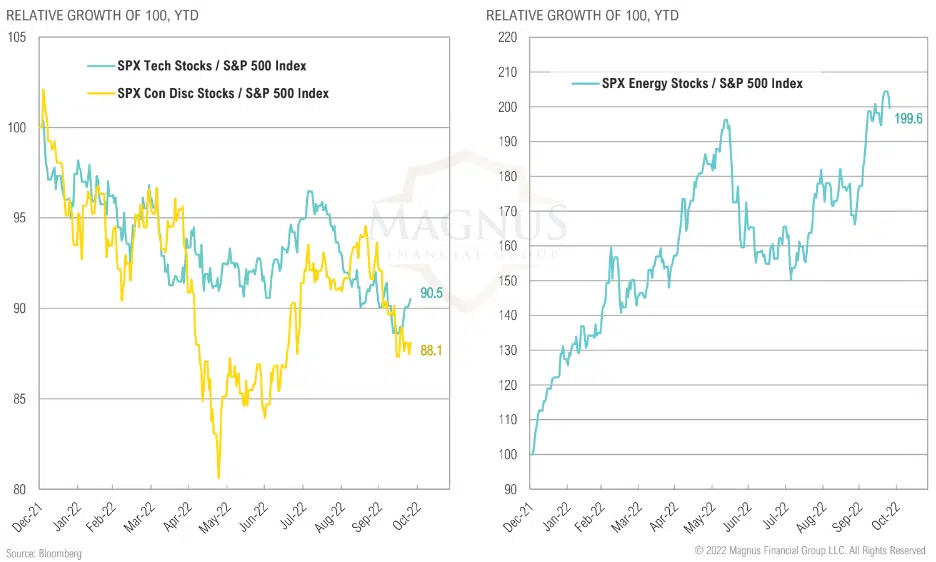
Energy ahead of consumer discretionary, tech and real estate by approximately 90% year-to-date
Analyst EPS expectations remain high, but have started to decline
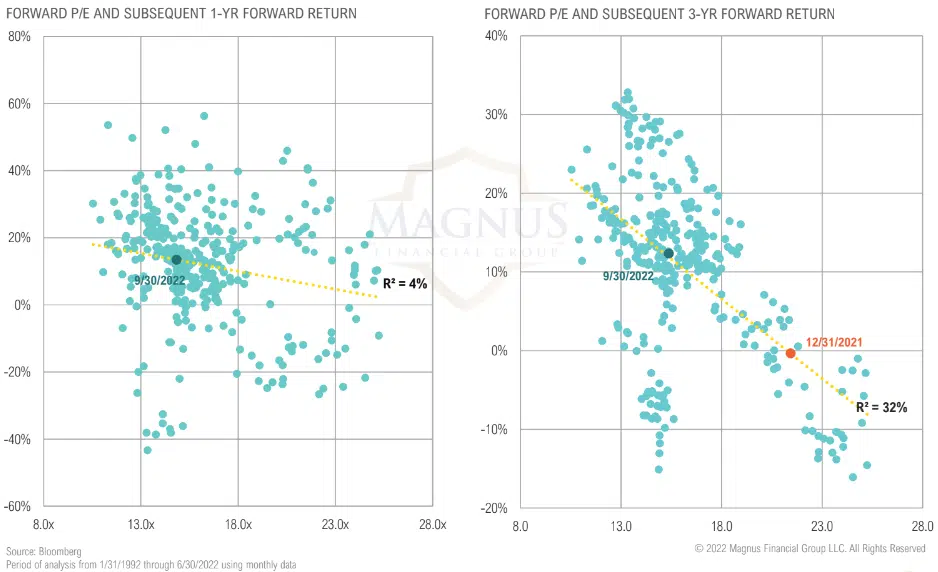
Forward P/Es have little predictive power for one-year forward equity returns, but have been reasonably predictive over longer time horizons
Valuations continue to contract so far this year
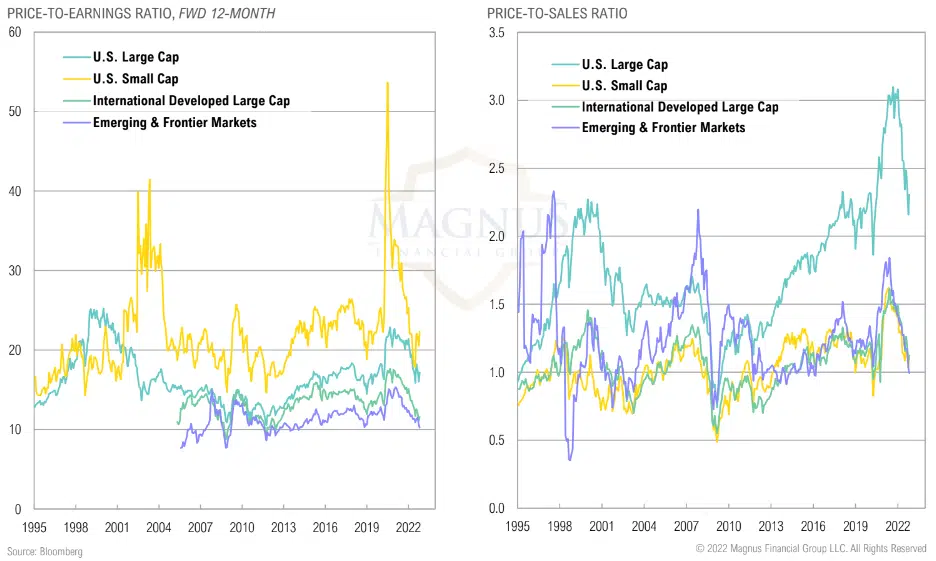
Forward-looking valuations improved dramatically, but earnings estimates will now come into question given potential margin pressure; value still looks relatively cheaper (i.e., this is not 2008-2010)
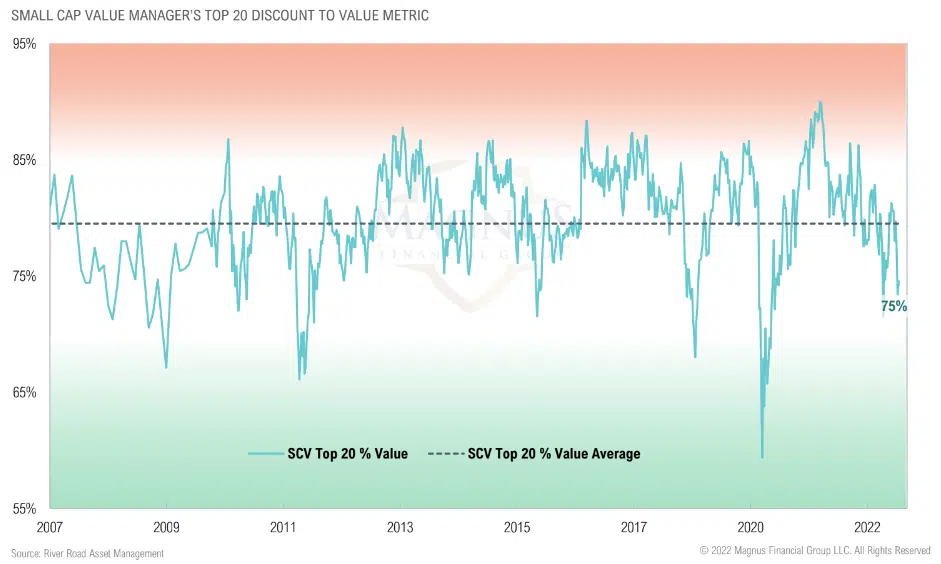
Within small cap value, valuations are below average, but not at levels typically seen in major market drawdowns
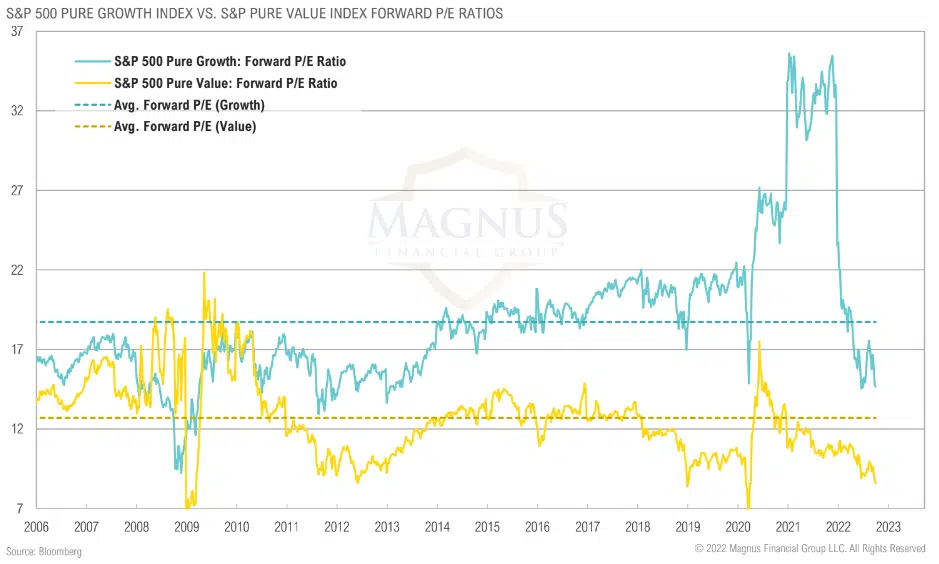
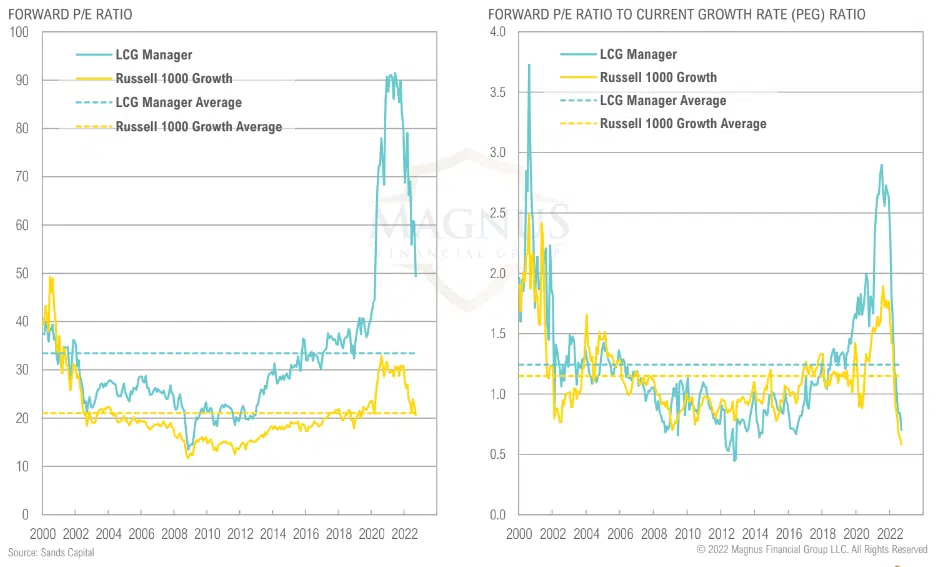
Growth valuations seem attractive when accounting for high growth expectations, but they are not attractive on an absolute level
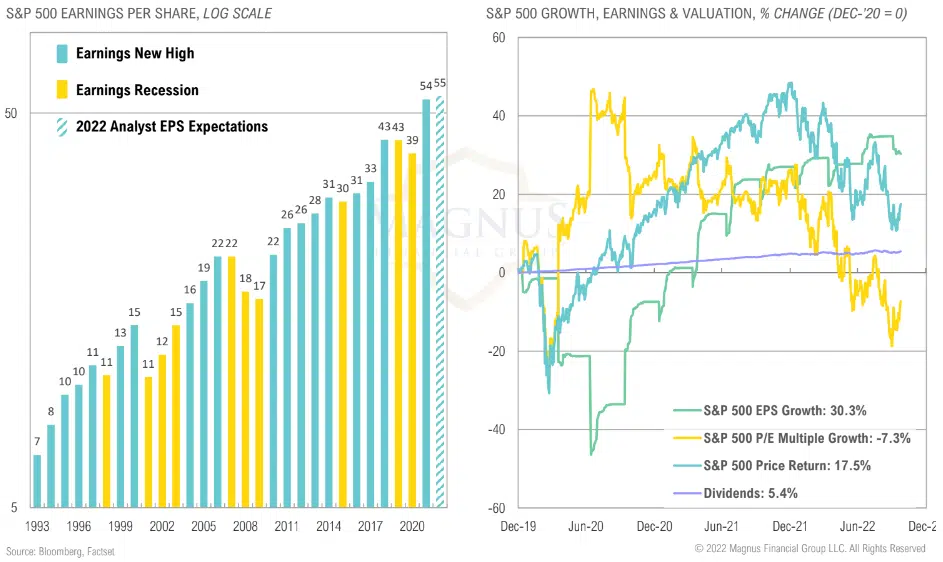
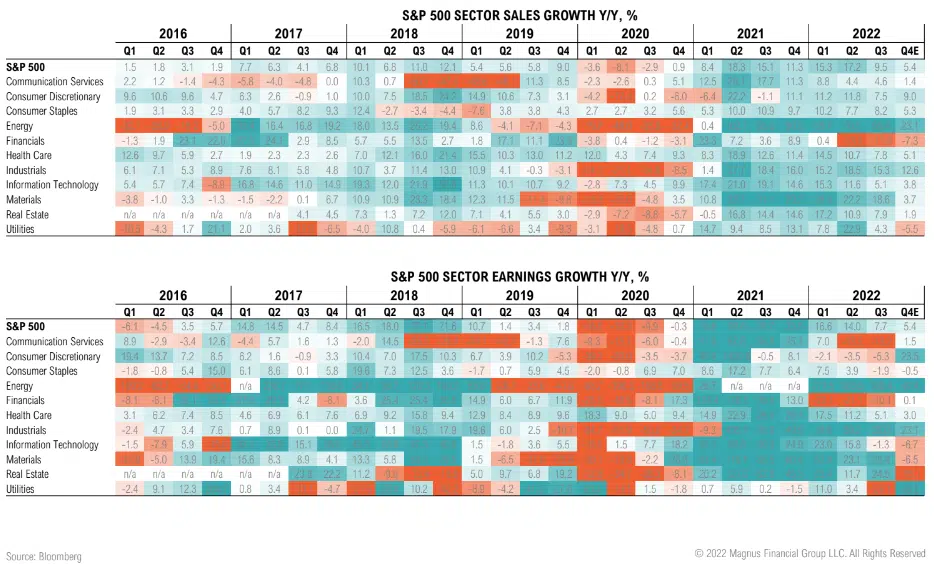
Nominal sales and earnings growth expected to decelerate for remainder of 2022; impact of inflation and potential recession huge wild cards next year
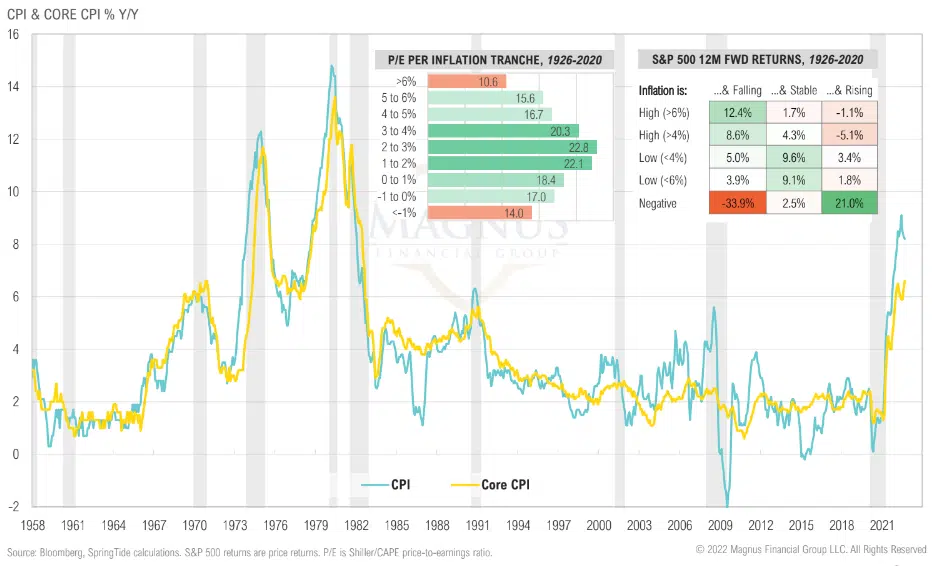
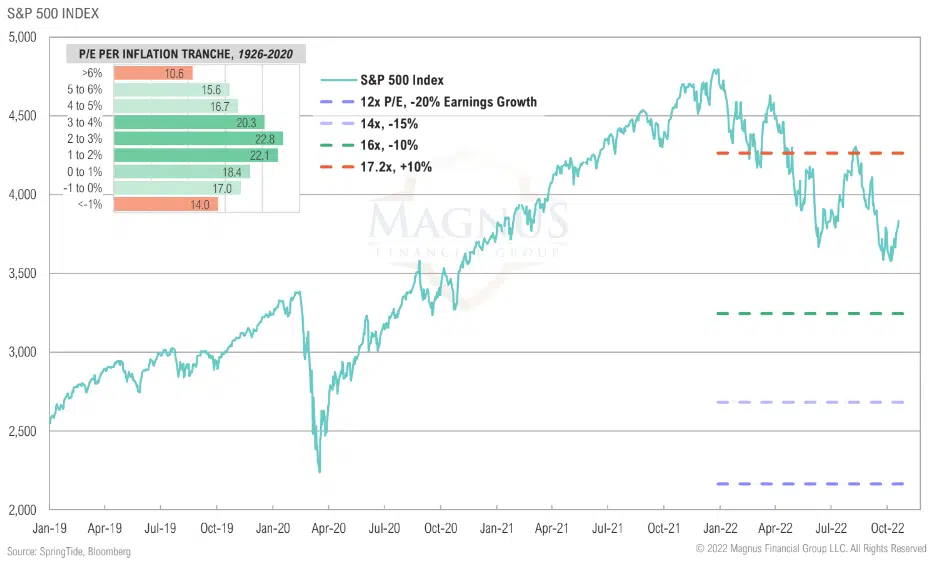
Historically, inflation has been a significant issue for the stock market when it is above 4%, even more so when above 6%
Market internals point to consumer stress; energy breaking out
Despite being in a bear market, stocks are arguably less attractively priced vis-à-vis bonds than they were coming into the year
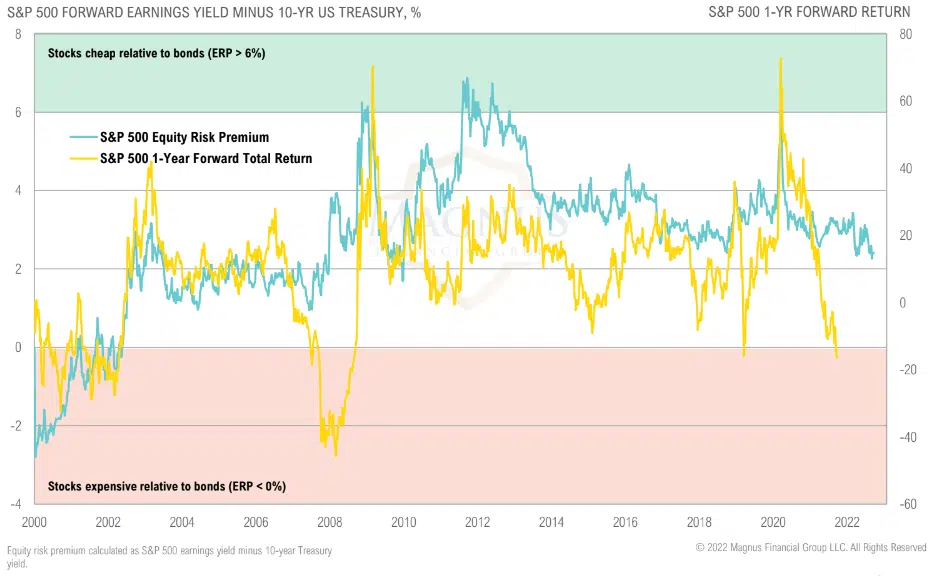
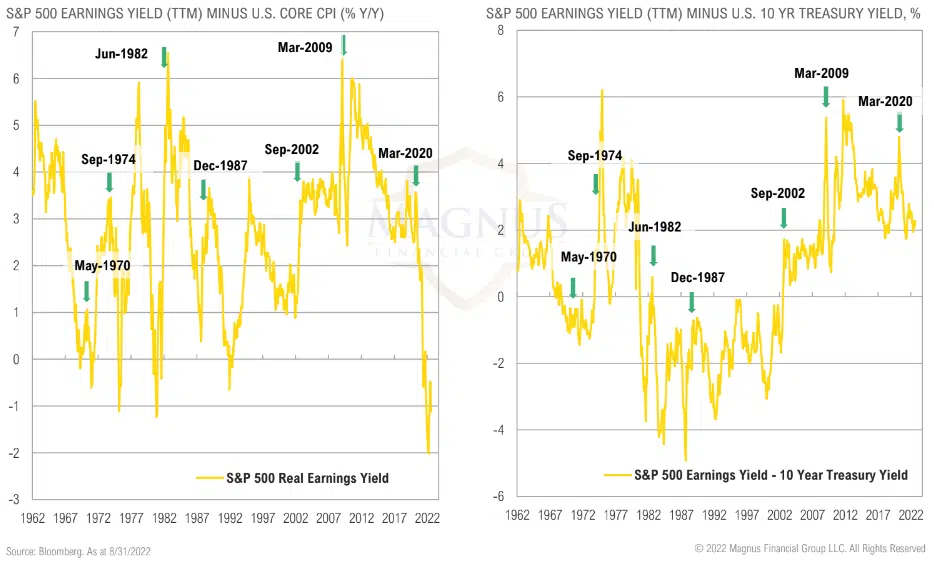
The S&P 500 real earnings yield is still negative and substantially lower than previous bear market lows
Tranching in equities: P/E multiple levels to consider are 16x, 14x, and 12x, applied to various levels of earnings decline
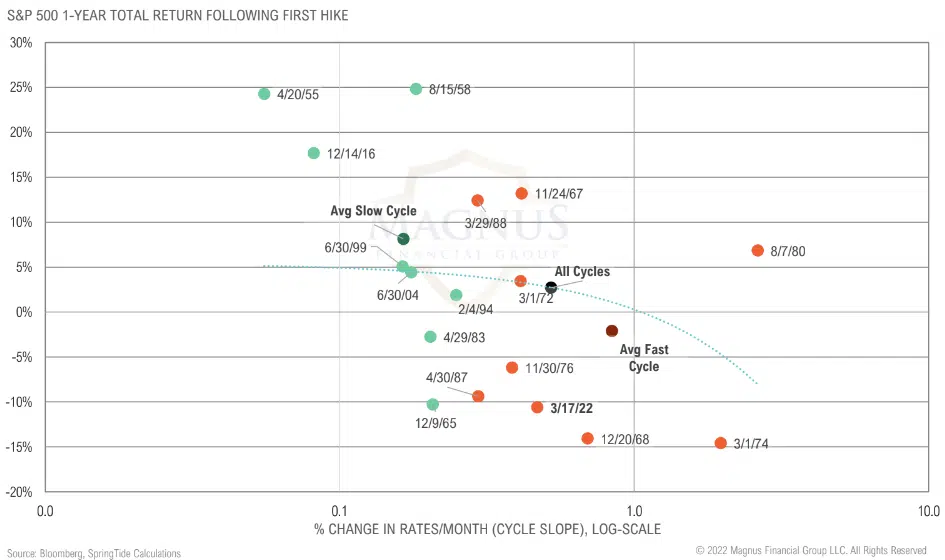
Fast hiking cycles correlate with poor returns following first rate hike; this cycle’s hike pace combined with QT make it more restrictive than this chart suggests
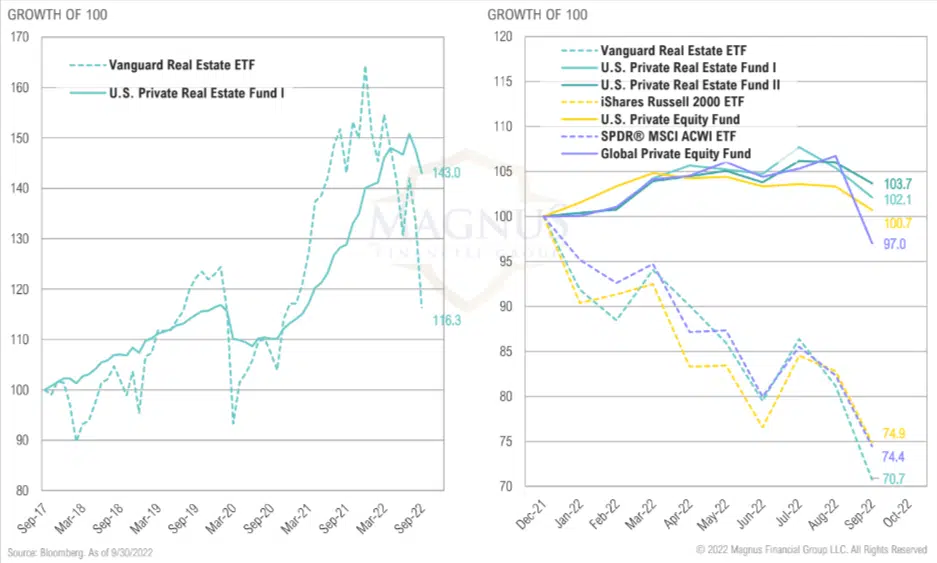
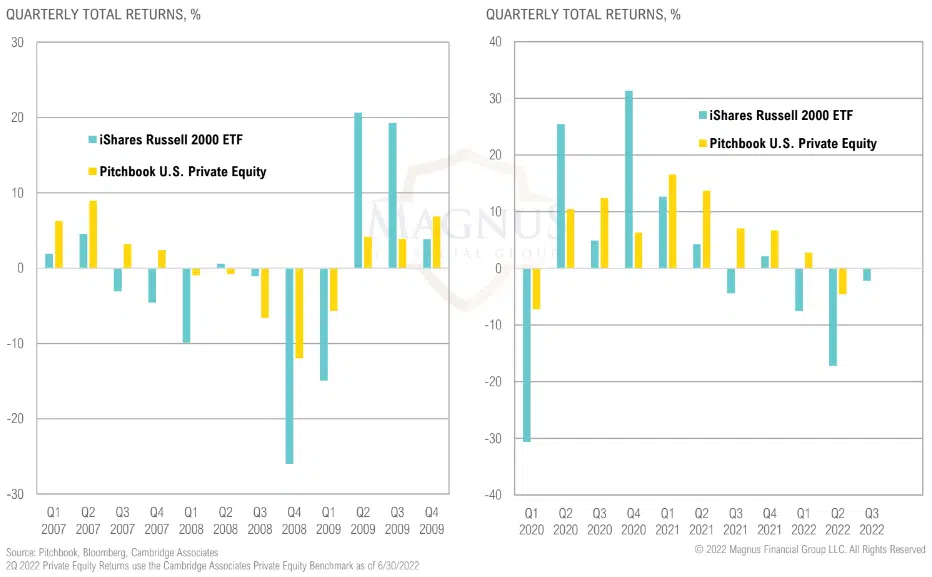
Private equity funds have not marked down their portfolios like they did in the GFC
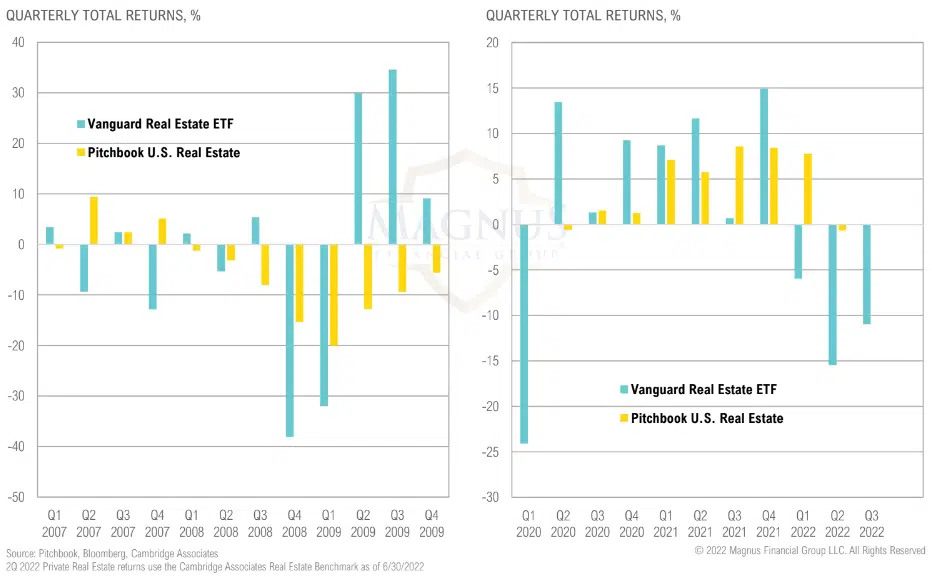
The same dynamic is happening in private real estate
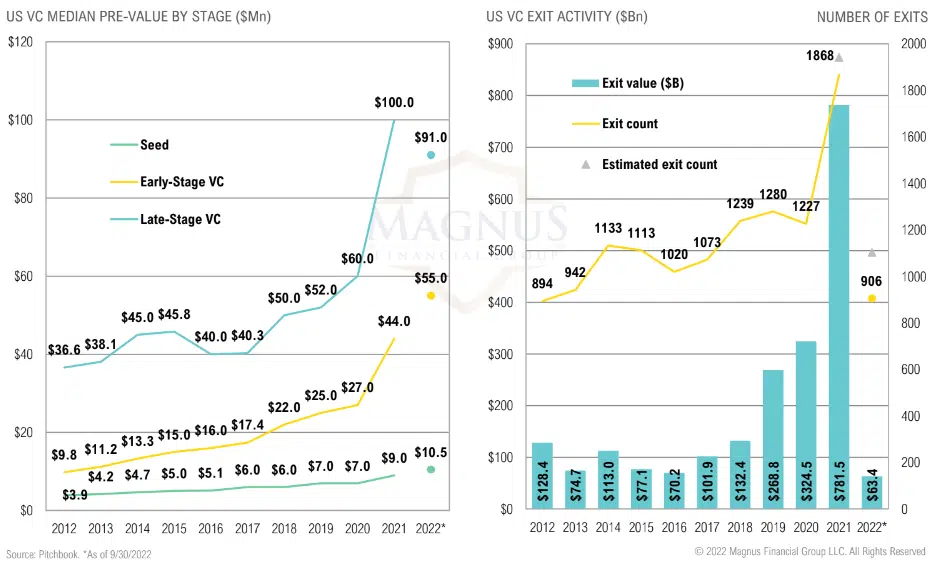
Venture valuations remain high while exits are on pace for lowest year since 2016
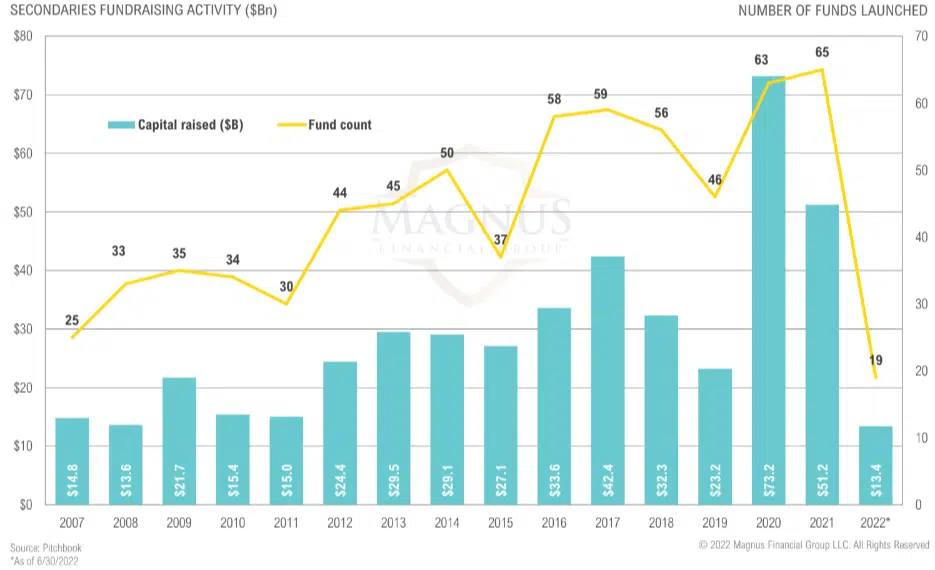
Secondaries fundraising activity on pace for a 10-year low
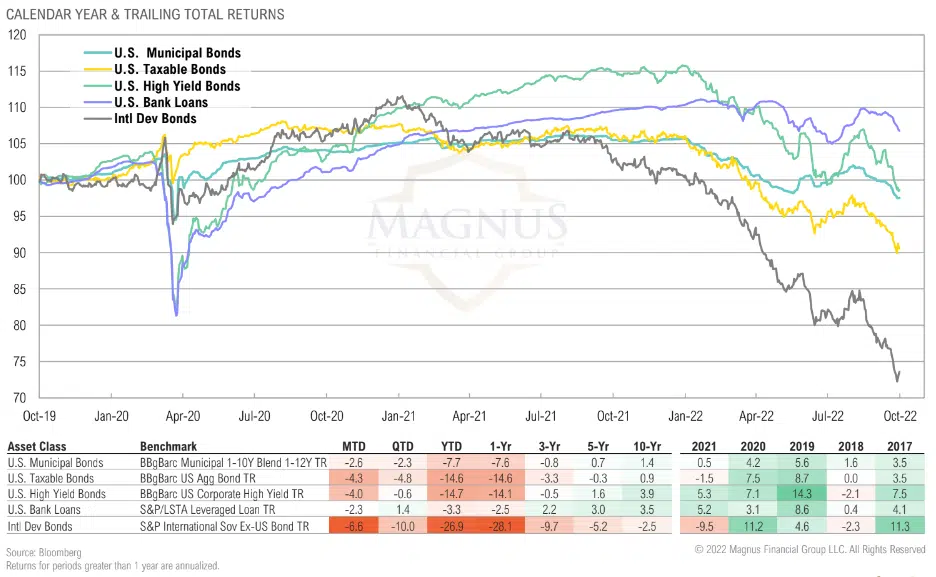
Most U.S. fixed income and credit asset classes were down over the quarter; international developed bonds fared the worst and are now down over the last decade
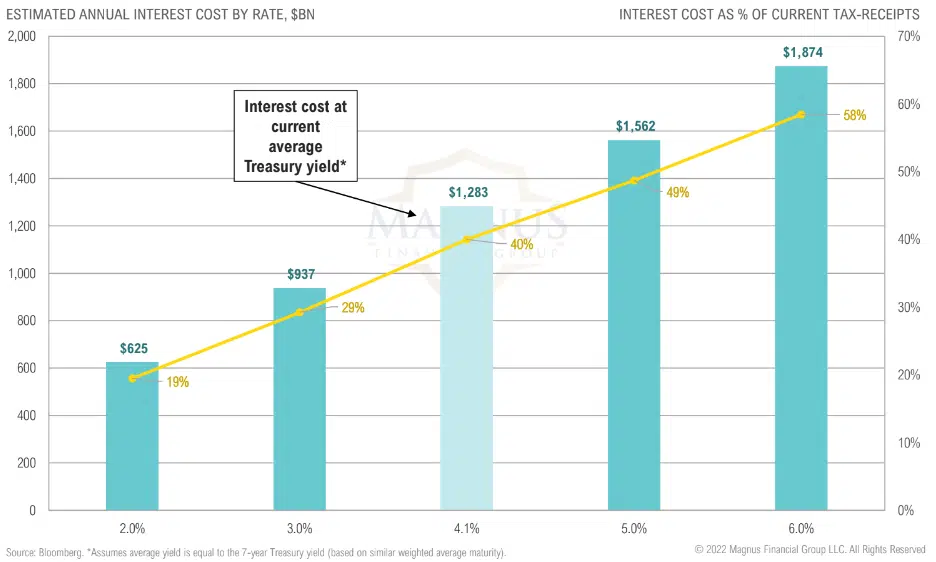
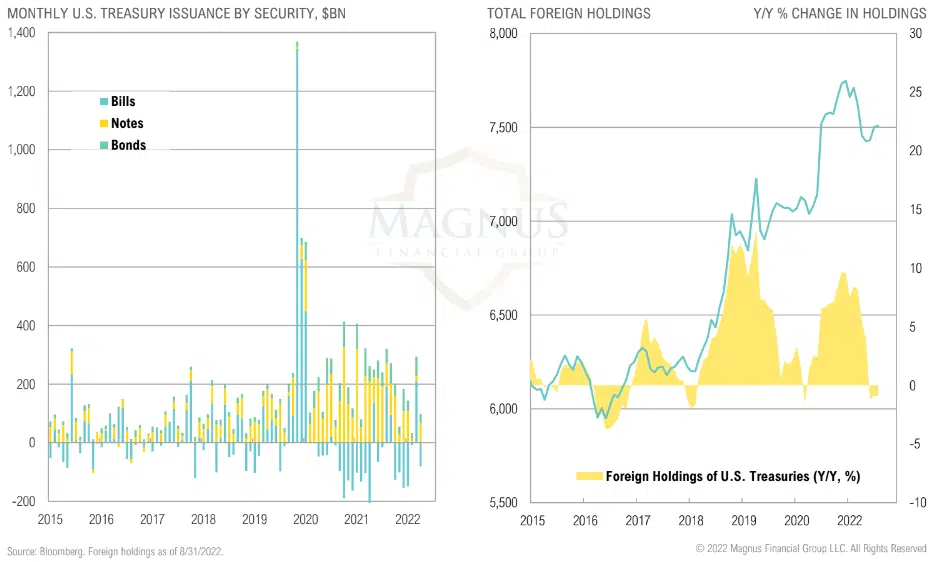
The treasury market has been an enabler of increasing deficit spending and debt levels…is it now “Fed up”?
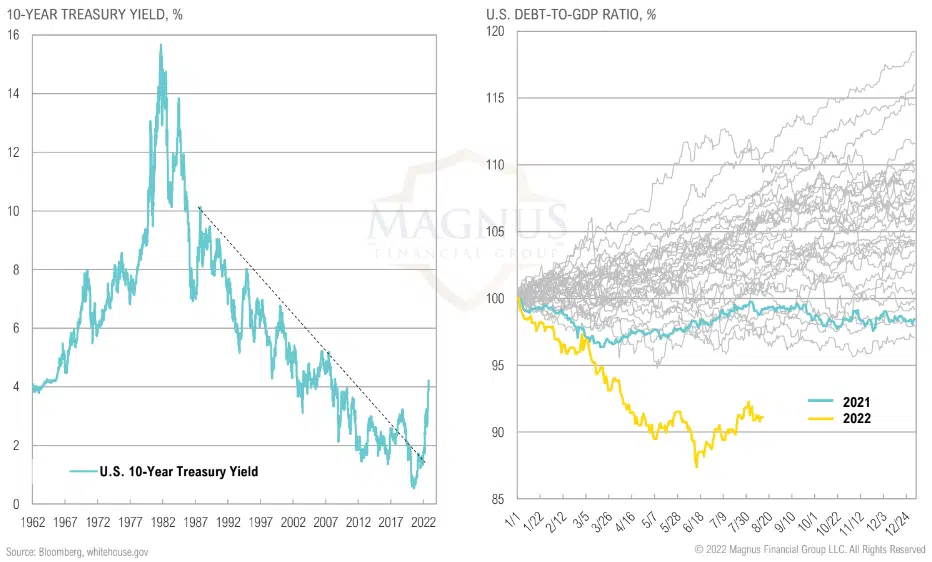
The treasury market has been an enabler of increasing deficit spending and debt levels…is it now “Fed up”?
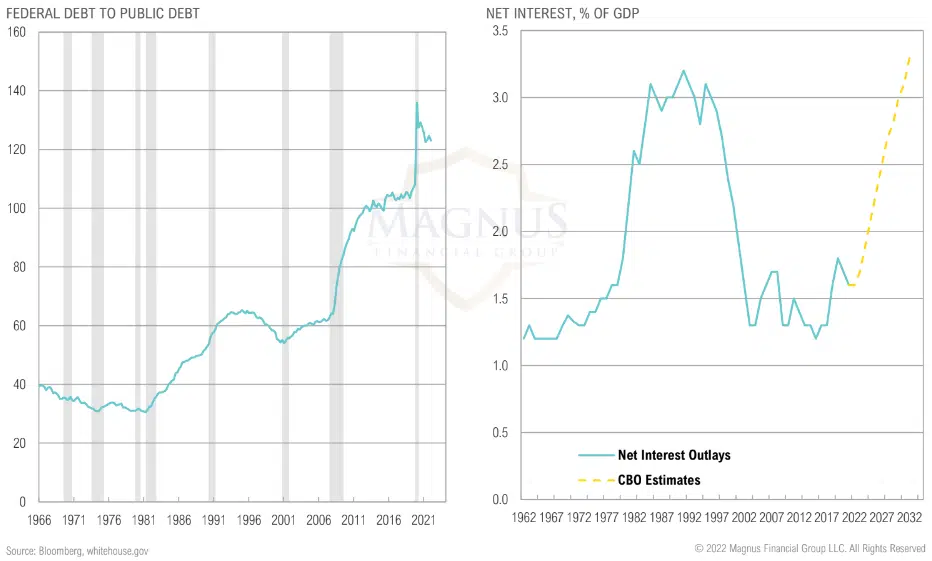
The treasury market has been an enabler of increasing deficit spending and debt levels…is it now “Fed up”?
Market increasingly punishing policy mistakes, especially when you’re not the global reserve currency
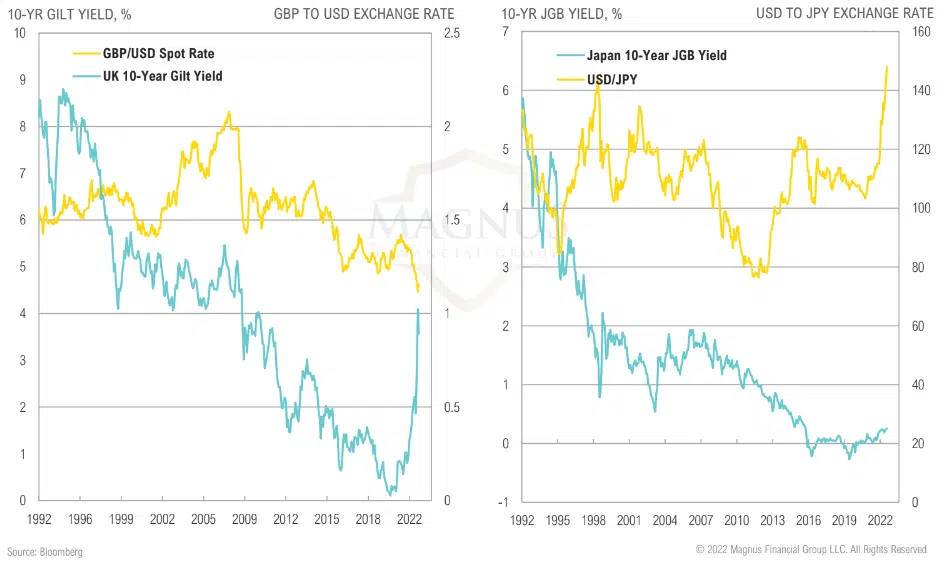
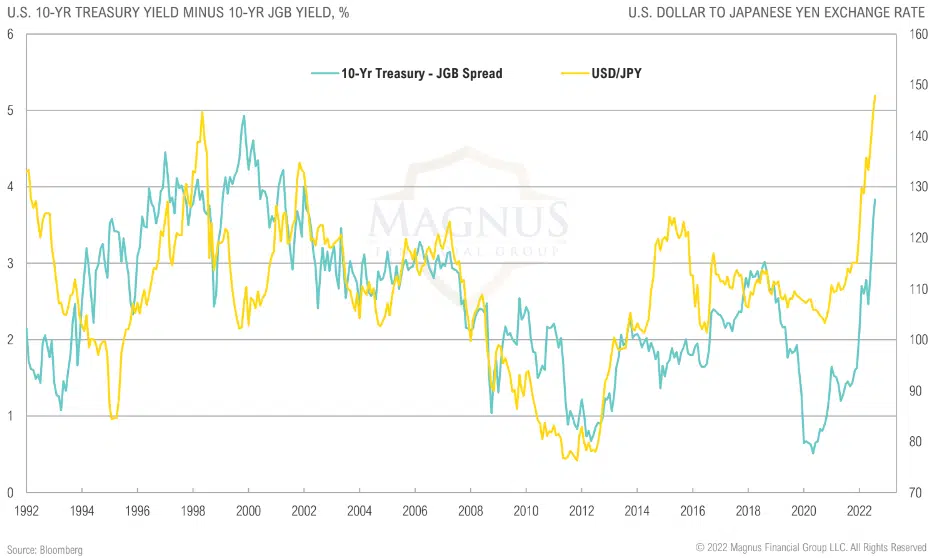
The yen has weakened to a 20-year low against the dollar as the BOJ continues its infinite QE; US Treasuries remain attractive vs JGB’s
Context for current monetary policy disaster: the Fed fell so far behind the curve that unless inflation rolled over by itself, they forced themselves to have to hike into an economic slowdown/recession
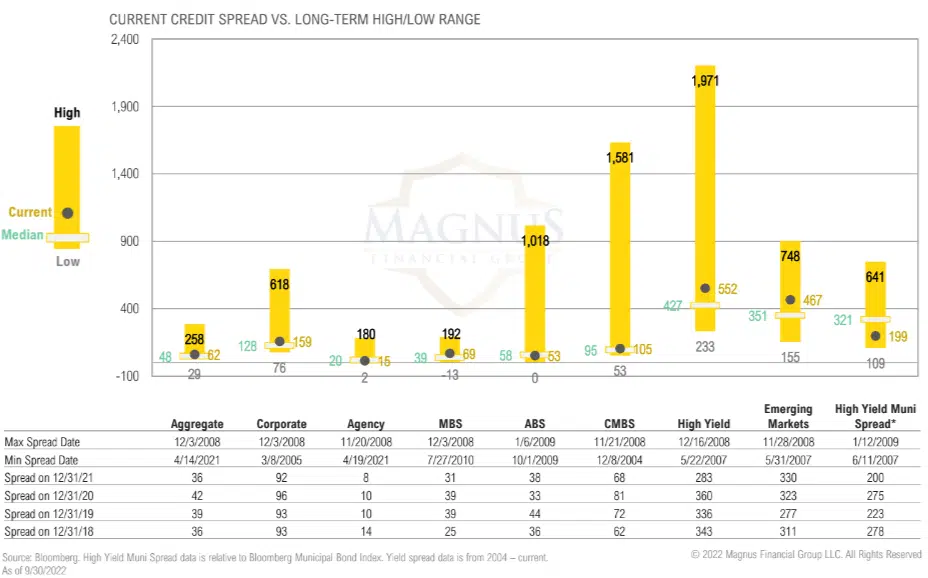
Credit spreads at or modestly above average across most sectors; starting to shift up modestly as recession fears start to become more entrenched
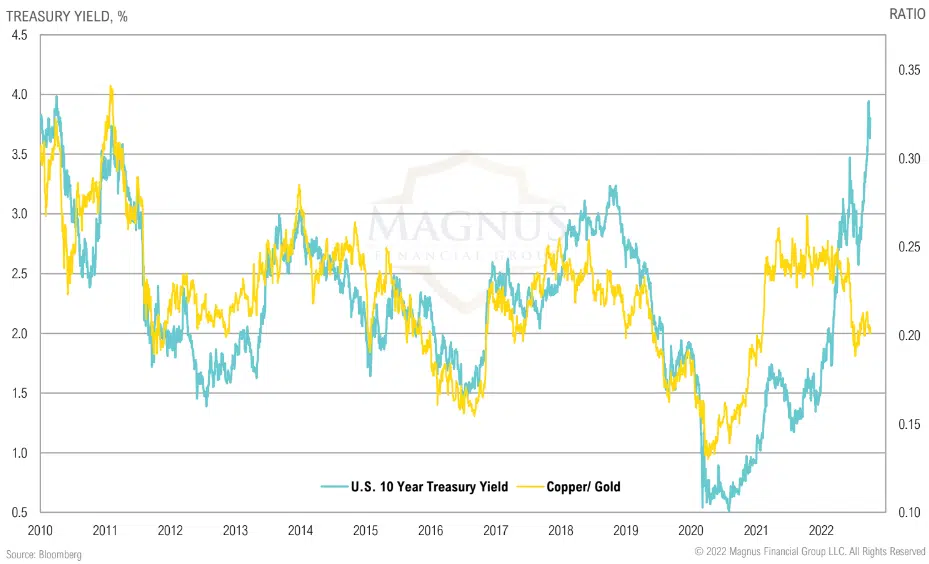
Collapse in copper/gold ratio—a proxy for the real economy vis-à-vis financial assets—suggests Treasury yields may head lower
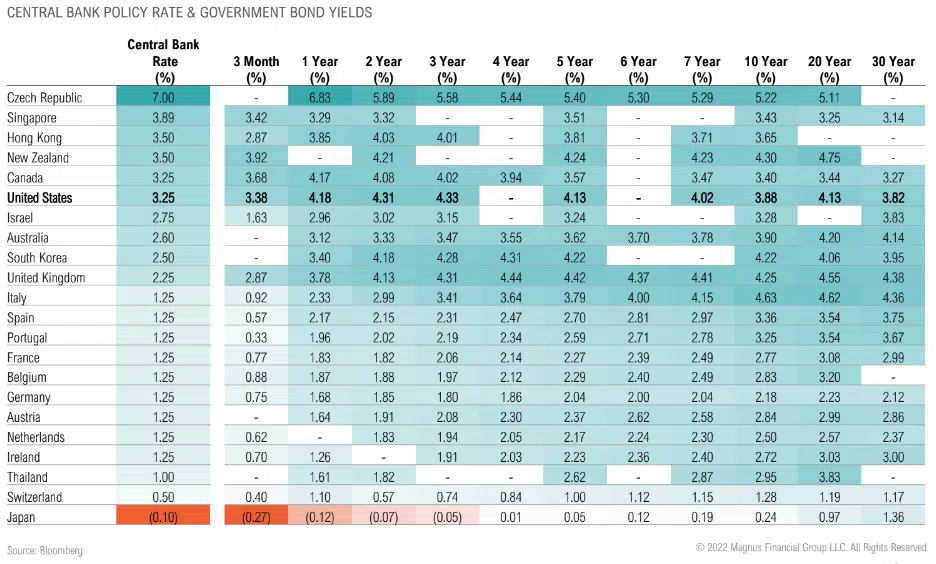
The U.S. bond market remains relatively higher yield, which could help keep U.S. rates somewhat contained
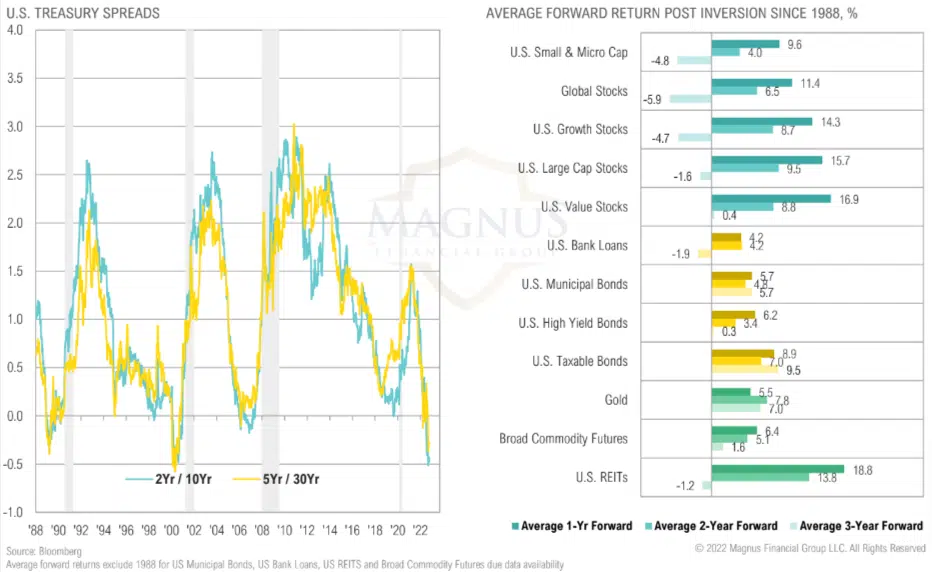
Yield curve inversion signaling slowing growth; risky assets can generate strong short-term returns post inversion, but we don’t like “pennies in front of steam roller trades”
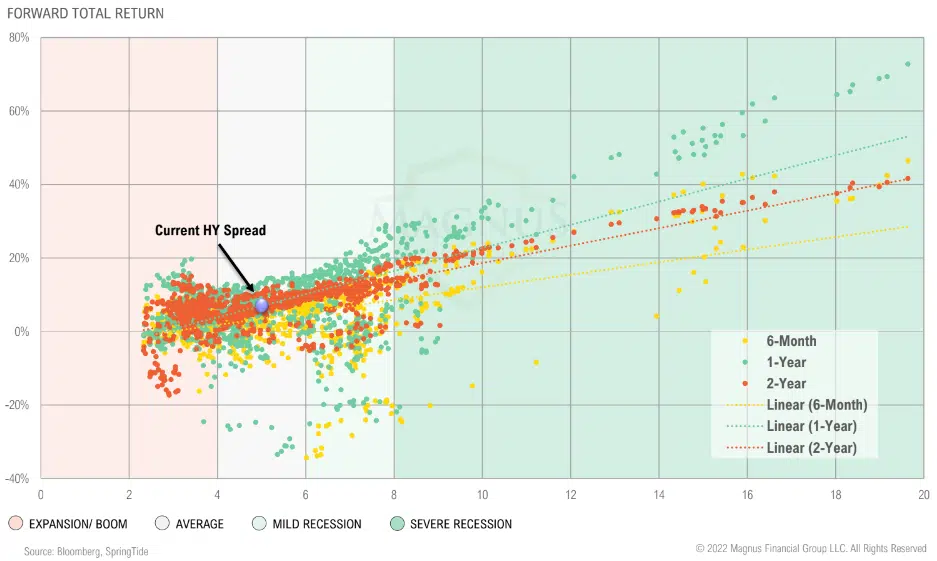
Historically, high yield spreads above 6% have resulted in above average forward returns; high yield spread currently trading at 5.0%
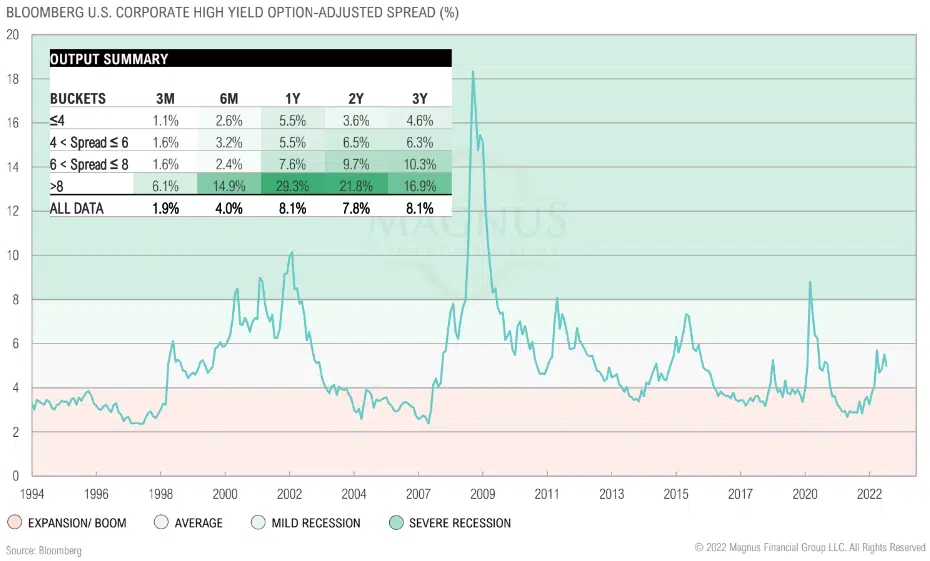
Historically, high yield spreads above 6% have resulted in above average forward returns; high yield spread currently trading at 5.0%
Q4 net issuance expected to be $400Bn
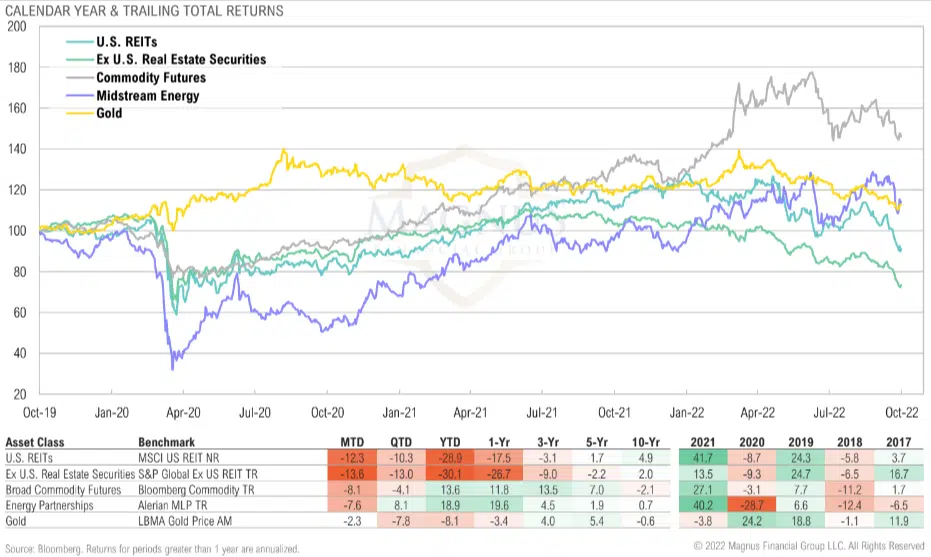
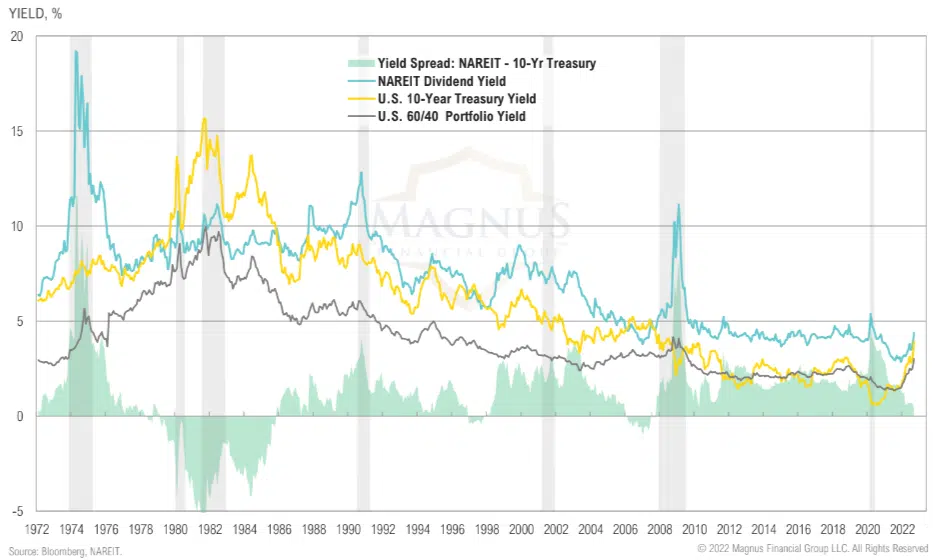
While energy gave back returns in September, it was the only area of the real assets and infrastructure category to be up in Q3; REITs continue to struggle in the rising rate environment
Commodity roll yield suggests very tight global commodity markets, potential for strong forward returns (but obviously with risks)
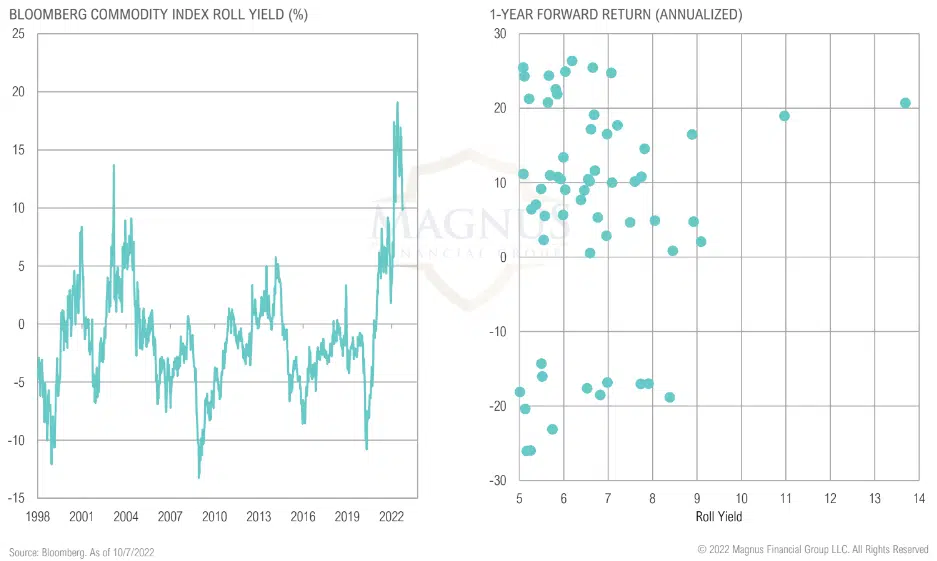
Commodity roll yield suggests very tight global commodity markets, potential for strong forward returns (but obviously with risks)
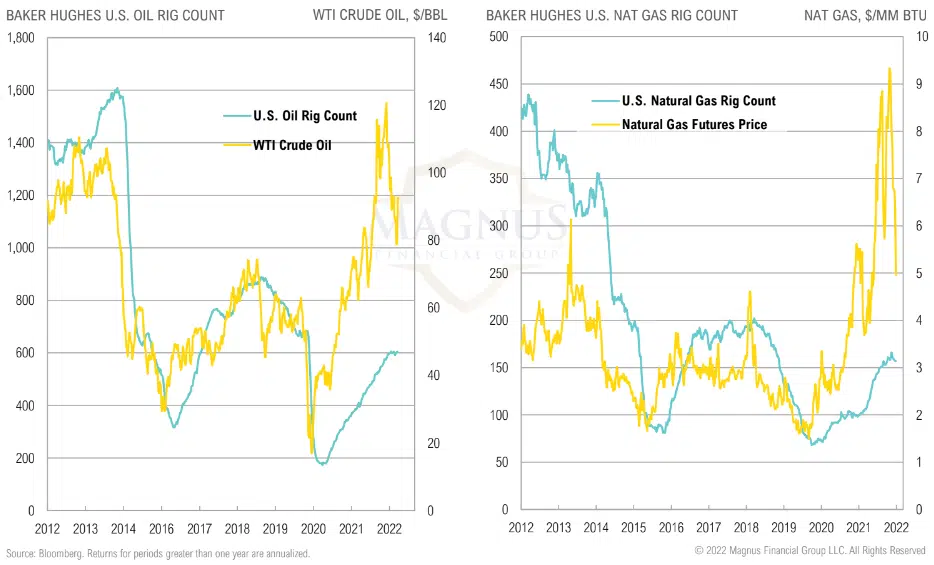
Since COVID, drilling capex levels have been near the bottom of a 65-year range
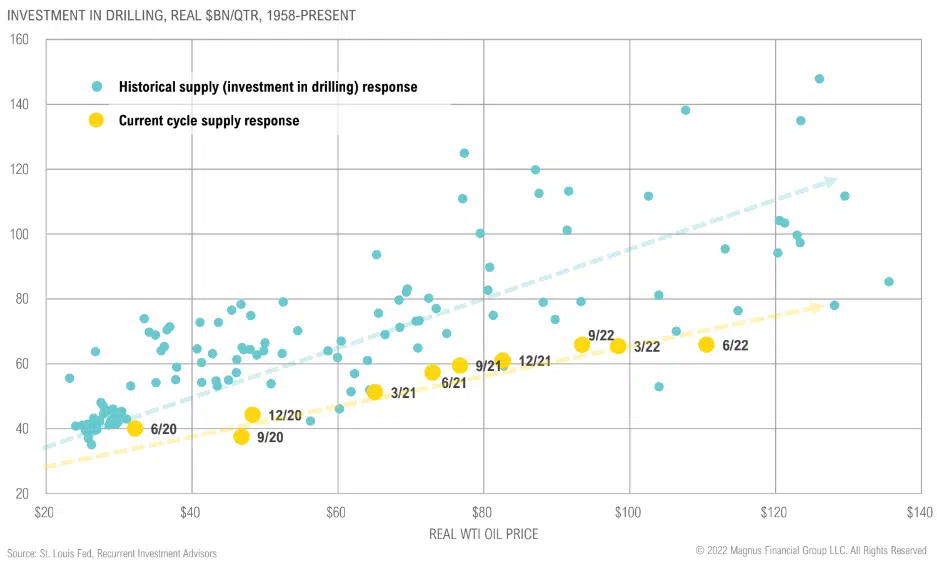
Since COVID, drilling capex levels have been near the bottom of a 65-year range
Midstream distribution yields trending lower as sector breaks out to upside but remain relatively attractive, free cash flow yields of energy sector remain attractive
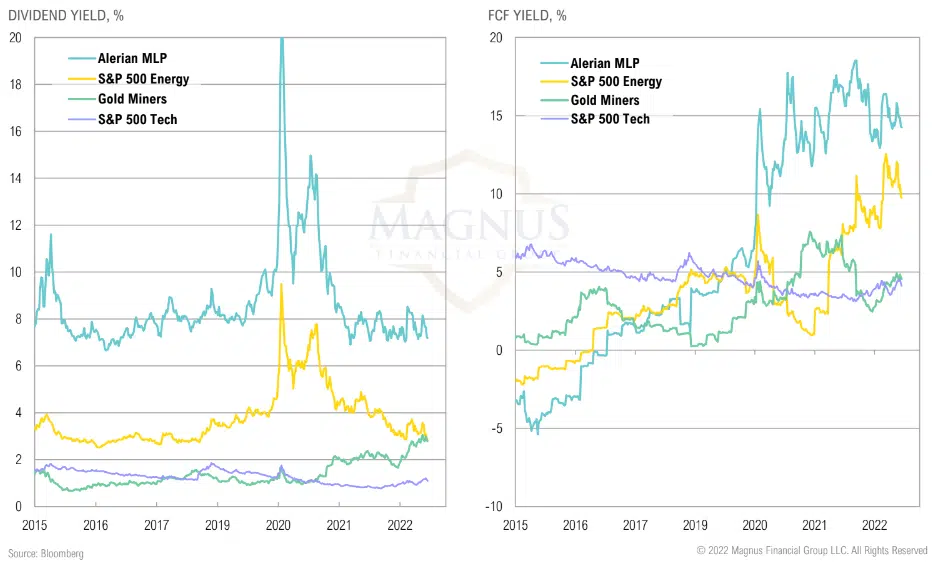
Midstream distribution yields trending lower as sector breaks out to upside but remain relatively attractive, free cash flow yields of energy sector remain attractive
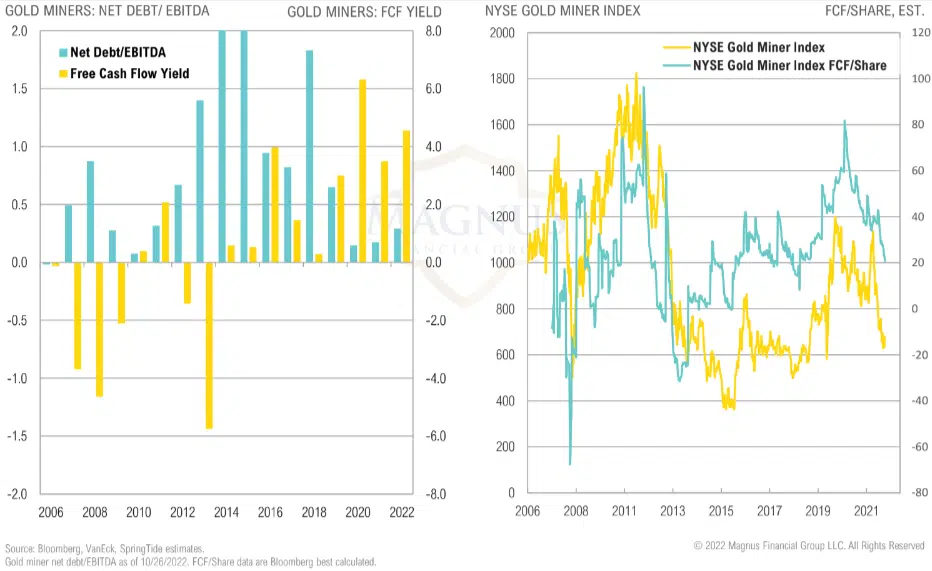
Gold miners have been trying to catch up to improved cash flows, but risk remains that further gold price declines hurt future free cash flow yields
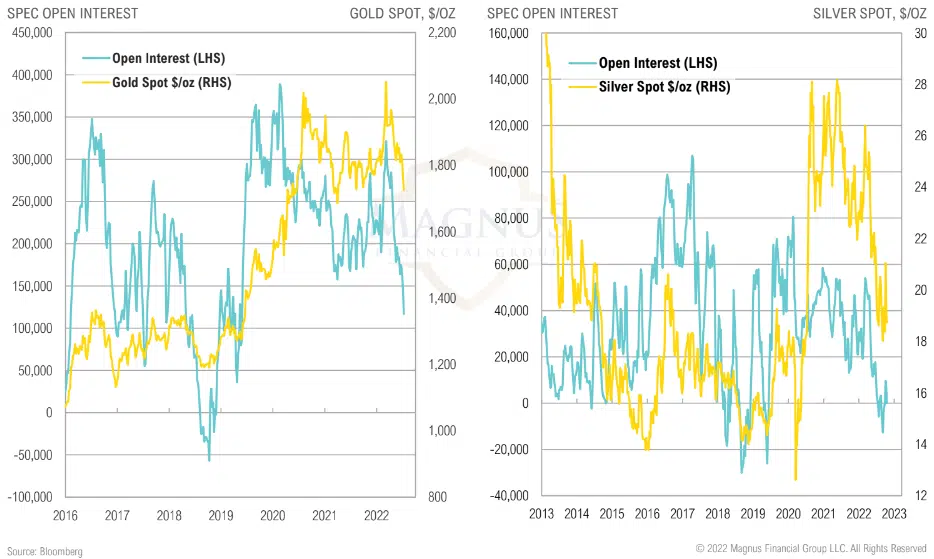
Spec positioning in gold futures suggests markets are nearing capitulation, which has generally resulted in above-average forward returns
Insurance-linked securities was the worst performing opportunistic asset class in Q3 as hurricane Ian threatens heavy losses; global macro is the only positive asset class YTD
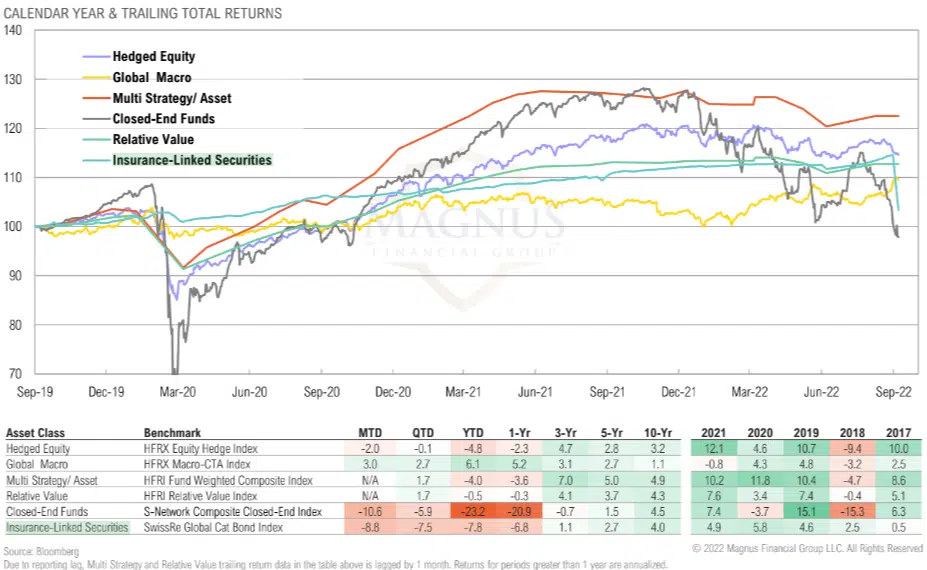
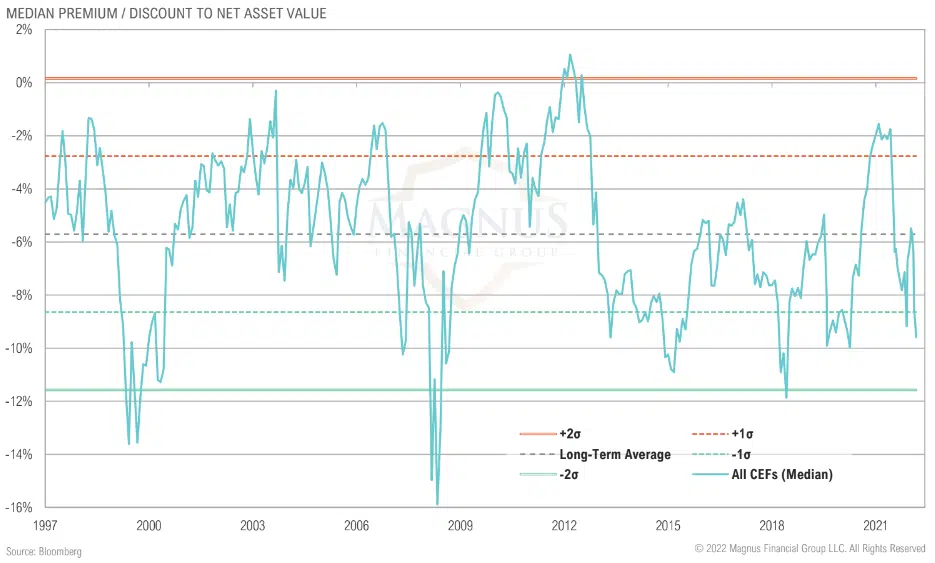
CEF discounts have widened significantly from -6.4% in August to -9.6% in September; U.S. taxable bonds are trading at widest discount since 2018
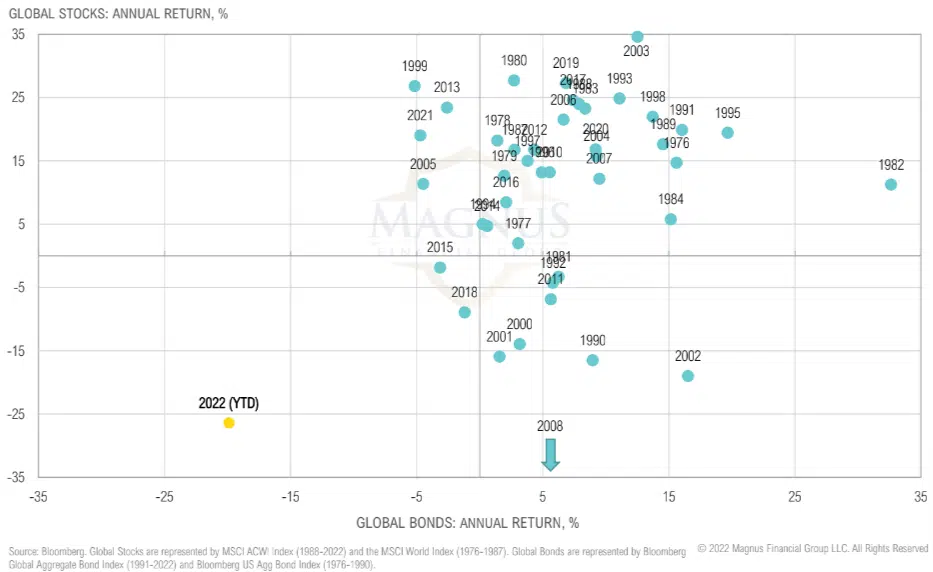
2021 was an unusual year for global stocks and bonds, 2022 even more so; again, highlighting the unusual predicament the Fed is in
Expected 10-year returns for fixed income assets rose substantially as yields continued to rise throughout the quarter
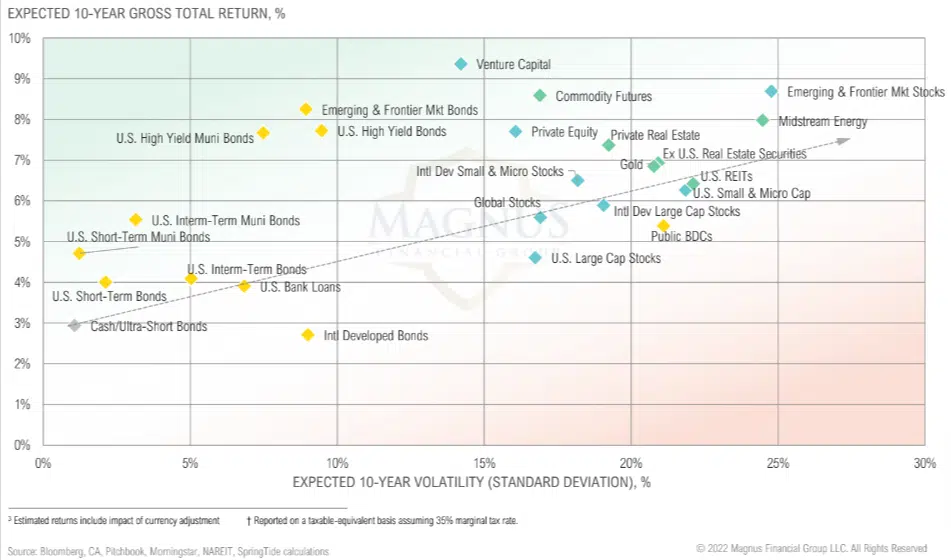
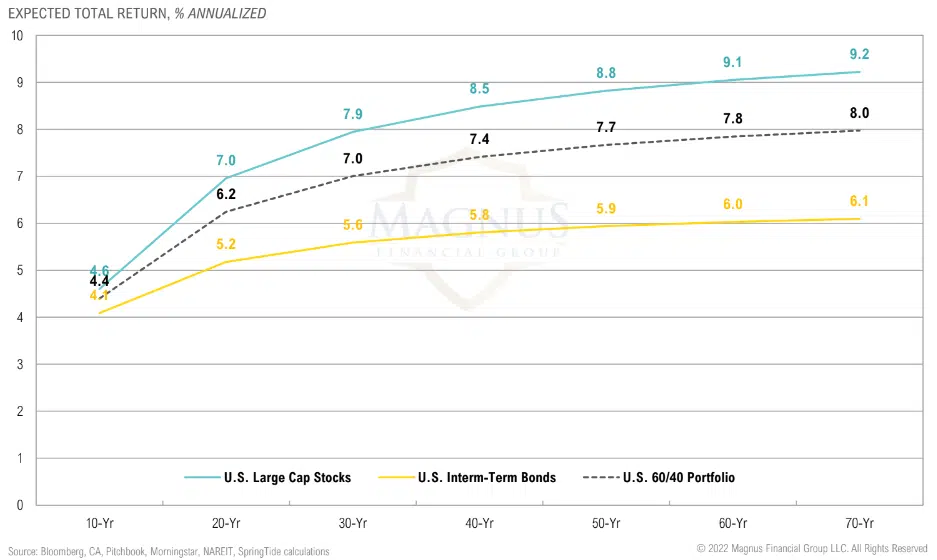
Fixed income returns saw sizable improvements over shorter time periods and now offer similar returns to U.S. Large Cap Stocks over 10 years (pre-inflation, which is big unknown)
Private market interval funds have significantly outperformed their passive investable benchmarks YTD as net-asset-values yet to catch down to reality