SUMMARY
“Active management strategies demand uninstitutional behavior from institutions, creating a paradox that few can unravel. Establishing and maintaining an unconventional investment profile requires acceptance of uncomfortably idiosyncratic portfolios, which frequently appear downright imprudent in the eyes of conventional wisdom.”
– David F. Swensen, American investor and endowment fund manager

Q2, 2021 MARKET REVIEW
Another strong quarter for risky assets, especially real assets, brings balanced portfolios to mid-single digit half year returns

GROWTH, INFLATION & POLICY
“Stocks: all-time highs Home prices: all-time highs Incomes: all-time highs Job openings: all-time high US Core Inflation: highest since 1991 Fed: we need 0% rates through at least 2023 & trillions more in bond buying to boost asset prices & increase inflation.”
– Charlie Bilello, Pension Partners
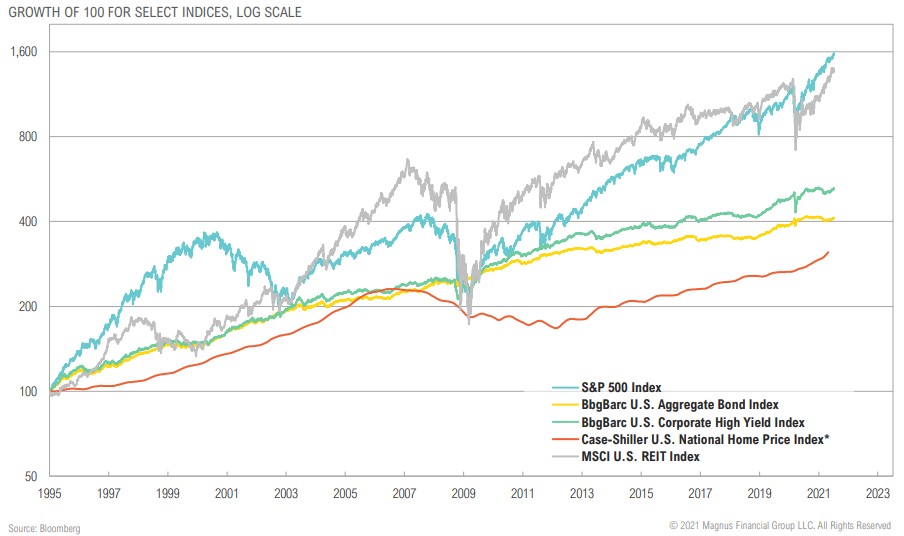
LONG-TERM PERFORMANCE
Key markets at all-time highs with inflation running well above “target” expose the impossible challenge policymakers face

GDP & INFLATION
Growth and inflation both expected to slow, but will remain above average for next several quarters

INFLATION TRENDS
Keep on eye on core inflation if headline inflation, business cost structures, and inflation expectations stay stubbornly high

INFLATION INTERNALS
Transportation, energy and energy related categories have been the primary inflation drivers over the past year

CPI & HOUSING
Owner’s Equivalent Rent (24% of CPI) is now rising following the largest year-over-year increase in housing prices since 2007

U.S. LABOR MARKET
From here, it will take nearly two years to achieve the Federal Reserve’s goal of full employment, assuming a pace of 350,000 additions per month

LABOR MARKET DYNAMICS
Companies getting creative in attempts to attract workers in a challenging labor market environment that is very different from the ‘09-’11 recovery

STIMULUS TRENDS
Voters aren’t just comfortable with further stimulus; they are anticipating it and may expect or demand it in the next downturn

COVID TRENDS
Varied pace of global vaccination rollout creating varied pace of reopening and economic recovery

Where data is available, vaccine rollouts appear to be significantly reducing severe COVID-19 outcomes

International markets have trailed the U.S.; EU and APAC struggled with additional COVID-19 waves while U.S. peaked in January

EQUITY
“There are expected to be more than $1.0 trillion of stock buybacks in the S&P 500 this year – more than all the annual coupon income in the US Treasury, IG and HY markets combined.”
– Lu Wang, Bloomberg Markets columnist
MARKET RETURNS SUMMARY
First half equity returns are already at levels that would represent an above-average full year outcome, especially in the U.S.

VALUATIONS & VOLATILITY
Rapid increase in earnings and earnings estimates leading to relatively stable forward P/Es, maintaining buy-the-dip backdrop

VALUATIONS & VOLATILITY
Relative to earnings estimates, emerging & frontier market stocks are cheapest; relative to sales, U.S. Large Cap stocks appear very expensive

VALUATIONS & VOLATILITY
U.S. large cap valuation premium at a 20-year high, but still a long way from Tech Bubble levels

BUYBACKS
Buyback and dividend yields for U.S. large cap stocks have come down due to the rally in equities and the lagging impact of cuts in early 2020

SPACs
Companies taken public by SPACs have trailed the broader market since February

VENTURE CAPITAL
Pent-up pandemic demand has resulted in strong first half venture activity with several tailwinds expected to continue

PRIVATE EQUITY BUYOUTS
Private equity buyout multiples showing some relative value vs. public equity markets

FIXED INCOME & CREDIT
“I used to think if there was reincarnation, I wanted to come back as the president or the pope or a .400 baseball hitter. But now I want to come back as the bond market. You can intimidate everybody.”
– James Carville, Lead Clinton (1992) strategist and American political consultant
MARKET RETURNS SUMMARY
Decent quarter for all fixed income and credit categories helped mitigate early 2021 losses; high yield bonds leading for QTD and YTD

TREASURY YIELDS & CREDIT SPREADS
U.S. Treasury yield curve has steepened modestly while credit spreads have remained at or near historically tight levels

FIXED INCOME & CREDIT SECURITIES
Treasuries increasingly becoming the largest segment of the now $52 trillion fixed income and credit securities market

SPREADS BY SECTOR
Credit spreads remain near lows of historical ranges with emerging market debt closer to median, but still tight

TREASURY MARKET
The treasury market has been an enabler of increasing deficit spending and debt levels

TREASURY ISSUANCE
Issuance continues to be pushed out as the U.S. Treasury draws down its cash balance

PRIVATE DEBT FUNDS
Private debt off to slow fundraising start in 2021, potentially a sign of a budding opportunity

PRIVATE CAPITAL FUNDS
Private debt funds are their lowest proportion of private assets since the GFC, also potentially a sign of an opportunity

REAL ASSETS
“When you look at real interest rates on long-date Treasuries, it looks like Jimmy Carter area. We’re talking about the CPI at 5.4%, and if we want to use the 10-year Treasury it’s not even at 1.4%, that’s a negative 4% interest rate. That’s Jimmy Carteresque.”
– Jeffrey Gundlach, DoubleLine Capital CEO, July 15, 2021
MARKET RETURNS SUMMARY
Real assets had another strong quarter even with recent pullback as the inflation trade starts to get questioned

YIELDS & GOLD POSITIONING
Yields decline across real assets, gold positioning far less bullish as prices declined from August high

GOLD MINER FUNDAMENTALS
Gold miner performance has diverged from fundamentals, producing record level FCF/share and higher FCF yields than the S&P 500

GOLD VS. NEGATIVE YIELDING DEBT & REAL YIELDS
Declining real yields and $15 trillion of negative yielding debt continue to support the gold thesis

CRUDE OIL DEMAND
Crude oil inventories are being drawn down at the fastest rate on record, bolstered by strong demand

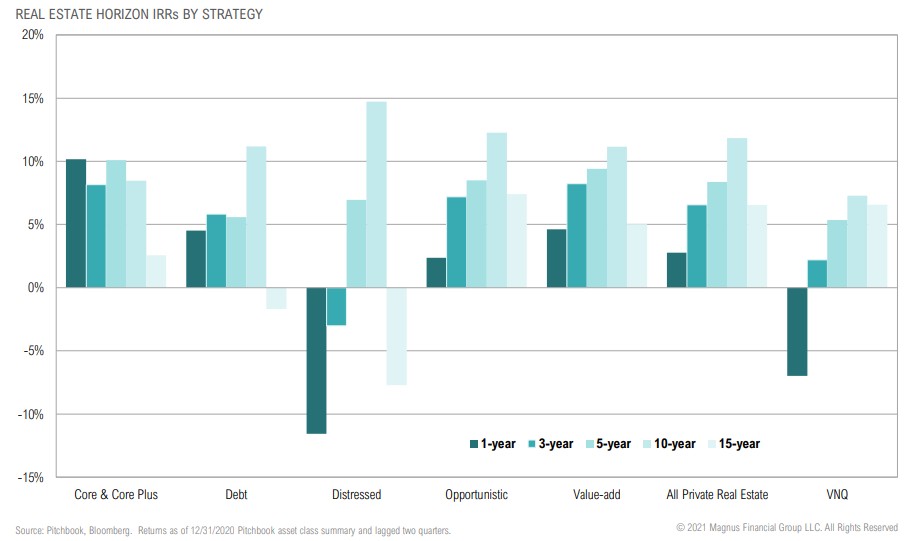
PRIVATE REAL ESTATE PERFORMANCE
Longer-term (lagged) returns for various private real estate markets show the impact of going-in cap rates on subsequent returns

COMMODITIES & ACTIVITY
Activity such as travel and dining at 2019 levels, demand in conjunction with supply chain and labor disruptions driving commodity prices higher

OPPORTUNISTIC
“Thoughtful investors build investment programs on a fundamental understanding of the reasons for pursuing a nonconventional approach.”
– David F. Swensen, American investor and endowment fund manager
MARKET RETURNS SUMMARY
Closed-end funds continued to benefit from broad market gains and narrowing discounts, other asset classes more mixed

RECORD LOW HURDLE/ OPPORTUNITY COST
Low opportunity cost in core U.S. bonds and near record lows for 60/40 portfolio yield

OPPORTUNITY SET
Still high unemployment and need to fund massive deficits will make it hard for policymakers to take their foot off the gas

CLOSED-END FUNDS
CEF Discounts Have Continued to Narrow, Now >1σ Above Average

OPP MUNI CREDIT
Muni credit sentiment remains elevated, historically associated with lowerthan-average forward returns

ASSET ALLOCATION
“Asset allocation is the tool that you use to determine the risk and return characteristics of your portfolio. It’s overwhelmingly important in terms of the results you achieve. In fact, studies show that asset allocation is responsible for more than 100 percent of the positive returns generated by investors.”
– David F. Swensen, American investor and endowment fund manager
CMEs
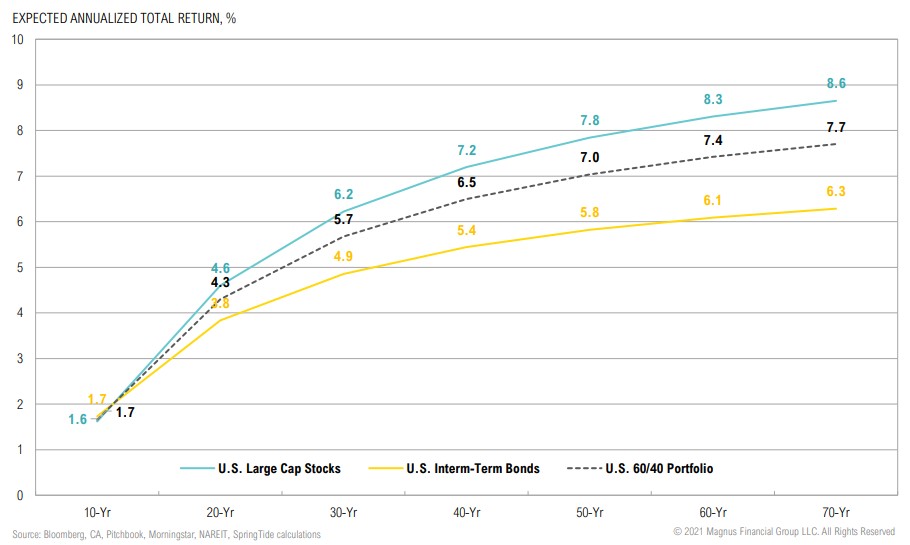
Expected 10-year returns for most risky assets dropped modestly as higher valuations/tighter spreads weren’t offset by higher earnings/yield growth

Longer-term return expectations held relatively stable as the mean reversion of higher valuations is distributed over a longer holding period

INFLATION VS. DEFLATION ASSETS
We expect the multi-decade trend favoring deflation over inflation assets will turn and potentially revert in coming years


