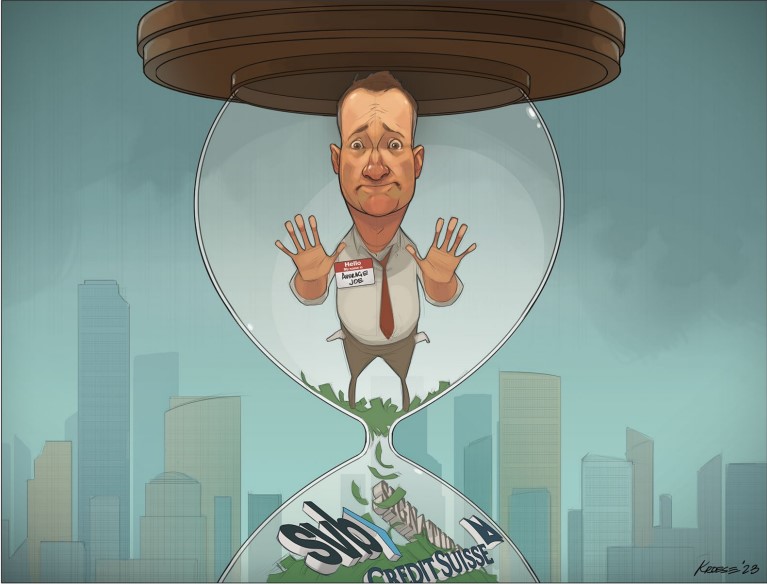
Tick Tock
… with the click of an iPhone, $42 billion left one bank in one day. To give you a sense of the order of magnitude, in the financial crisis of ’08, one bank lost $17 billion in a week, so the rate of withdrawal was 20 times what it was then.
James Gorman, Morgan Stanley CEO
Q1, 2023 Market Review
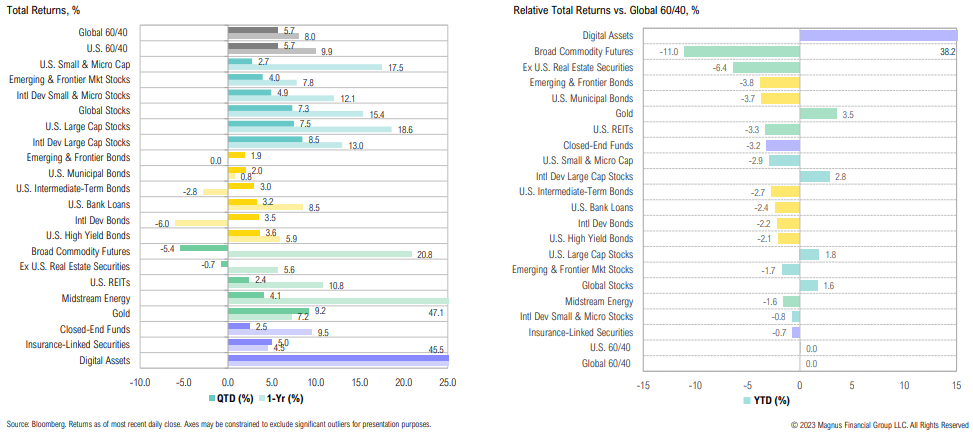
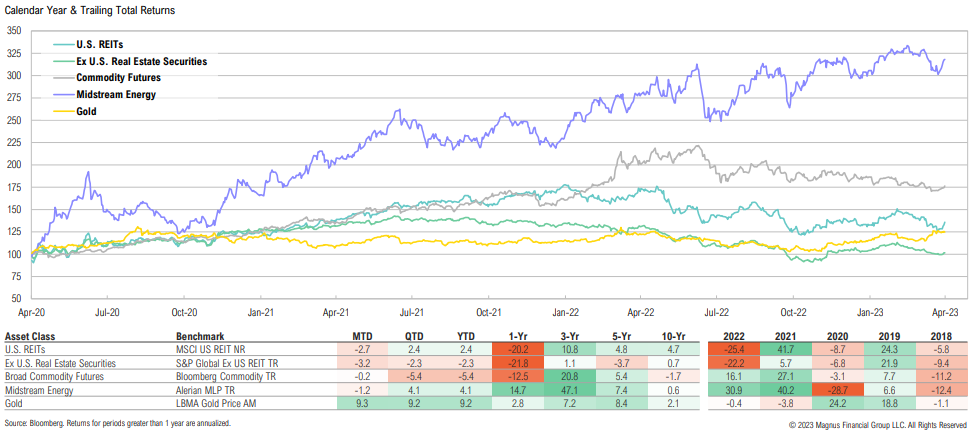
Major outperformers over the quarter included gold and international developed market stocks, while commodities and real estate securities lagged
Summary
Key themes for 2023
Structurally lower real growth – Stop-start inflation, high debt levels, poor demographics and deficits will continue to impede growth in the developed world (U.S., Europe and Japan). In the U.S., the aggressive pace of rate hikes, shape of the yield curve and lending trends (exacerbated by recent banking stresses) suggest an average recession in 2023 is a reasonable base case, but the outlook could be better or worse.
Stop-start, but broadly tighter, policy – Structurally higher, but volatile, inflation underpinned by constrained labor, housing and commodity markets; increased volatility due to stop-and-start policy; markets may be caught between a timid Fed fearful of a 1970s “Burns” error but contradictory and supportive fiscal stimulus given the political climate.
Tick tock for consumer – Poor real income growth and rapidly increasing cost of growing debt pile is leading to the U.S. consumer exhausting COVID stimulus sometime in the Fall. As it stands, there appears to be nothing to replace this lost spending power.
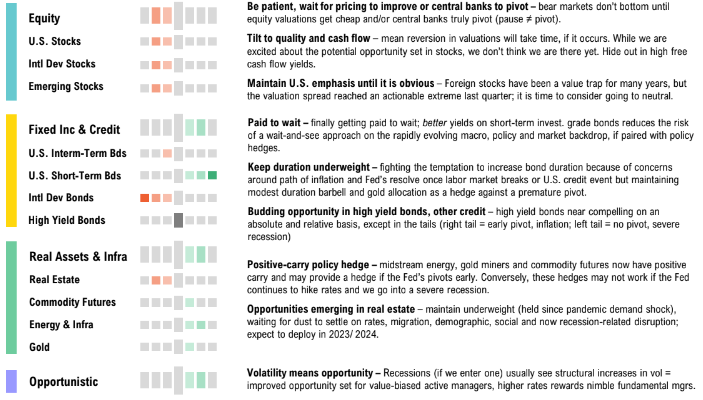
Stay patient and careful – bear markets don’t usually bottom until equity valuations get cheap and/or central banks pivot (pause ≠ pivot); the stock market has never bottomed ahead of official start of recession and recession unlikely to start until labor market cracks. This time may be different, but the macro backdrop is challenging enough to err on the side of caution..
Tilt to quality and cash flow – The key lesson from prior bubble unwinds is patience. While sentiment is poor and there are pockets of cheap assets, absolute and relative valuations for headline U.S. equity benchmarks are substantially higher than prior market bottoms. We prefer to “hide out” in areas with strong balance sheets and higher cash flow yields (quality, dividends) in order to be in a position to take advantage of better prices if we get them.
Moving to neutral for U.S./non-U.S. – Foreign stocks have been a value trap for many years, but the valuation spread reached an actionable extreme late last year and they have since rallied substantially. We are seeing some opportunities but would temper our excitement and employ active management.
Paid to wait – Investors are finally getting paid to wait; better yields on short-term investment-grade bonds reduce the risk of a wait-and-see approach to the rapidly evolving macro, policy and market backdrop, if paired with policy hedges that protect against policymakers ignoring inflation.
Keep duration low – We continue to fight the “temptation” to increase duration because of (a) concerns around the path of inflation, (b) the Fed’s resolve once labor market breaks or we have another credit/financial stability event, however, we are maintaining modest duration barbell and a gold allocation as a hedge against premature pivot.
Budding opportunity in high yield bonds, other credit – High yield bonds got close to a compelling level on an absolute and relative basis last year, except in the tails (right tail = early pivot, inflation; left tail = no pivot, severe recession).
Positive-carry policy hedge – Midstream energy, gold miners and commodity futures now have positive yields (carry) and may provide a hedge if the Fed pivots early. Conversely, these hedges may underperform in a severe recession.
Opportunities emerging in real estate – maintain underweight (held since pandemic demand shock), waiting for dust to settle on higher rates, migration/ demographic, social and now recession-related disruption; expect to deploy in late 2023/early 2024.
Volatility = opportunity – Recessions result in structural increases in volatility, leading to an improved opportunity set for value-biased active managers, higher cost of capital rewards nimble fundamental managers.
Opportunity for dynamic asset allocation and active management – We remain extremely excited about the prospects for active management in the years ahead. A period of stop-and-start growth, inflation, policy and trends in asset markets should benefit value-biased dynamic asset allocation over static asset allocations.
Asset Allocation Views
Remain diversified, but tilted towards higher known cash flows (value equities, lower duration bonds)
Will I say there will never, ever be another financial crisis? No, probably that would be going too far. But I do think we’re much safer and I hope that it will not [happen] in our lifetimes and I don’t believe it will.
Janet Yellen, Former Federal Reserve Chair (2017)
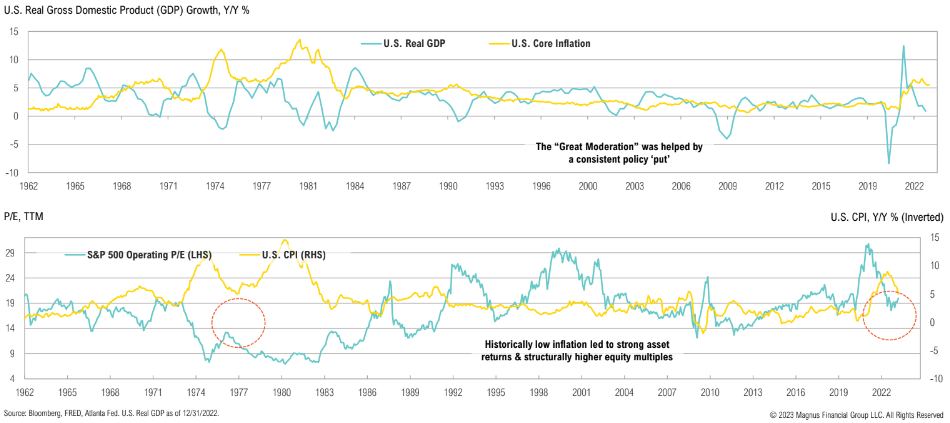
Growth, Inflation & Policy
GDP & Inflation
The Fed’s predicament: tame inflation via recession or risk a 1970s-type resurgence with potentially ruinous consequences for the consumer and markets longer term
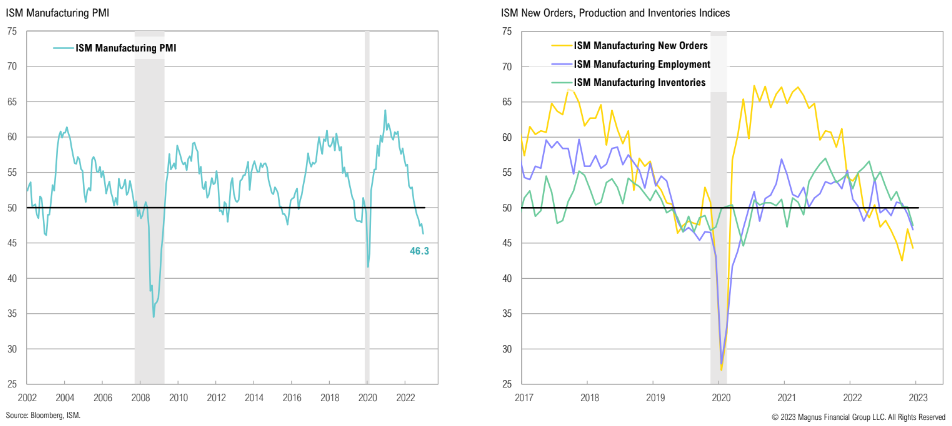
Manufacturing & Inventories
Economic activity in the manufacturing sector has contracted for a 5th consecutive month, with sharp declines in employment and new orders over the quarter
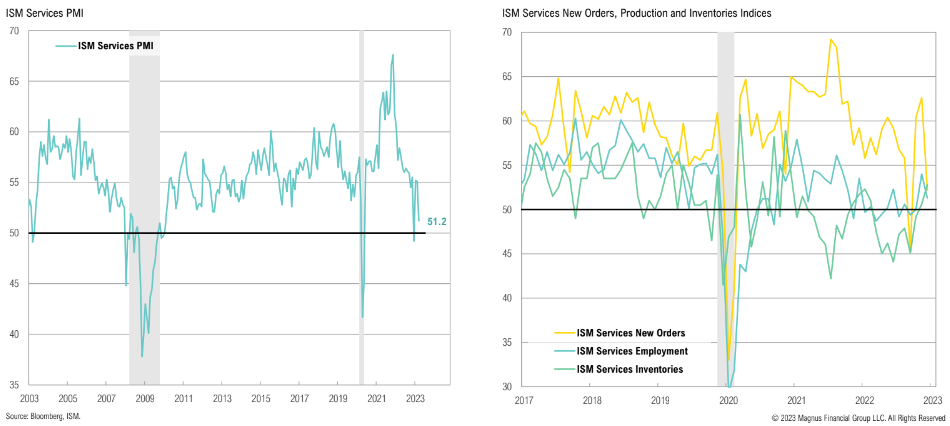
Services & Inventories
While still expanding, services sector activity is starting to show signs of slowing; new orders declined significantly over March, while employment is also moderating
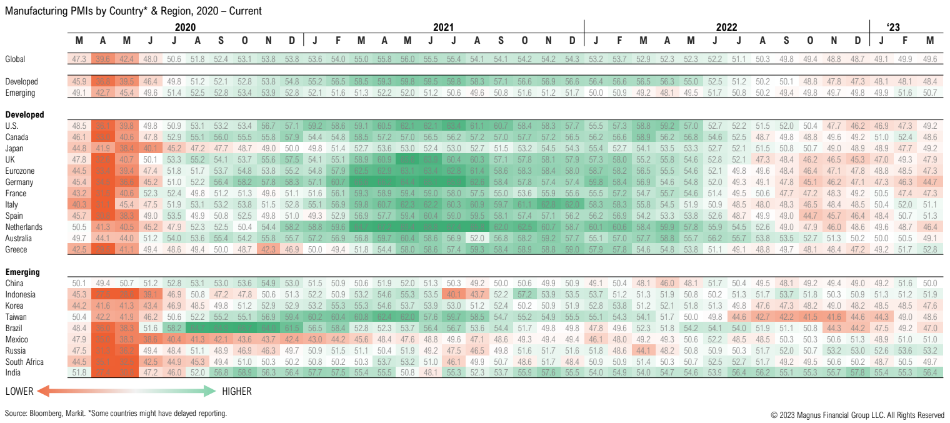
Global Growth
Global PMIs continue to signal a slowdown in manufacturing; global PMIs have been in outright contraction for the last seven months with a few outliers (India, Russia)
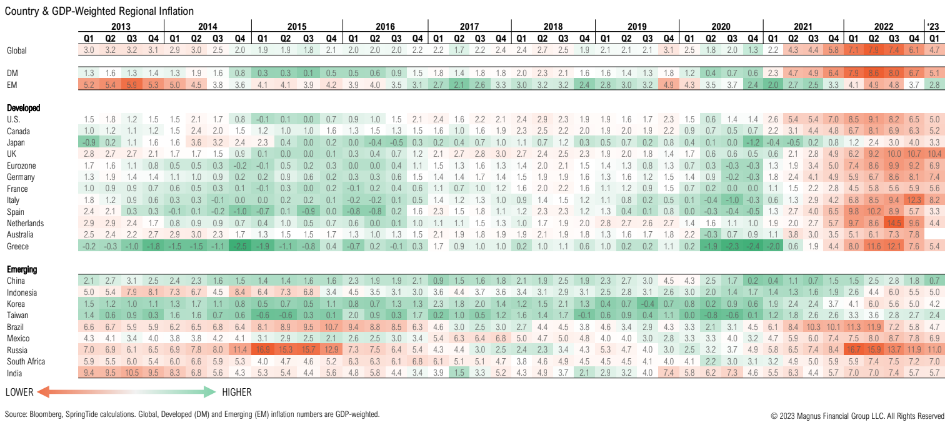
Global Inflation
Stubbornly persistent inflation has eroded recent nominal growth; focus now shifts to how rapidly inflation is rolling over relative to economic growth and impact on consumer
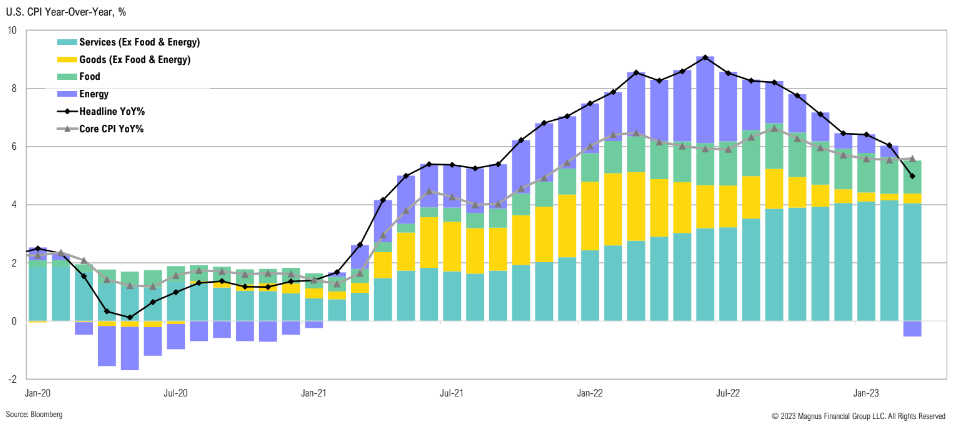
U.S. Inflation
Headline inflation declines largely driven by lower energy prices; core inflation proving more sticky, due to lags in shelter and persistent services inflation
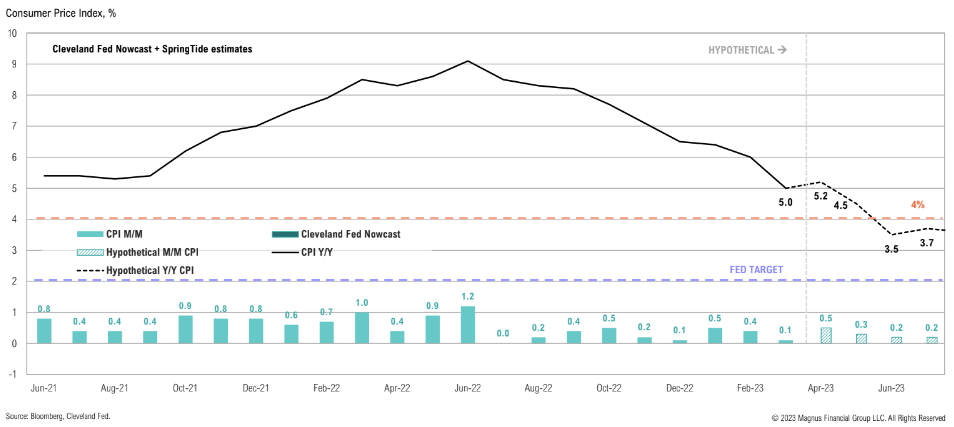
Inflation (CPI y/y) will likely stay above 4.0% through the middle of the year and is unlikely to reach 2.0% by year-end without outright deflation in the second half of the year
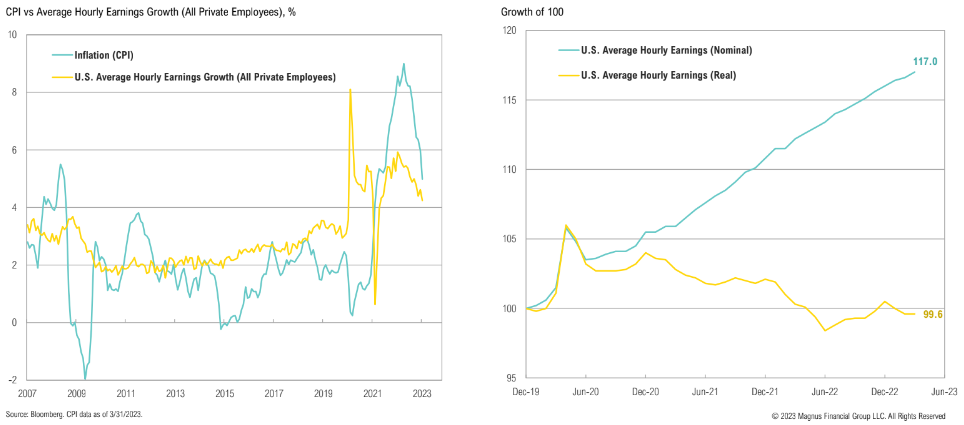
Real Earnings
Since early 2021, inflation has outpaced wage growth, eroding real household disposable income; while inflation has started to roll over, so too have nominal wages
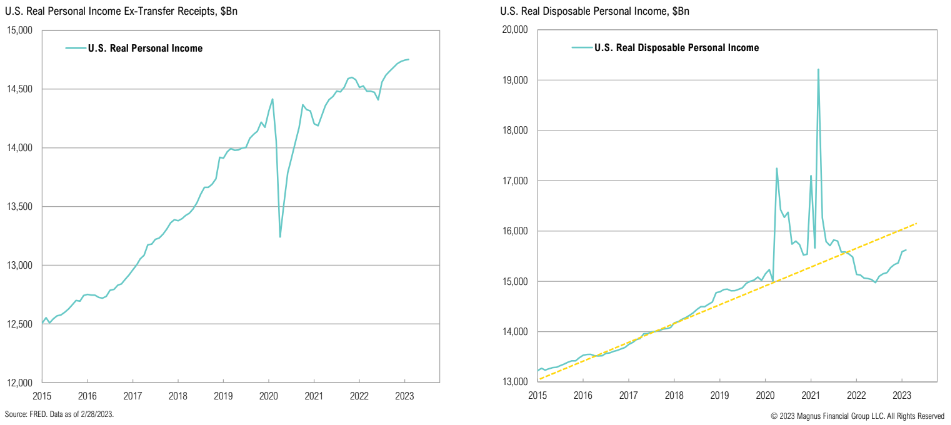
Personal Income
Real income, excluding government transfers, is still grinding higher; total disposable income, however, continues to tread water
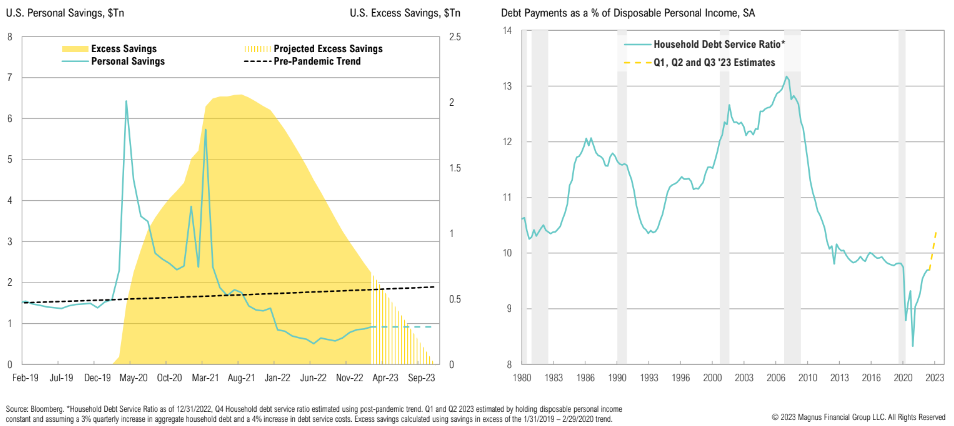
Personal Savings & Debt Payments
While still below the 5-year pre-COVID savings rate of 7.6%, personal savings rates have started to recover, now at 4.6%; if this savings rate continues, excess savings will be depleted by November ‘23
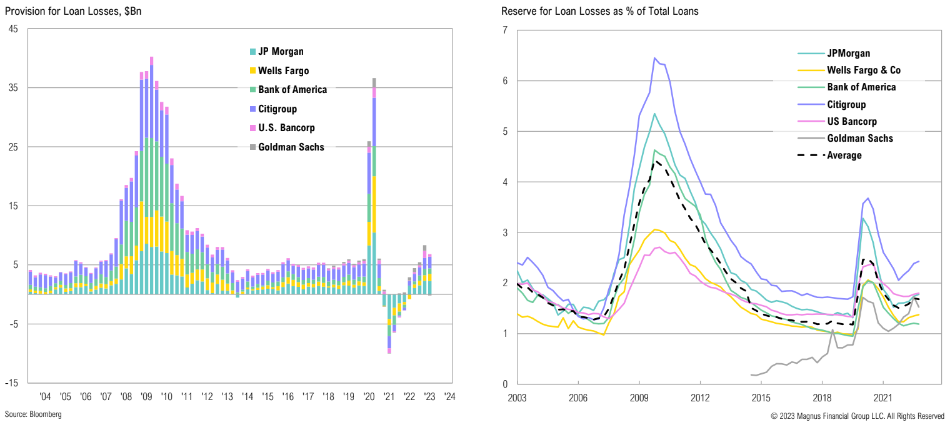
Loan Loss Provisions
While large banks have increased their provisions for loan losses, they remain well below GFC and COVID highs
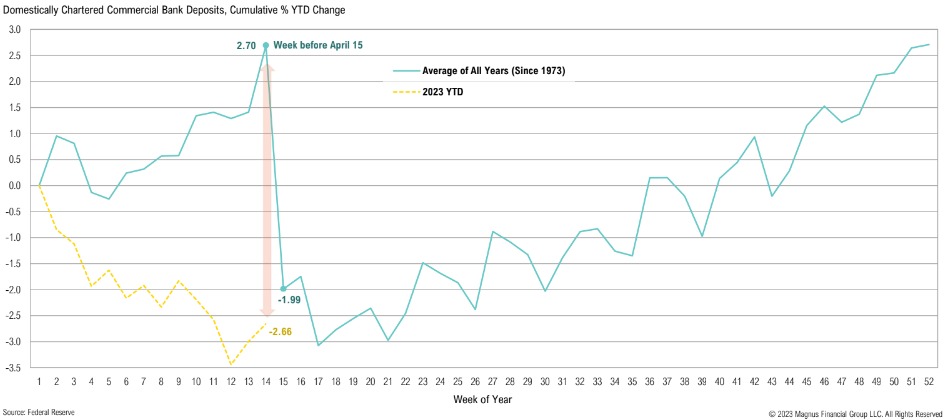
Bank Deposits
Commercial bank deposits substantially lower than normal; recent uptick may be misleading given tax season
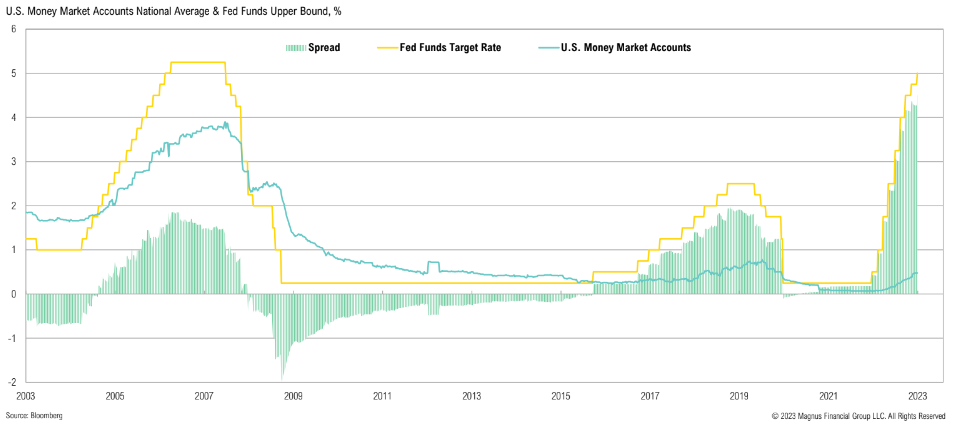
Bank Arbitrage
Big banks lend to the Fed at rates that dwarf what they pay on deposits, benefitting from higher interest rates; these extreme interest rate spreads have contributed to the recent banking system instability
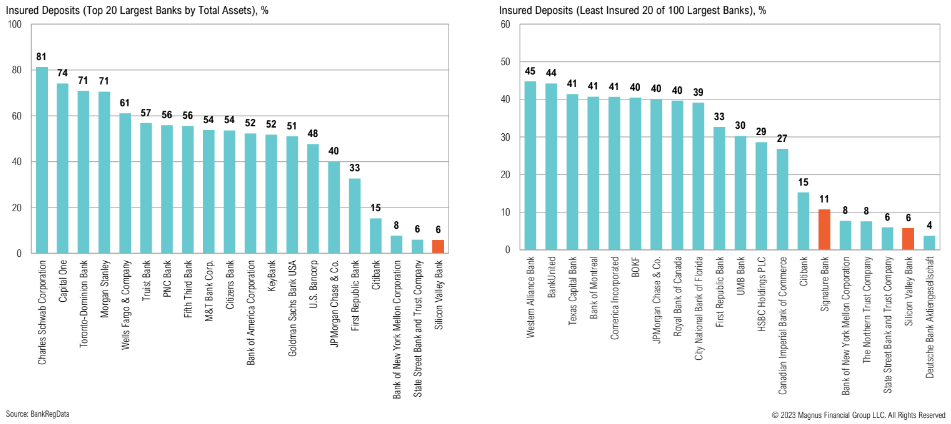
Banks
Silicon Valley Bank and Signature Bank had some of the lowest rates of insured deposits
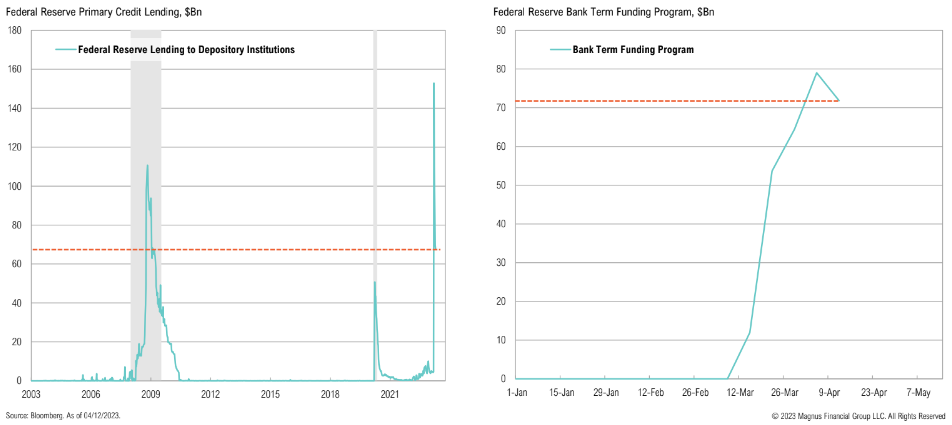
Banks are tapping into the ‘lender of next-to-last resort’ at record levels; several banks are flashing warning signs of extreme liquidity concerns or low levels of insured deposits, similar to SVB and SB
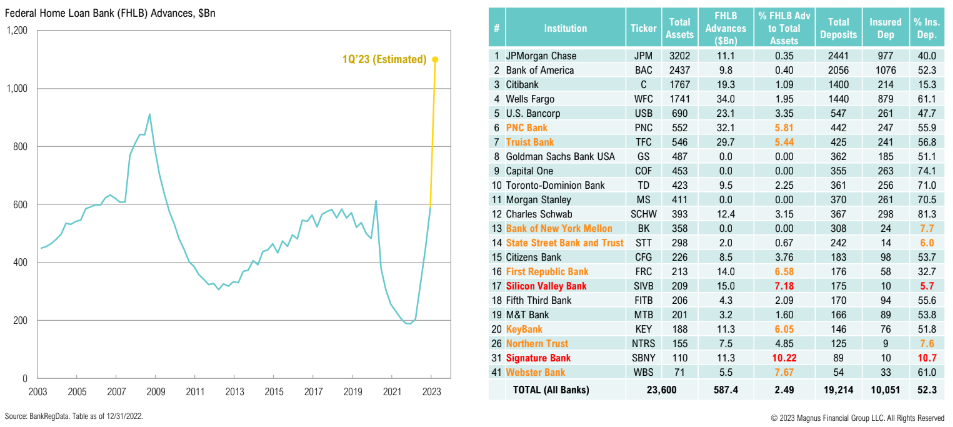
Use of the Fed discount window peaked at >$150bn mid-March, while the new Bank Term Funding Program usage has reached >$70bn as banks continue to rely on the Fed for liquidity
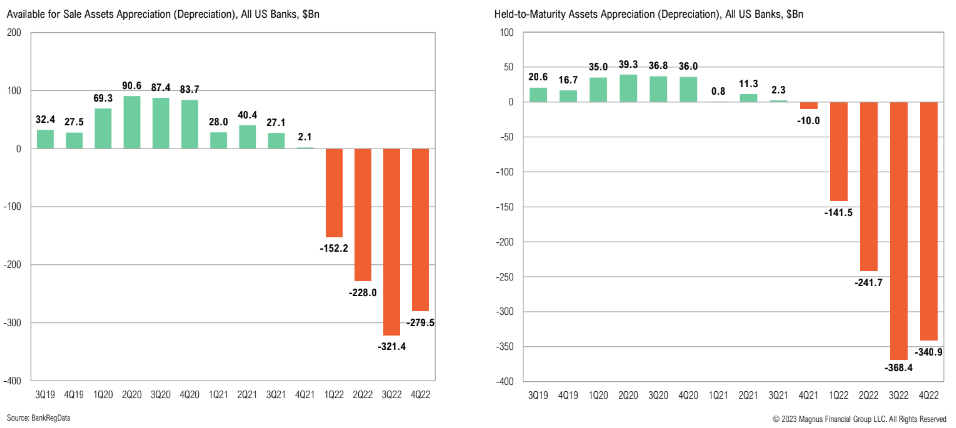
The Fed’s recent rapid hiking cycle has resulted in U.S. bank assets depreciating >$600bn relative to their amortized cost
Commercial Real Estate
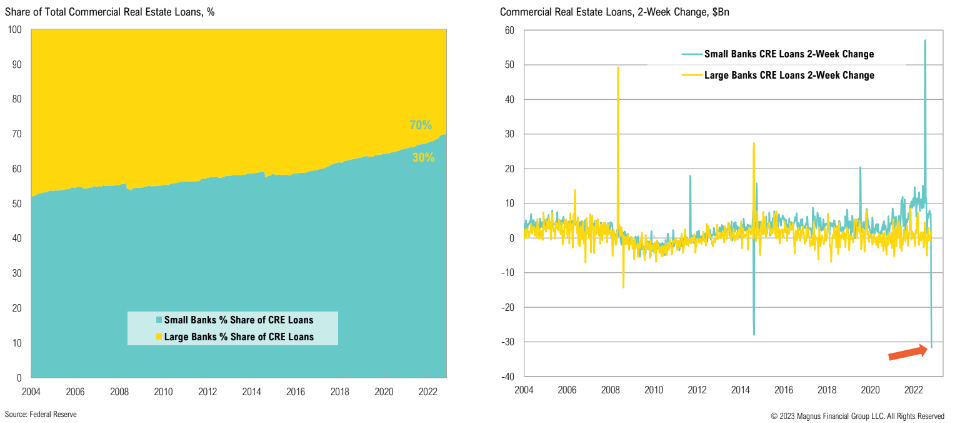
Small banks, which account for most commercial real estate loans, have seen a sharp drop in loans during recent weeks
Office Vacancy Rates
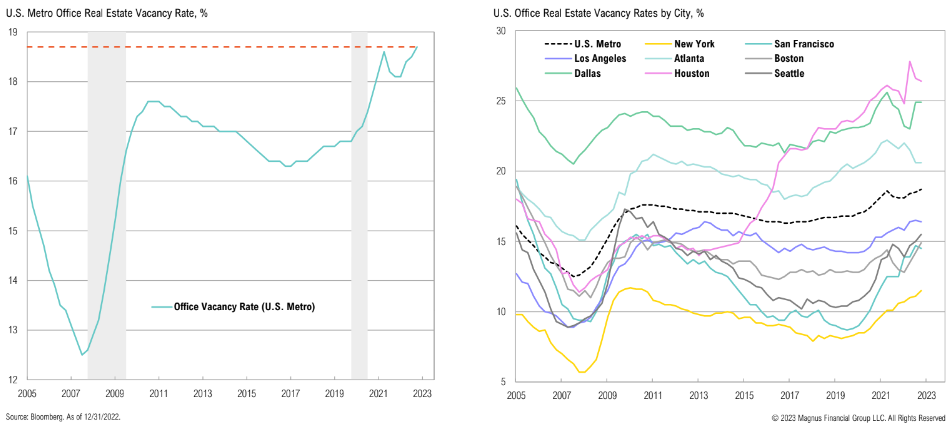
After momentarily recovering post-COVID, office real estate vacancy rates have once again reached new highs
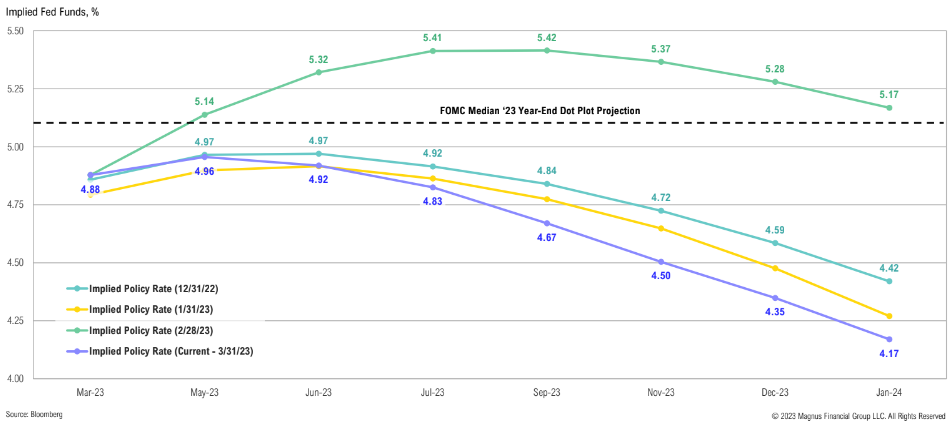
Implied Fed Funds
While the implied Fed funds rate has shifted around substantially throughout the quarter, the market still isn’t buying into the Fed’s ‘higher for longer’ conviction
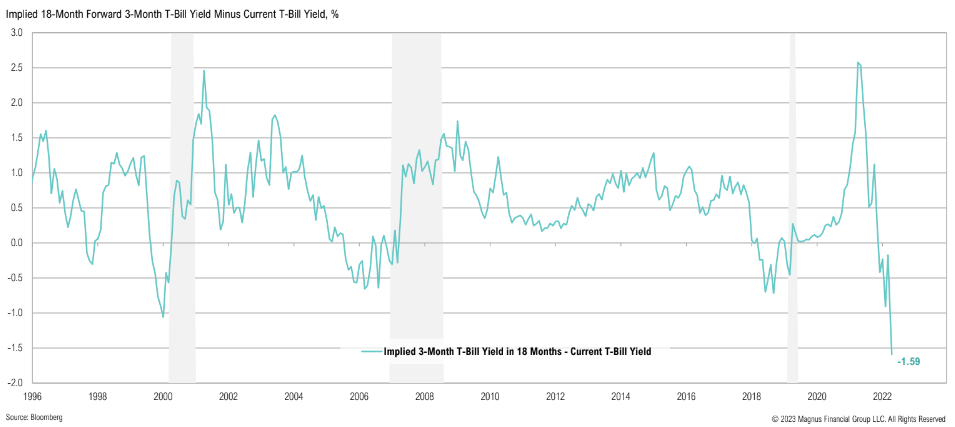
Powell Yield Curve Indicator
The “Powell yield curve indicator” has inverted by 1.6%, which implies the 3-month treasury yield 18-months from now will be 3.3%; excluding current yields, this would be the highest cash return since 2007
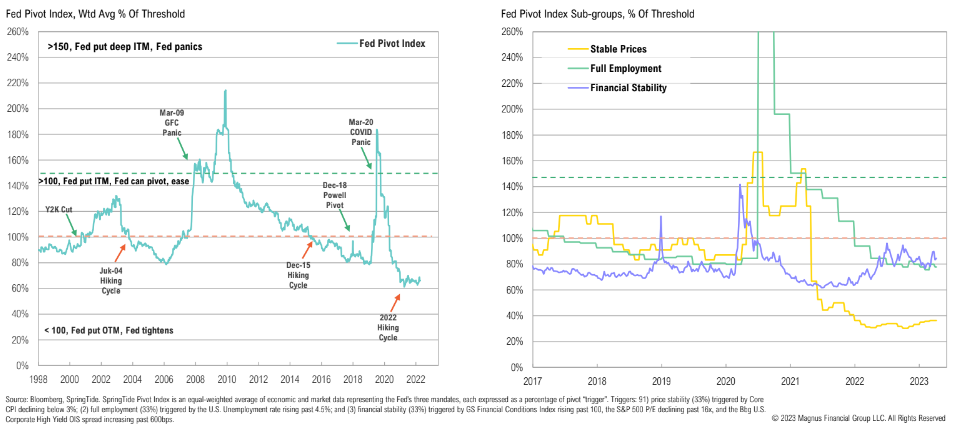
The Fed Pivot Index
A Fed pivot isn’t justified by the data—it would risk extending inflation shock and further eroding the Fed’s credibility, however, increasing banking system stress could cause pivot
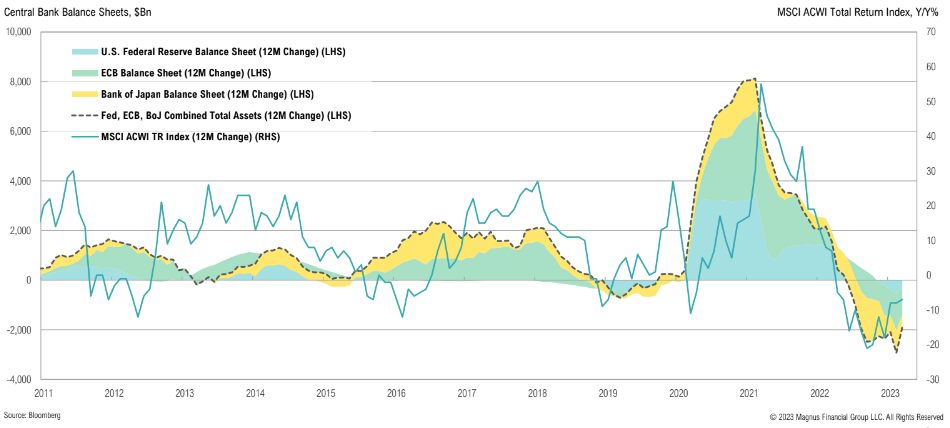
Central Bank Balance Sheets
Fed, ECB and BoJ combined 12-month change in assets have been negative since June 2022 and shows a reasonable correlation to global stock performance
There is this large tray of lasagna that I used to buy that used to cost around $16. Now it’s around $21. That’s my own little measuring stick of how inflation is going.
Neel Kashkari, CEO of the Federal Reserve Bank of Minneapolis
Equity
Market Returns Summary
U.S. large cap stocks underperformed developed market peers over Q1, but outperformed emerging market stocks; U.S. small cap stocks performed worst
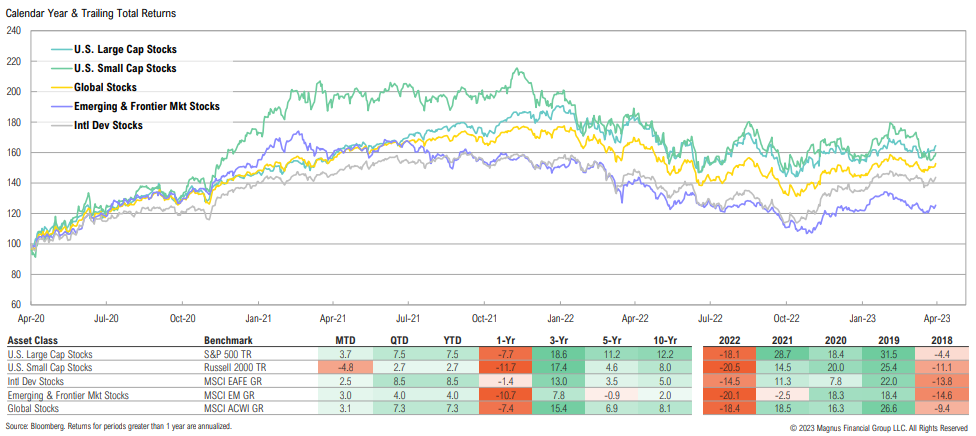
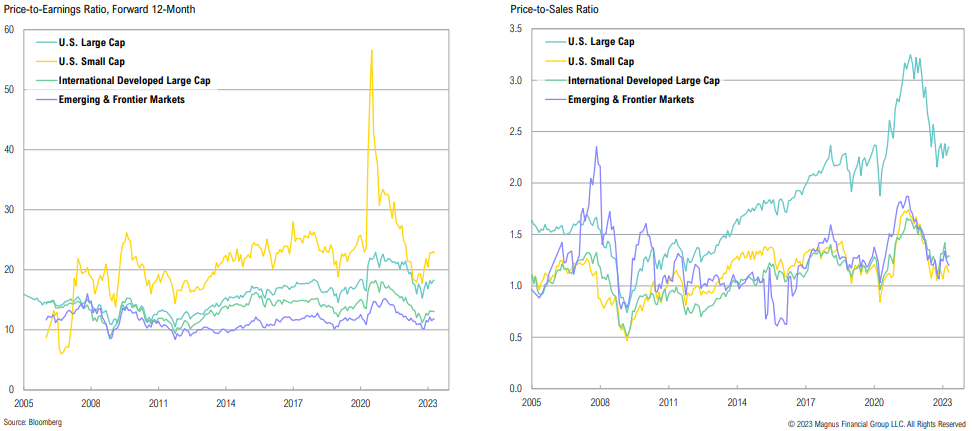
Valuations
Valuations crept higher over the quarter as stocks rallied; emerging market stocks remain relatively cheap vs. developed markets, but ‘value trap’ risk remains if recent growth optimism doesn’t materialize
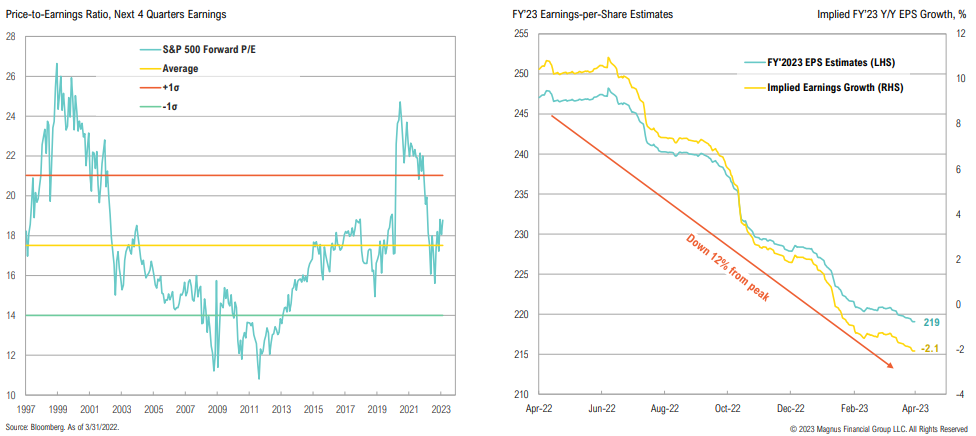
S&P 500 Valuations
U.S. large cap valuations have also moved higher, now above historical average; while earnings expectations have come in, they are only showing a mild contraction over FY’22 which would be favorable for a recessionary year
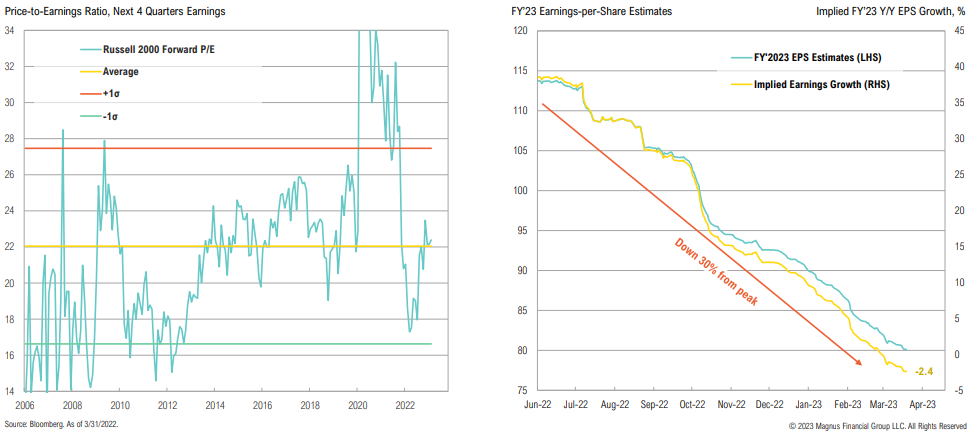
Russell 2000 Valuations
U.S. small cap forward valuations have moved higher, trading just above historical average; focus now shifts to FY’23 earning expectations, which have fallen 30% from ‘22 peak
MSCI EAFE Valuations
Developed international forward valuations also moved higher, now slightly below historical average; FY’23 earnings expectations now imply 10.0% y/y growth
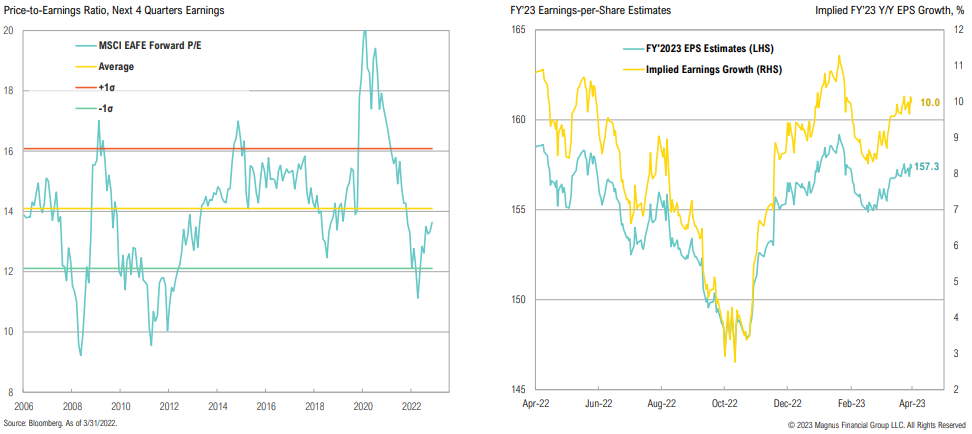
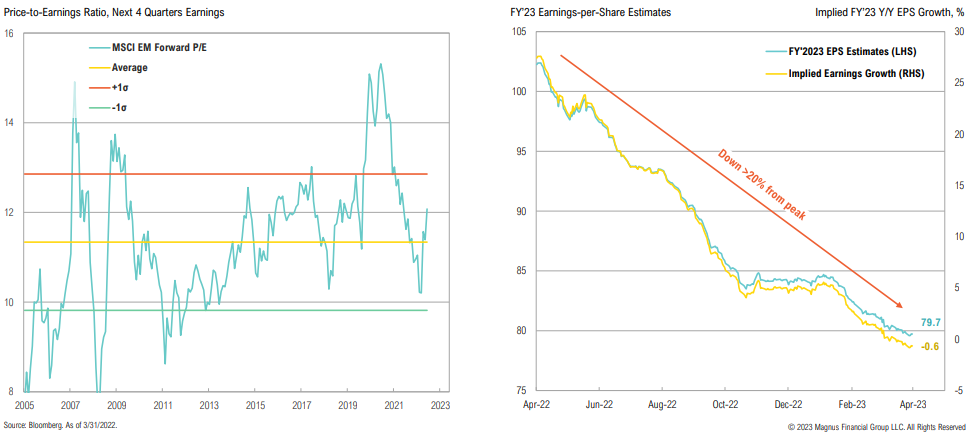
MSCI EM Valuations
Emerging market forward valuations are now above their historical average; earnings expectations continue to trend lower, now imply -0.6% full year EPS growth
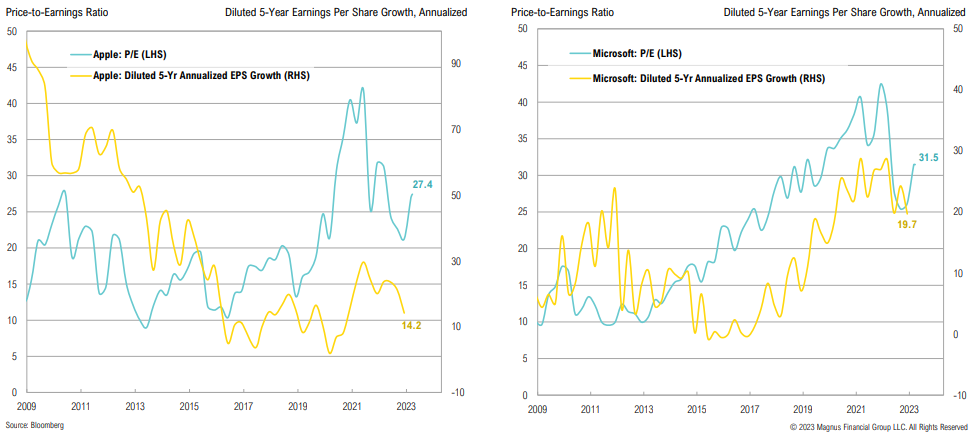
Apple and Microsoft
As investors have crowded into mega cap names they know/trust, they’ve driven valuations back up to prior cycle peaks; we think prices catch down to the rest of the market
S&P 500 Valuations
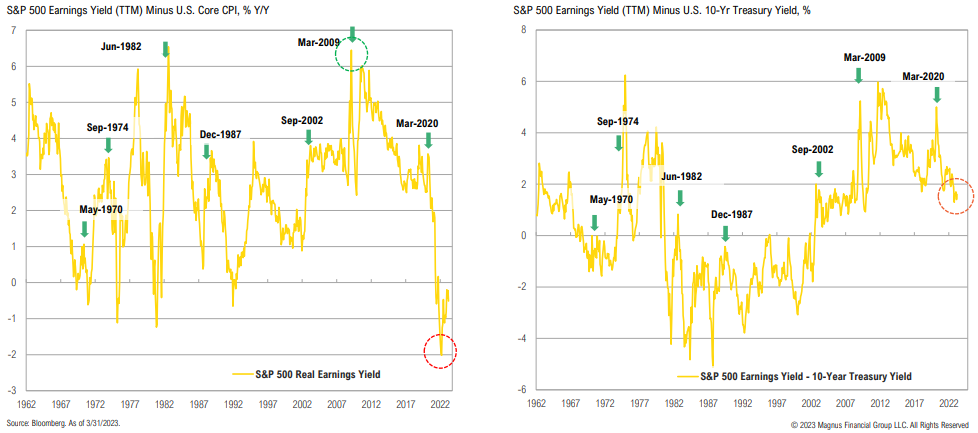
Counter to “it’s all priced in”: adjusting for record-high margins, equity valuations are not compelling
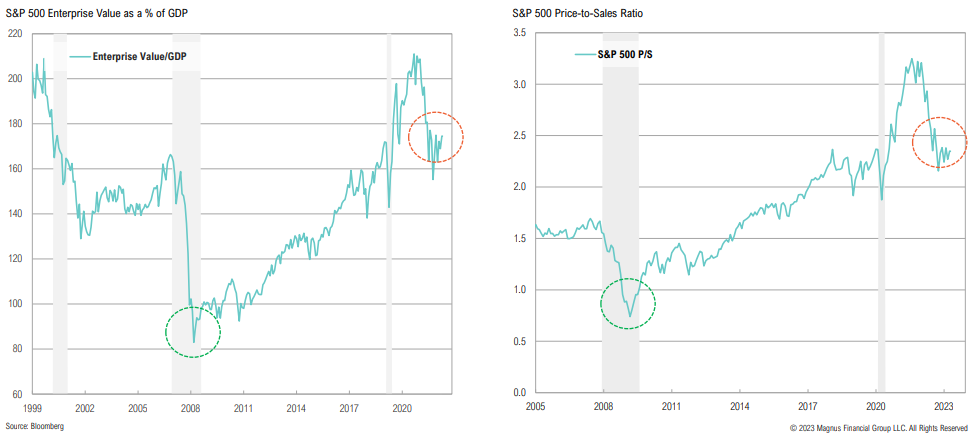
The S&P 500 real earnings yield is still negative, looks nothing like historical bear market troughs (or peaks in earnings yield)
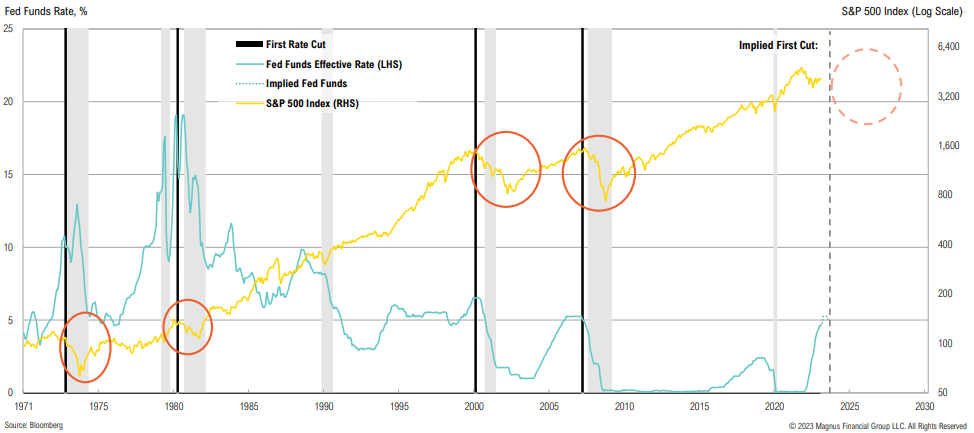
Historical Fed Cuts
The Fed has continued to raise rates; while a pause/rate cut could be on the horizon, history shows that the Fed cutting rates doesn’t necessarily mean pain in the stock market is over
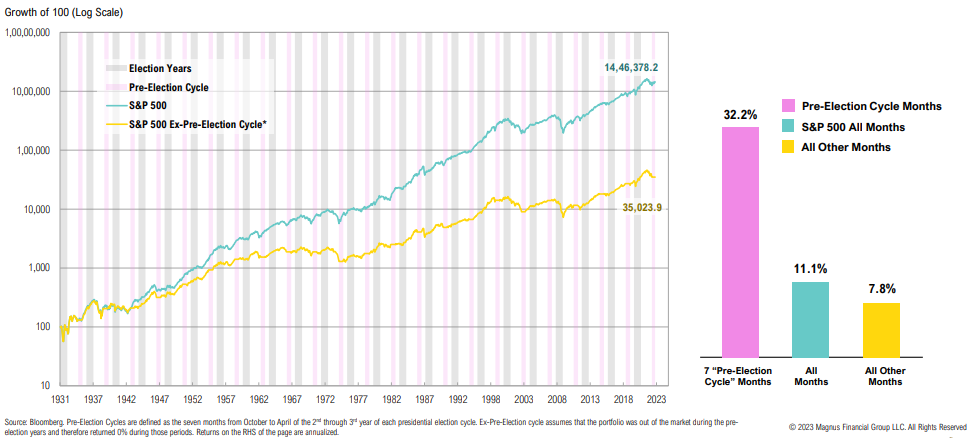
Election Cycles
7 months ending in April of year 3 (this month) of the presidential election cycle are by far the strongest of the cycle; these dynamics end this month
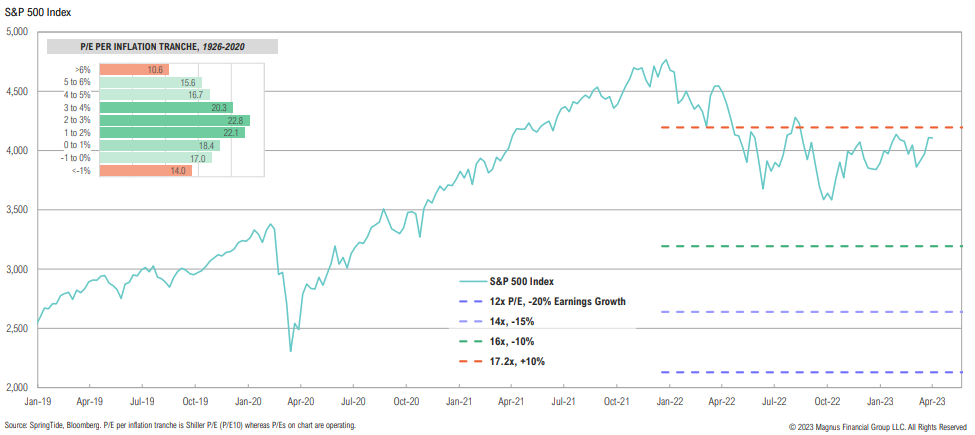
P/E Multiples
Depending on the path of inflation and earnings growth, where might the S&P 500 trend to? Below are 12x, 14x, 16x and 17.2x (LT average) P/Es applied to various EPS scenarios
Mega-Cap Tech
Mega-cap tech stocks, which led the market lower last year, have been the main driver of S&P 500 strength year-to-date; over half the year’s 9% return has been derived by the “big 5”
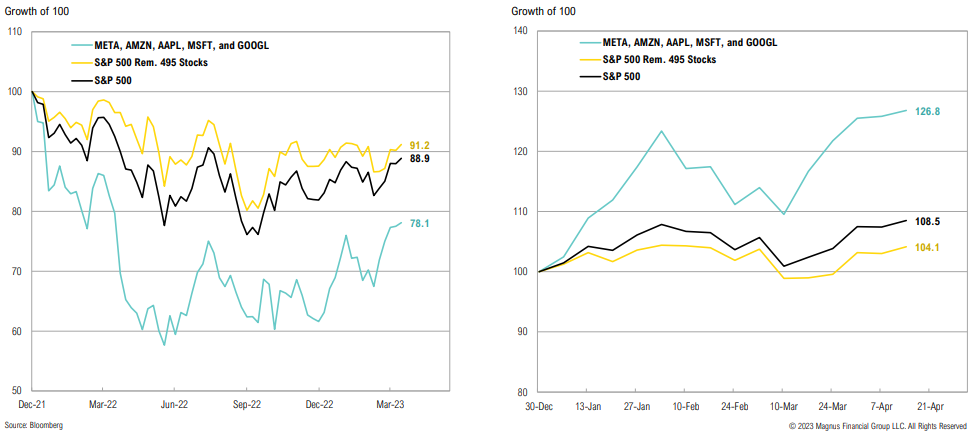
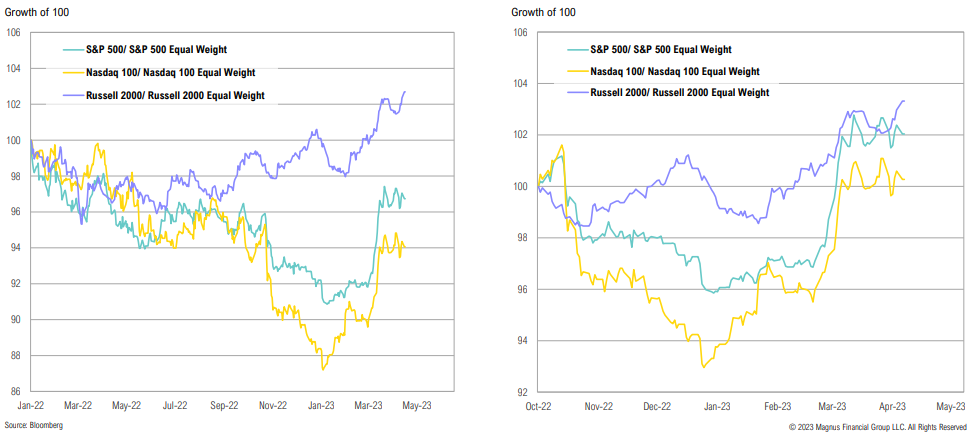
Market Breadth
The breadth of the stock rebound has been poor across large caps, small caps, as well as the tech-heavy Nasdaq, which suggests an unsustainable crowding into names that already weren’t cheap
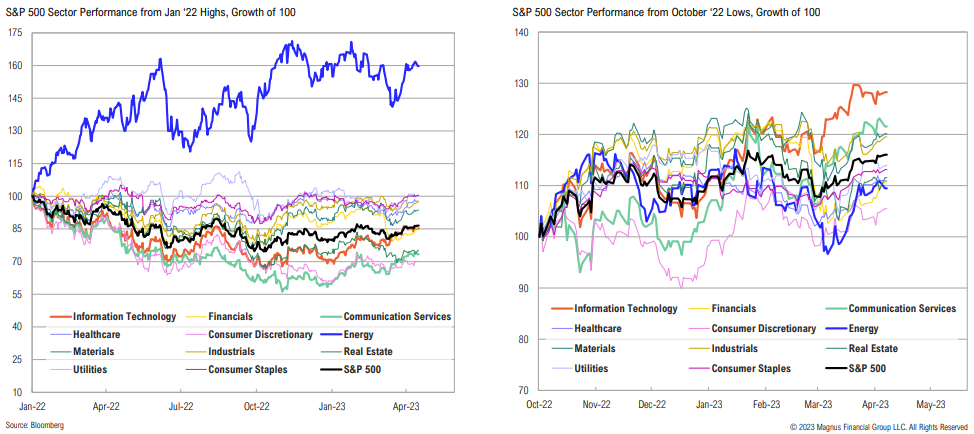
Sector Performance
Communication Services and Tech, which led the market to the downside in 2022, have now led the market to the upside since the October ‘22 low
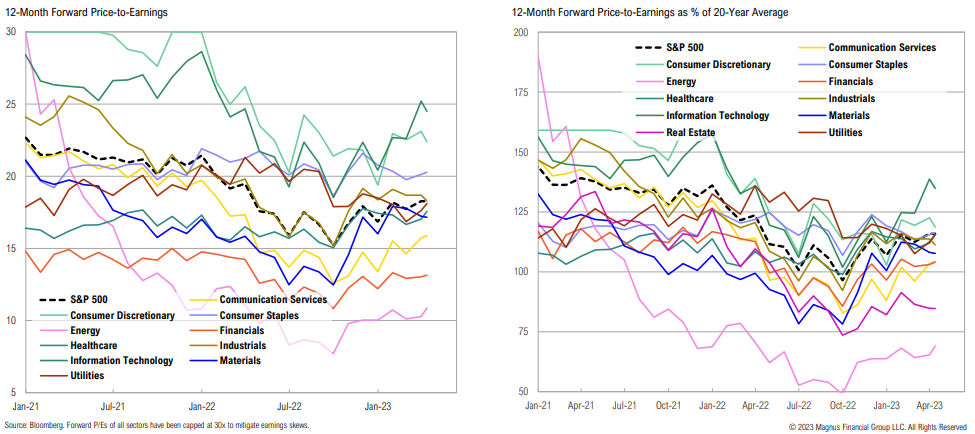
S&P 500 Sector Valuations
Energy and Real Estate are currently the only two sectors which are trading below their 20-year average valuations
Value vs. Growth
Depending on the index considered, S&P 500 valuations look both expensive or cheap; nevertheless, both sets of indices have been highly affected by reconstitutions
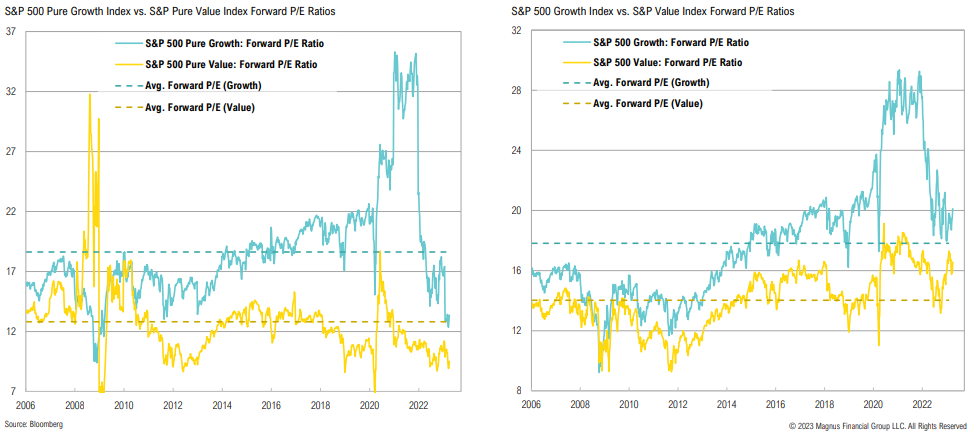
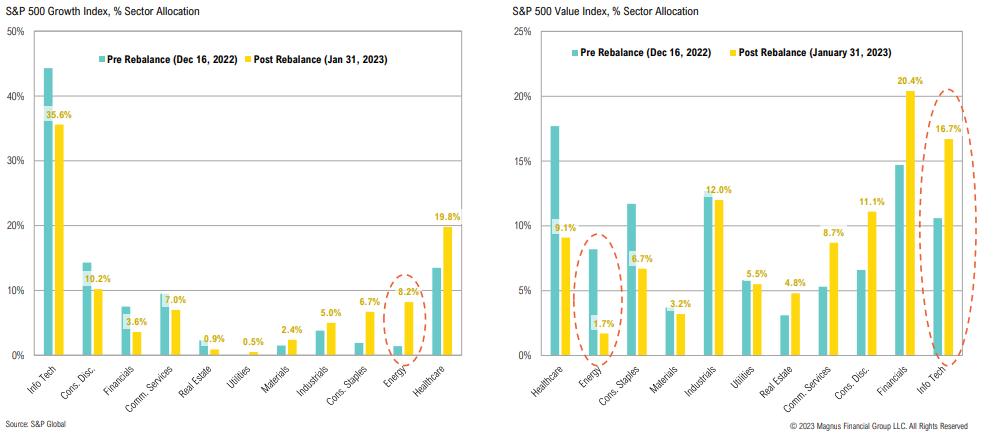
S&P 500 Growth & Value Reconstitutions
Market trends that occurred throughout 2022 have led to significant reconstitutions in the S&P 500 Growth and Value indices; S&P 500 Pure Growth and Value indices have seen even more dramatic constituent changes
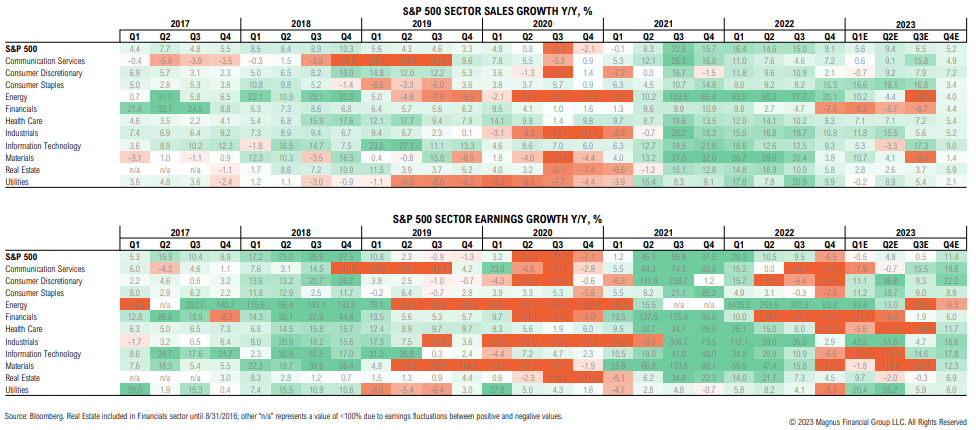
Sales & Earnings Growth
Sales growth expected to decelerate but remain positive for the full year 2023, while earnings growth expected to trend lower for the first 3 quarters, implying margin pressure
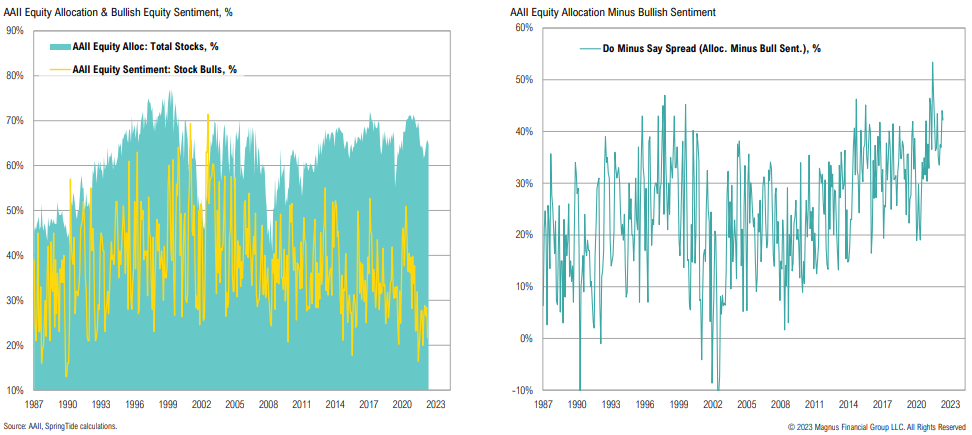
Equity Sentiment
U.S. equity sentiment has been a head-scratcher given structural pessimism, but we continue to believe investors should fade the extremes, try ignore the middle
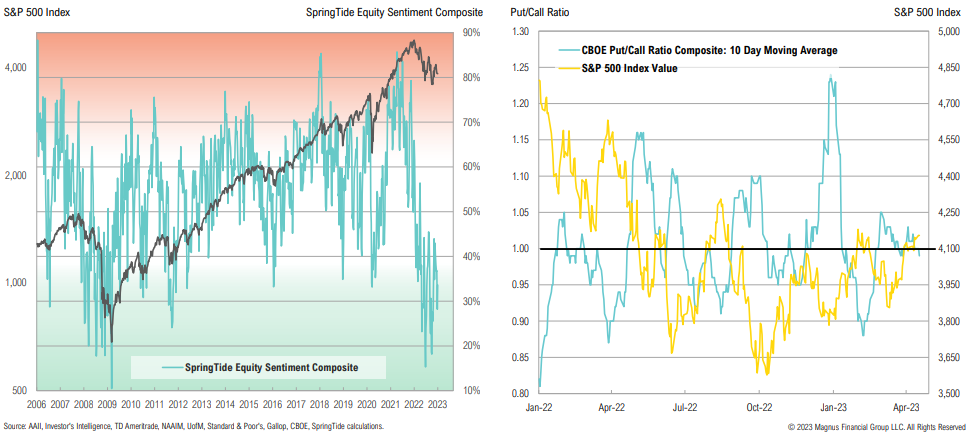
While equity survey-based sentiment is bearish, actual asset allocations don’t confirm; bearish sentiment is relative to structural overweight in stocks
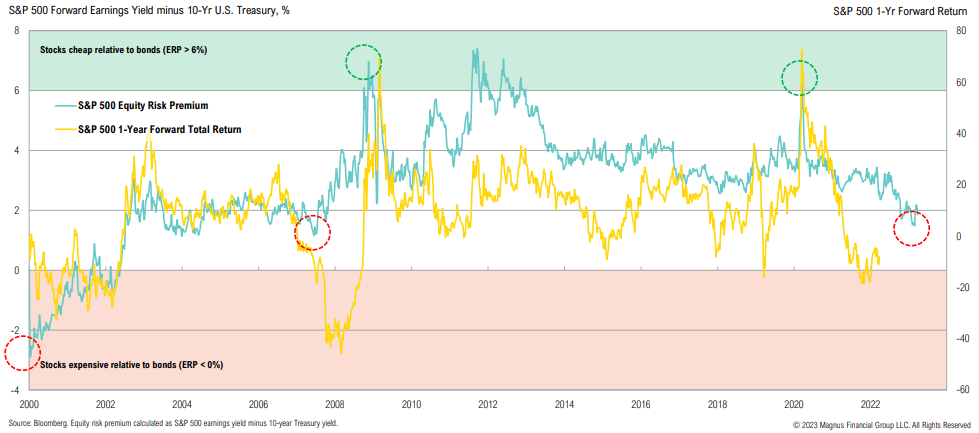
S&P 500 Equity Risk Premium
Despite stocks being well below all-time highs, stocks are less attractively priced vis-à-vis bonds than they were a year ago; in fact, the relative yield on stocks hasn’t been this low since the GFC
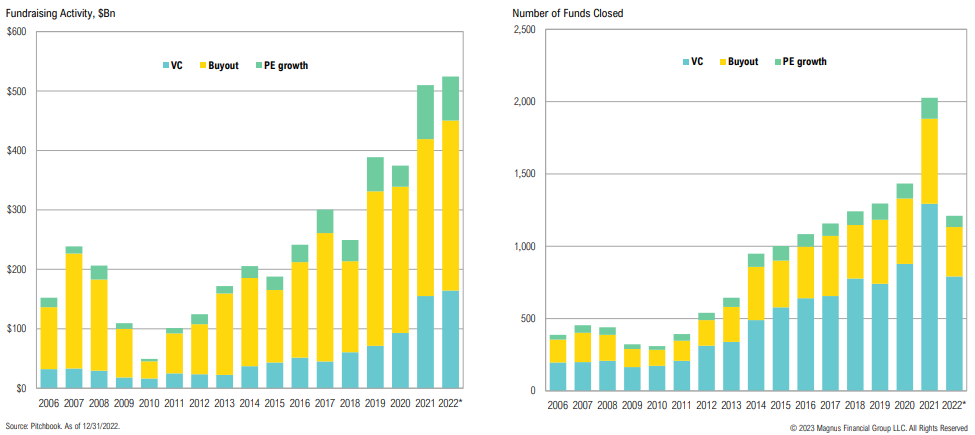
Private Markets
Fundraising was surprisingly strong for private equity in 2022—both buyout and VC reached new highs in amounts raised
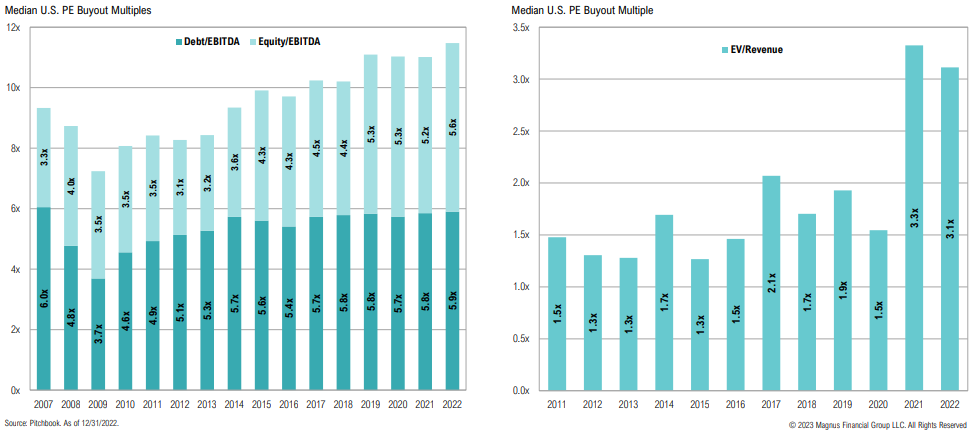
Private Equity
PE buyout multiples continue to creep higher; equity share in new deals is nearly at 50%
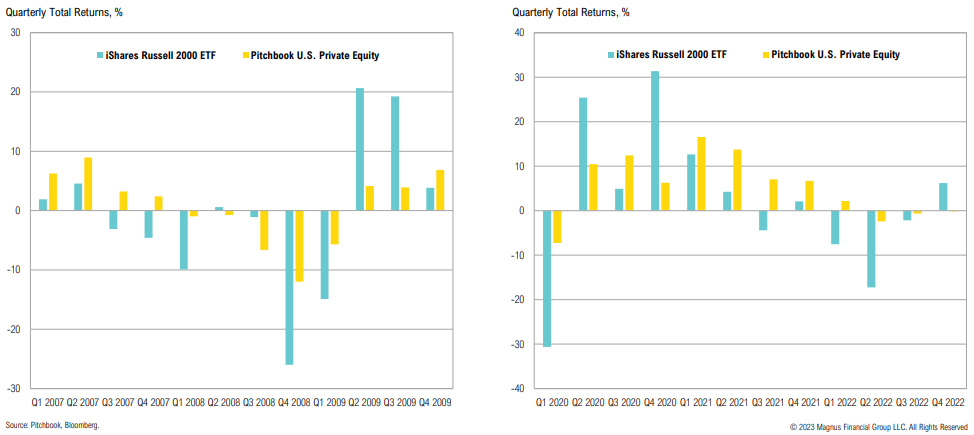
Difficult exit conditions have not impacted valuations thus far; how much longer can funds wait to distribute capital?
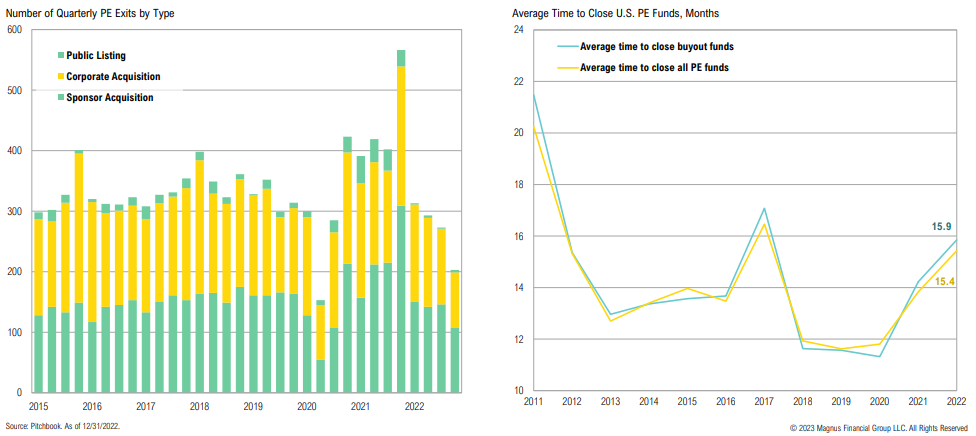
Private equity funds have not marked down their portfolios like they did in the GFC
Venture Capital
While late-stage valuations have come down from 2021 highs, early-stage VC valuations set new highs in 2022

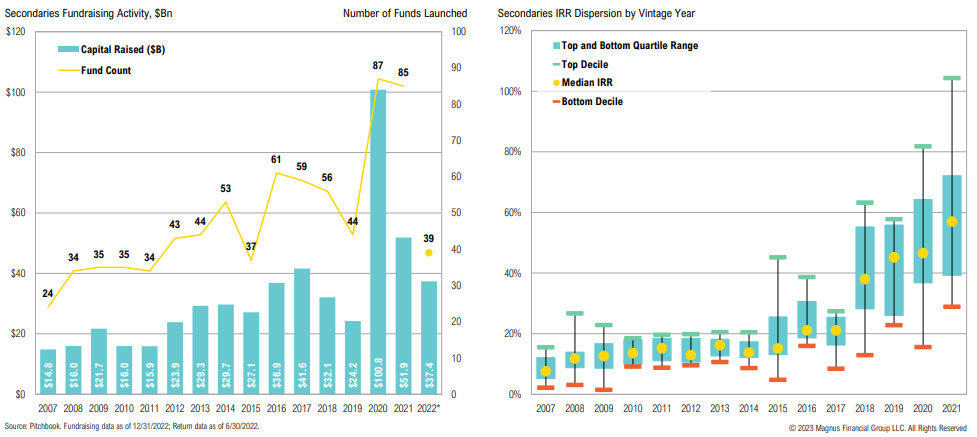
Secondaries Fundraising
After record years in 2020 and 2021, secondaries fundraising fell back to its historical average in 2022
There have been just four days in the past 25 years that have seen yields move by 50 basis points or more intraday. One was in September 2008, and the other three occurred in mid-March this year.
David Solomon, Goldman Sachs CEO
Fixed Income & Credit
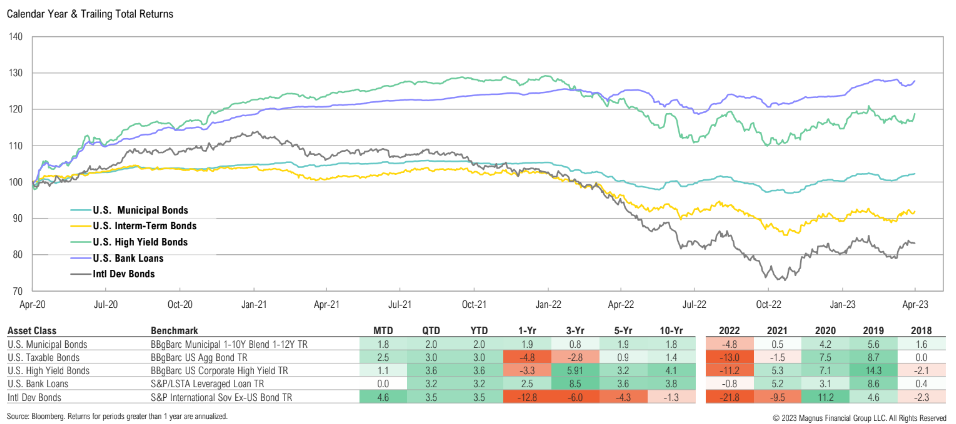
Market Returns Summary
All fixed income & credit asset classes rallied in Q1; U.S. HY bonds performed best; international developed bonds outperformed Treasuries, largely due to the softer dollar
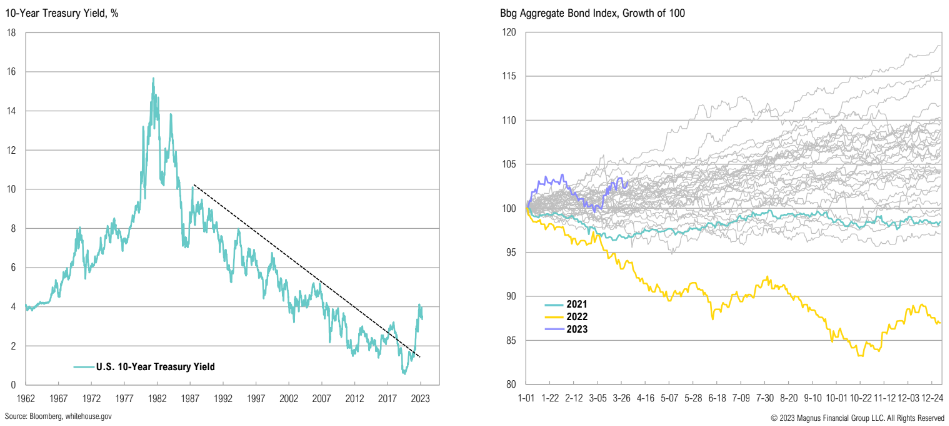
Treasury Market
Context is important for Treasury markets: while we want to be contrarian, we have to consider we’ve entered a more challenging regime for bonds
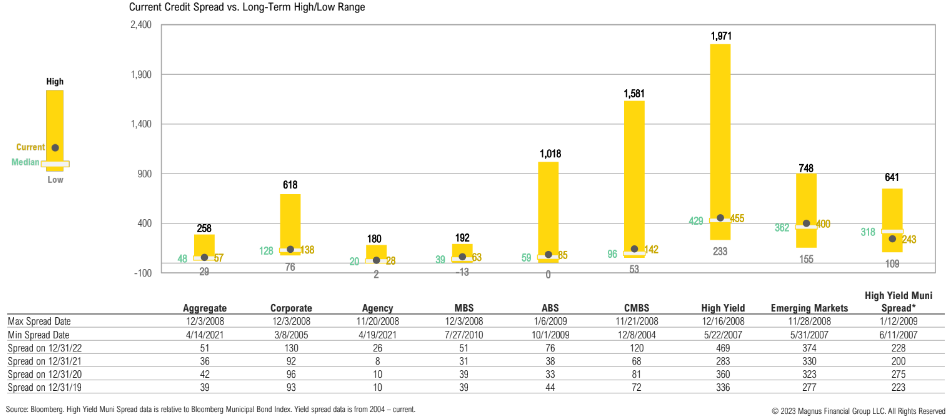
Spreads by Sector
Credit spreads are at or modestly above average across most sectors; while a recession still seems probable, tighter spreads are pointing to a mild/shallow slowdown
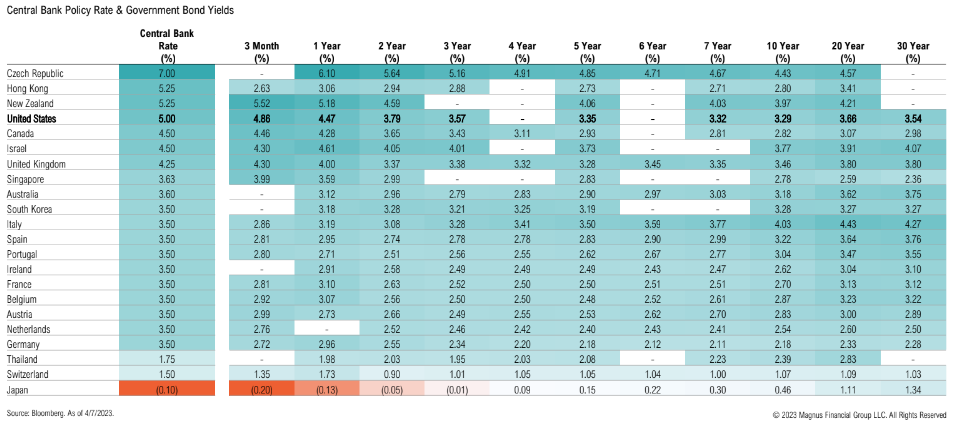
Global Rates
The U.S. bond market remains relatively higher yield, which could help support U.S. fixed income markets and the U.S. dollar
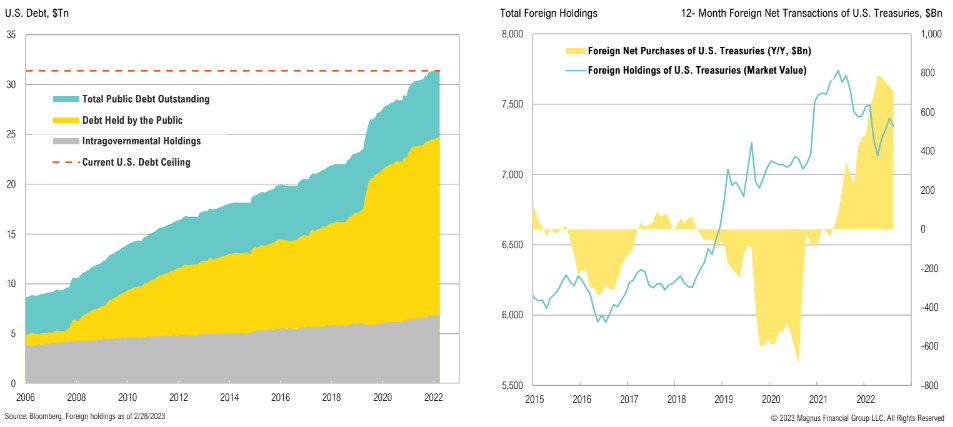
Treasury Issuance
Q1 2023 net issuance was expected to be $932Bn; Treasury cash balance now at $110Bn, $390bn below Treasury’s January projection for the quarter
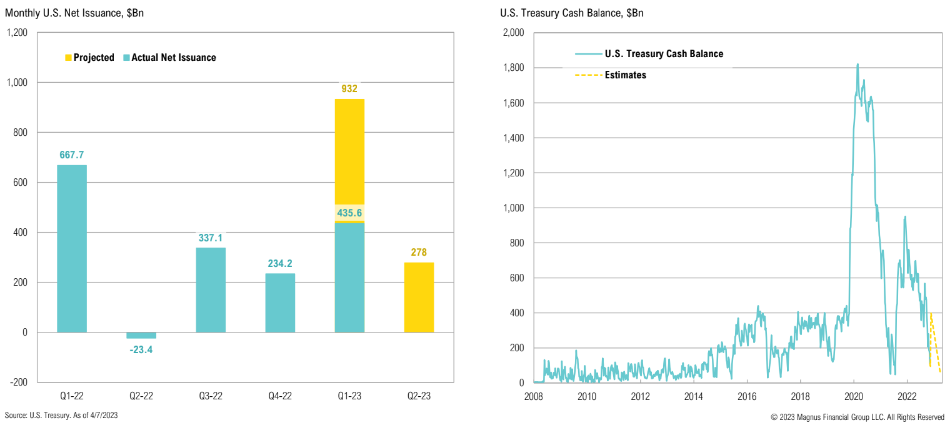
The U.S. officially hit its debt ceiling on January 26th and will need to issue new debt to fund current deficit spending; foreign demand for U.S. Treasuries has been declining over the past few months
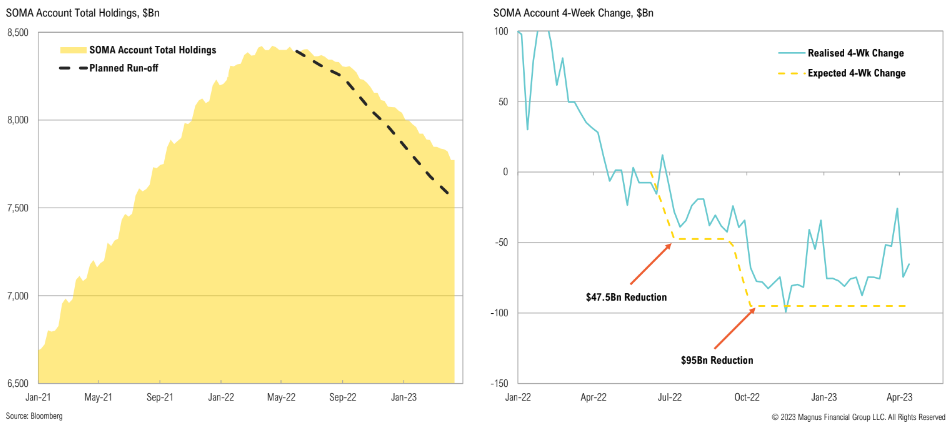
Fed Assets
The Fed has reduced speed of their balance sheet reduction, lagging planned cadence dramatically; SOMA account runoff is currently behind by $235bn
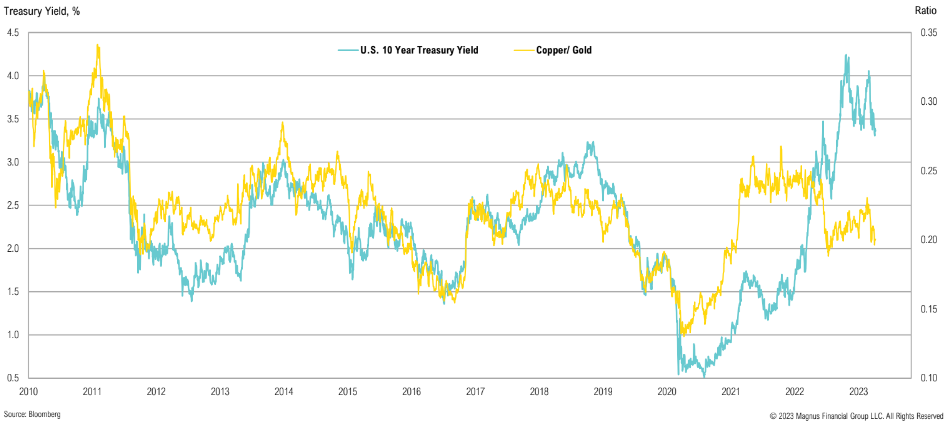
Commodities & The Yield Curve
Collapse in copper/gold ratio—a proxy for the real economy vis-à-vis financial assets—suggests Treasury yields may head lower
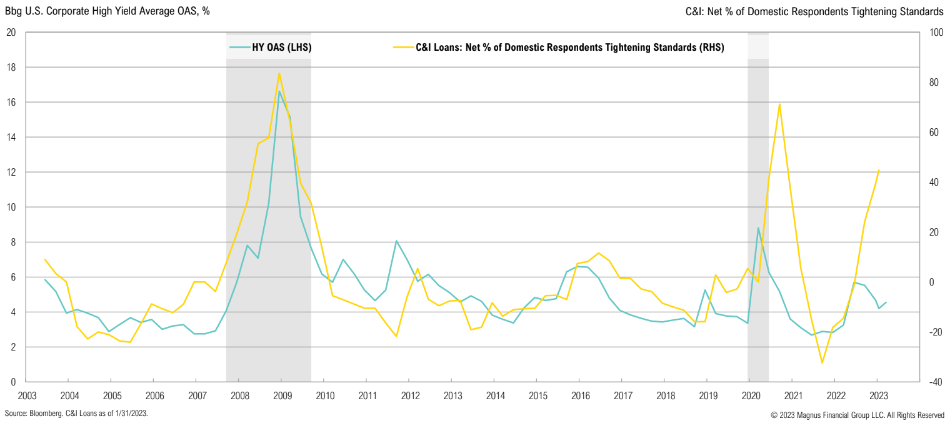
HY OAS vs. Loans
Domestic banks have tightened lending standards sharply over recent months, an event which has generally been associated with wider credit spreads
C&I Loans
Commercial and Industrial loans declined by $50Bn in the week ending March 22, the largest weekly drop on record; real time evidence of tightening credit conditions
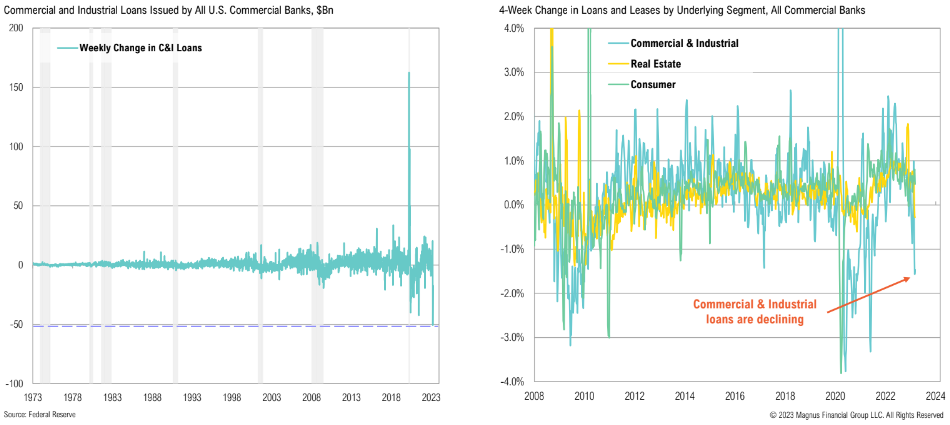
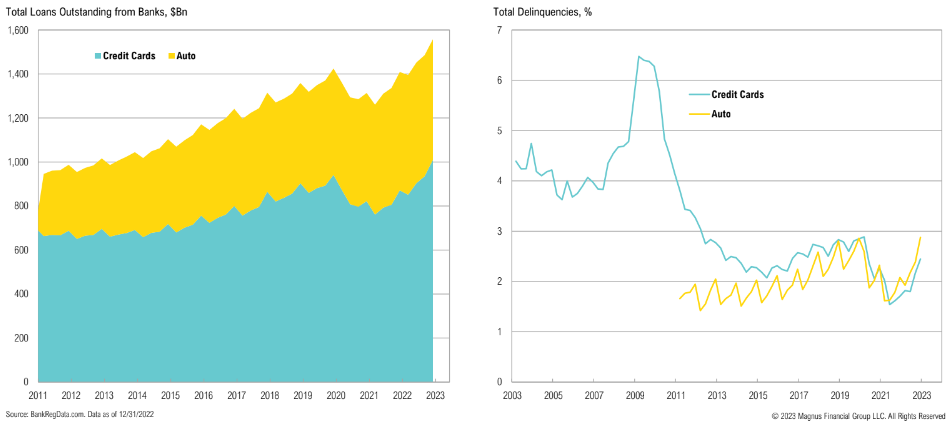
Consumer Loans
The consumer has gone on a spending spree post-COVID, leading to massive loan growth and an uptick in credit card and auto delinquencies
High Yield Spreads
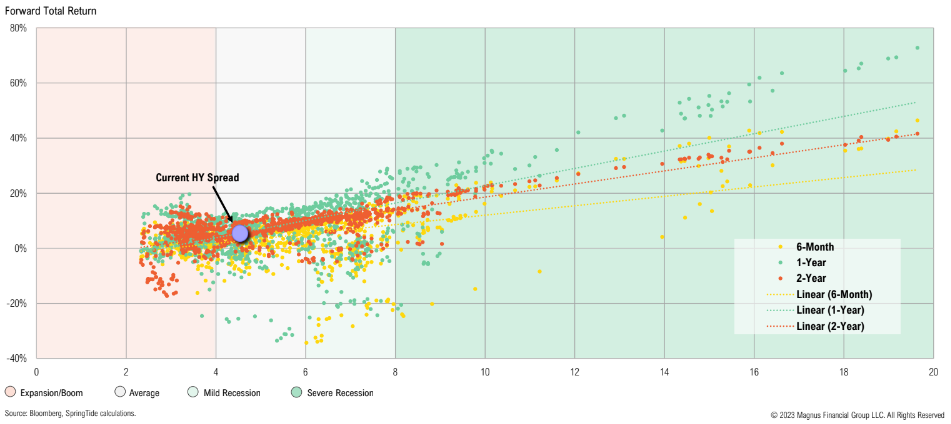
Tranching in high yield bonds: some spread levels to consider are 6%, 8%, and 10%, with the goal to have each tranche be incrementally larger; current spread is at a middling 4.5%
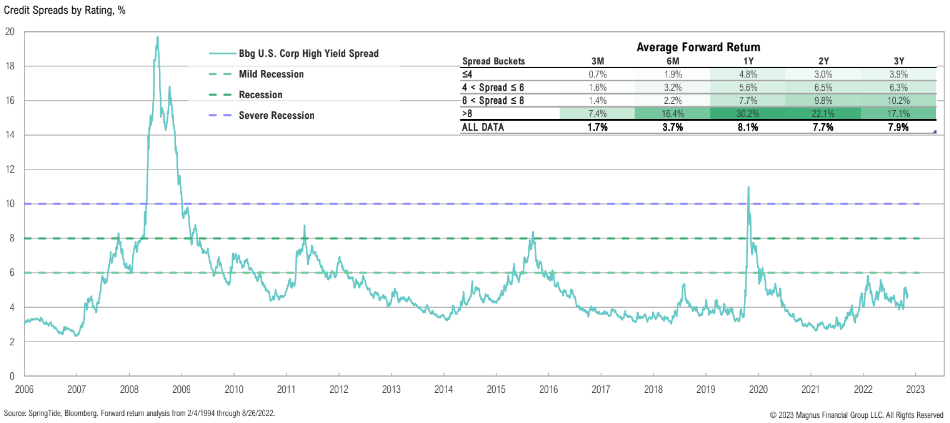
Historically, high yield spreads above 6% have resulted in above-average forward returns; high yield spread is currently trading at a middling 4.5%
Mixed messages sent by the current administration respecting the necessity for fossil fuel production, scarcity of labor, increased cost of materials, domestic and foreign political risk, demand volatility and economic uncertainty have each contributed to an environment that is difficult to work and make plans in going forward.
E&P Oil Executive, Q1 2023 Dallas Fed Energy Survey
Real Assets
Market Returns Summary
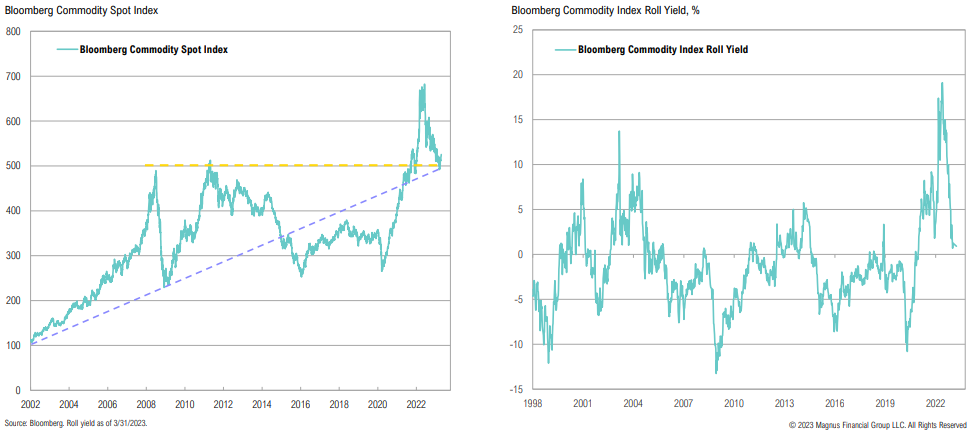
Commodity roll yields have dropped sharply, currently at 0.9%, largely due to natural gas futures shifting back to contango, suggesting global commodity markets have loosened
Commodities
Commodity roll yields have dropped sharply, currently at 0.9%, largely due to natural gas futures shifting back to contango, suggesting global commodity markets have loosened
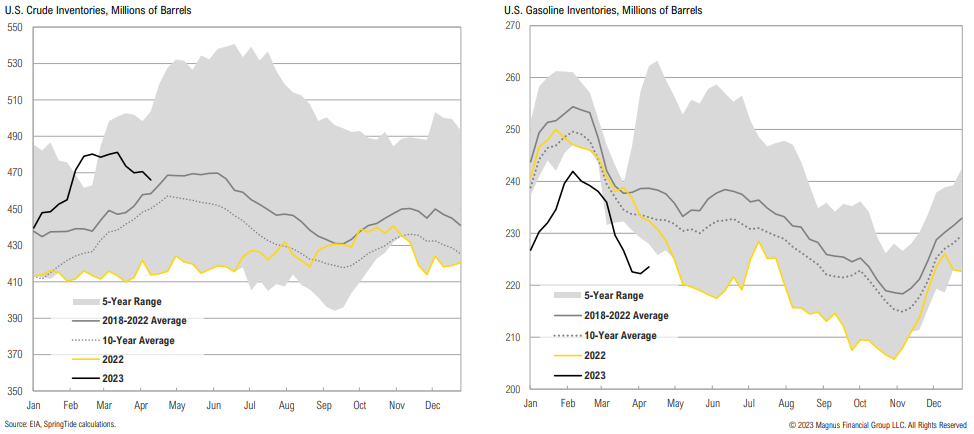
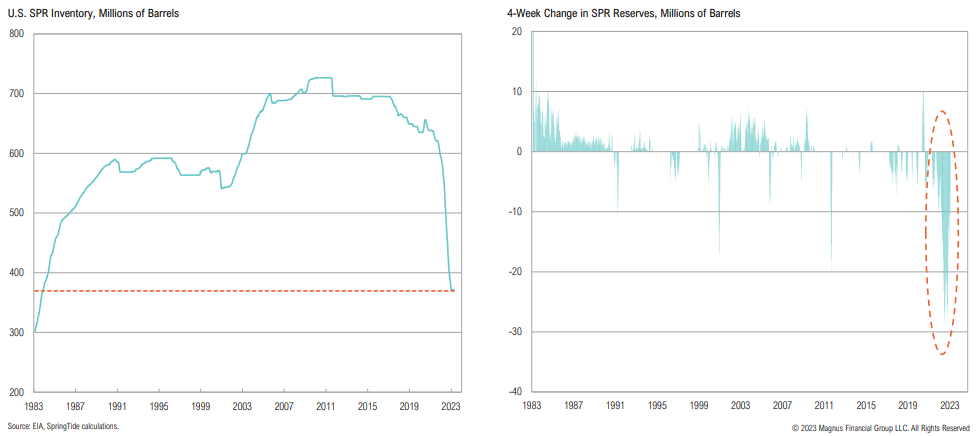
Inventories
Crude inventories added 50 million barrels in Q1 and are now above their 5-year average; gasoline inventories remain tight
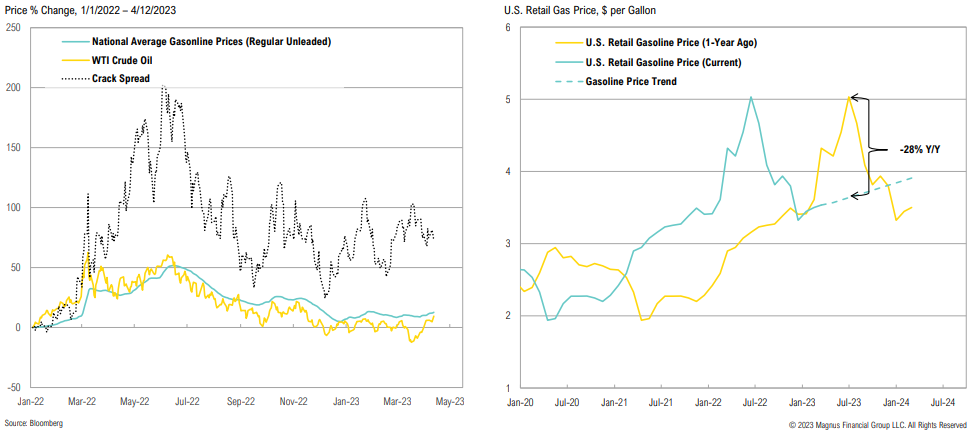
Gas Prices
Crack spreads remain elevated despite the decline in oil prices, signalling continued constrained refinery capacity; gas prices will likely detract from headline inflation until 4Q’23
Energy Prices
As part of a budget mandate enacted in 2015, the SPR will be reduced by 26 million barrels between April 1 and June 30, with 3 million barrels already released in April
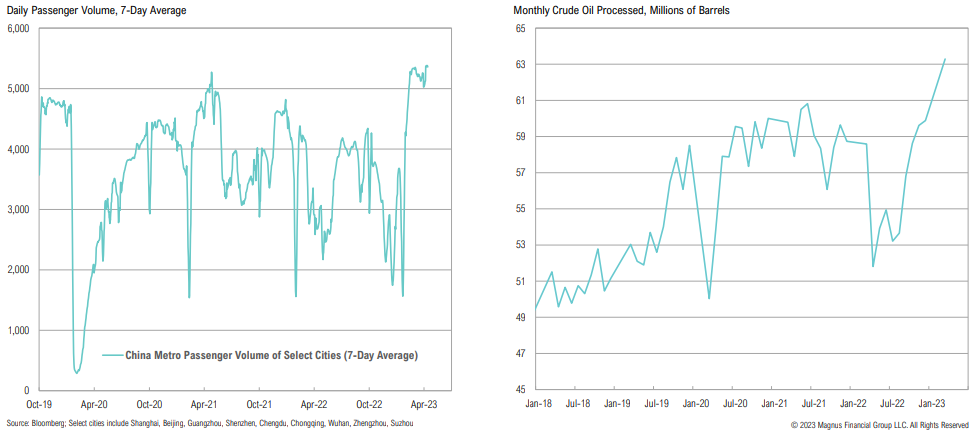
China
There are signs that mobility in China is normalizing; in March, Chinese refiners processed record high levels of crude oil
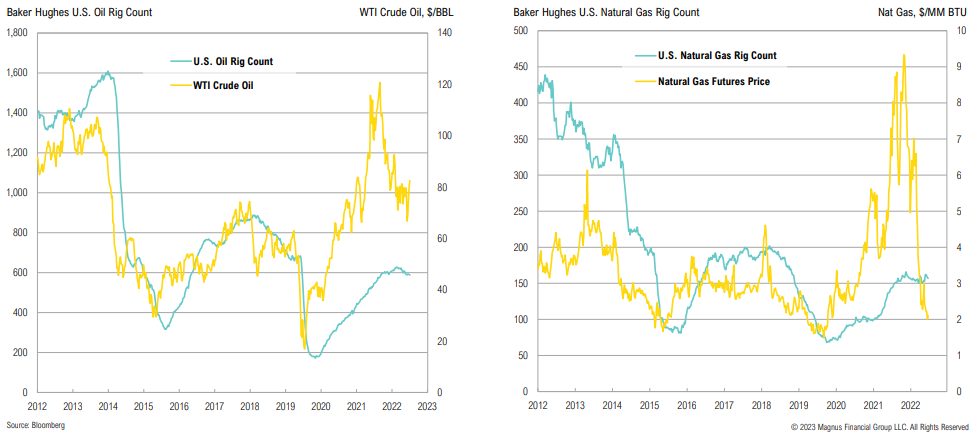
Oil & Natural Gas
Oil and natural gas rig counts have started to decline on weaker commodity prices
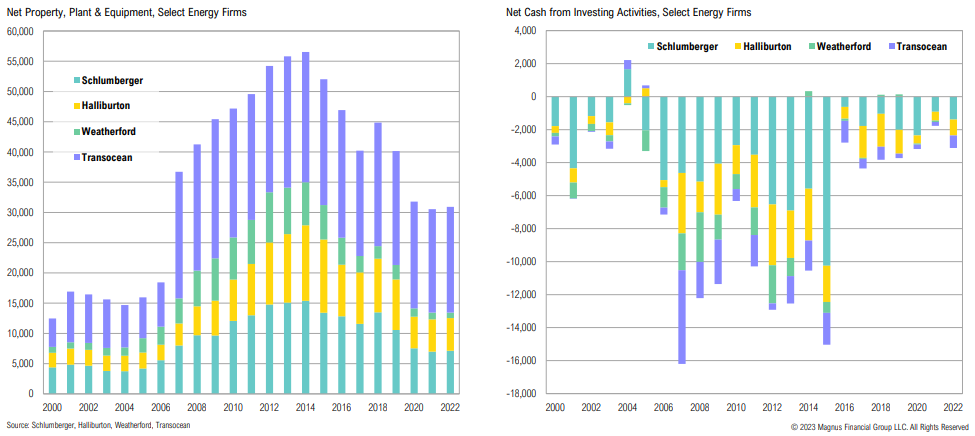
Oil CAPEX
Since COVID, drilling capex levels have been near the bottom of a 65-year range
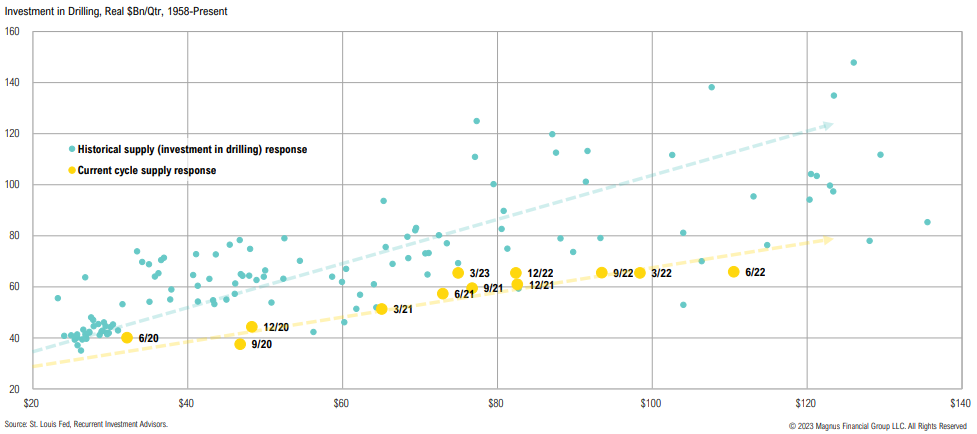
Oil CAPEX
Energy firms have decreased investment from 2008-2018 levels
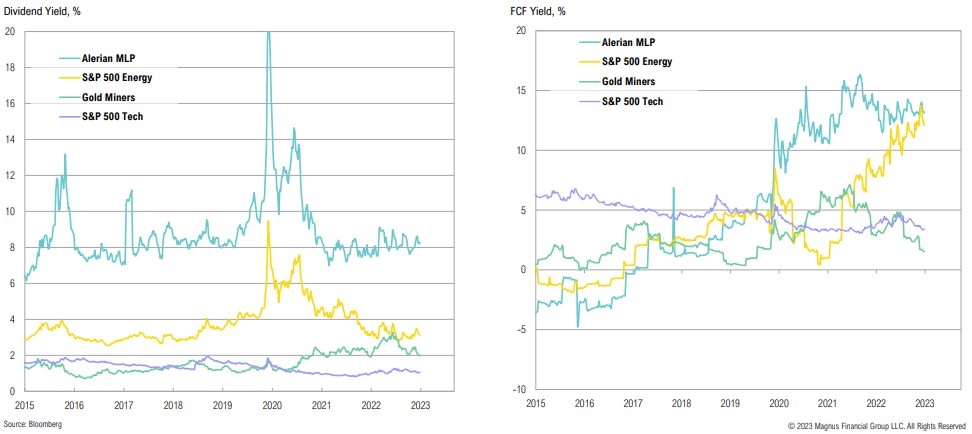
Yields
Midstream distribution yields trended lower as the sector broke out to upside but has seemingly stabilized around an attractive 8%; free cash flow yields of the energy sector remain attractive
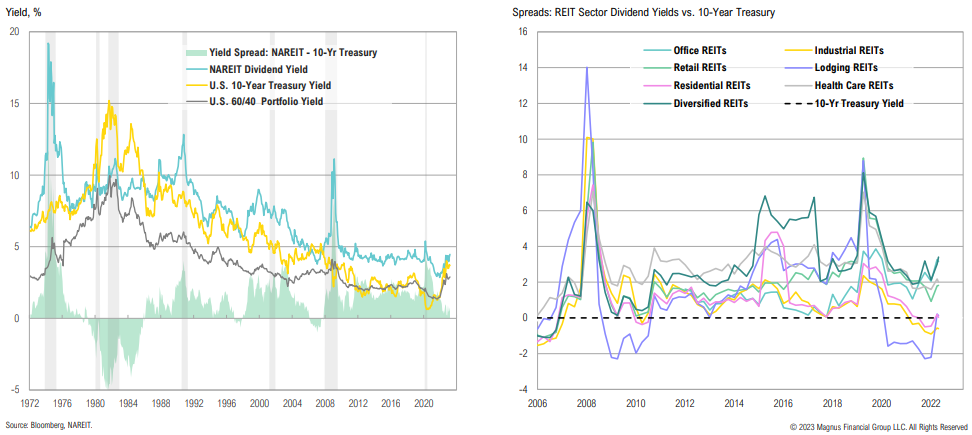
REITs
Even after declining over 20% over the last year, REIT yields are wholly unattractive on a relative basis, despite looking more attractive on an absolute basis
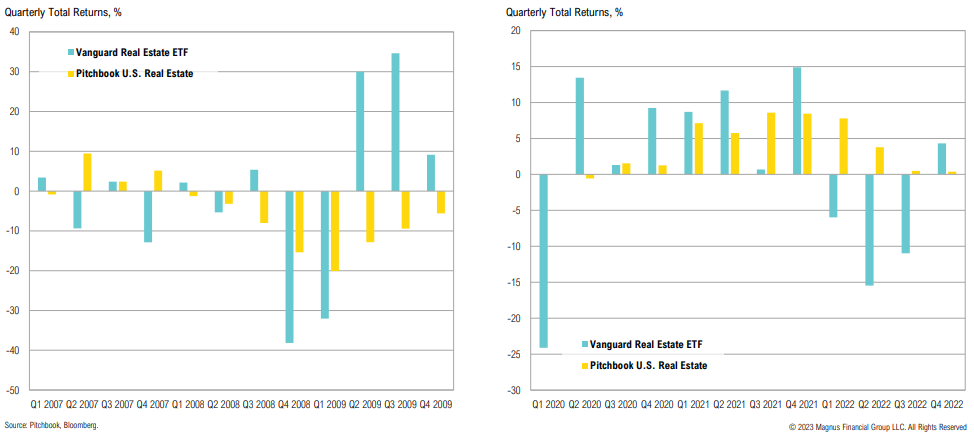
Private Markets
Private market interval funds have significantly outperformed their passive investable benchmarks since the Jan ‘22 peak as net asset values have yet to catch down to reality
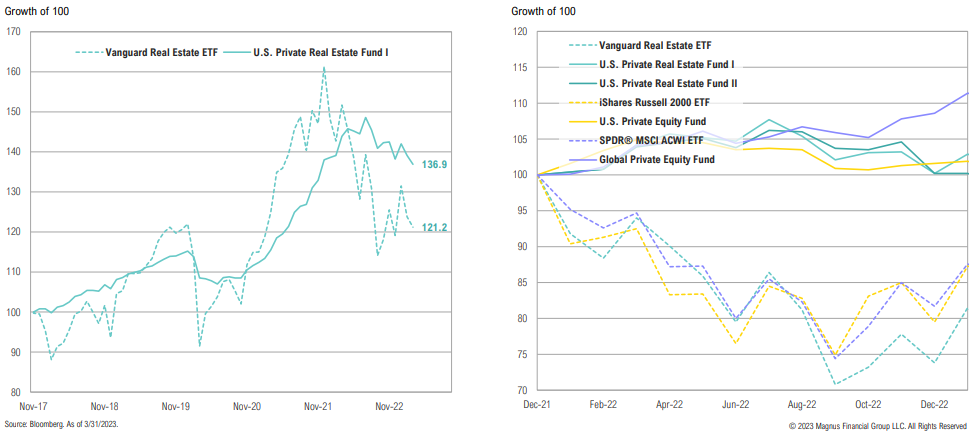
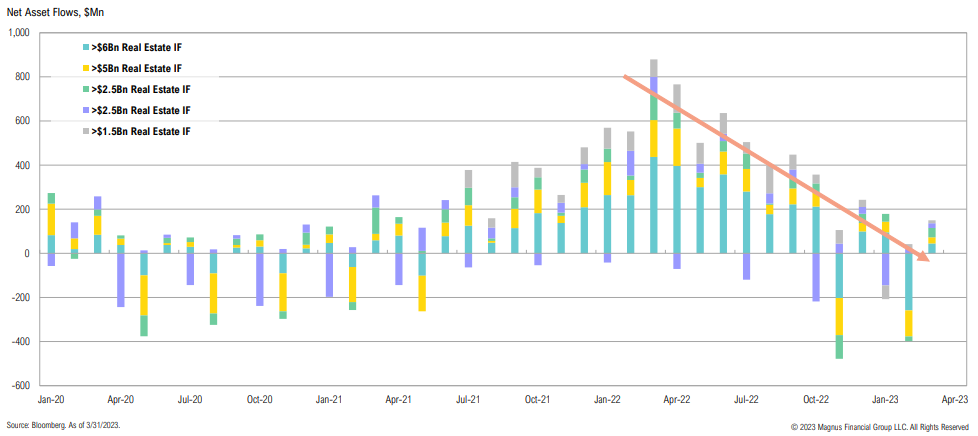
Private Markets
Given the quarterly redemption cycle, it seems likely that private real estate funds will see considerable outflows over the summer (starting in May)
Private Real Estate
Private real estate funds have not marked down properties like they did in the GFC (last year PRE/PRE interval funds outperformed public REITs by 37%)
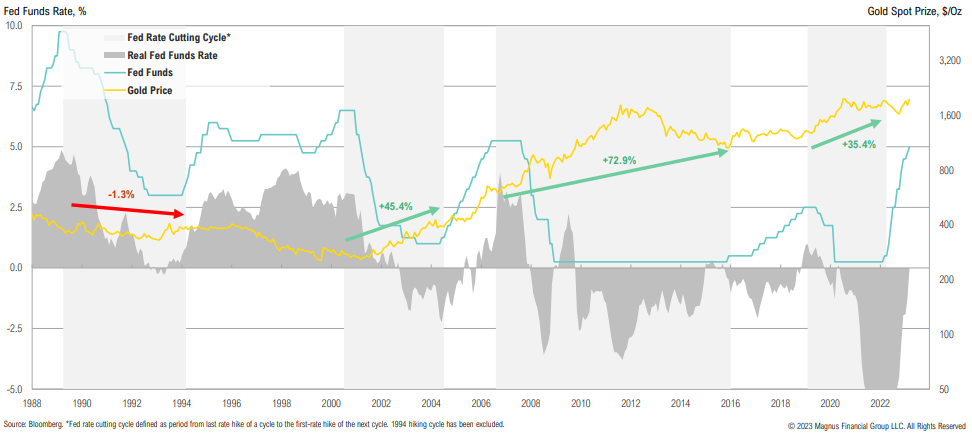
Gold vs. Fed Funds
Since the turn of the century, the end of hiking cycles has been positive for gold; this may be due to lower opportunity costs (falling real rates)
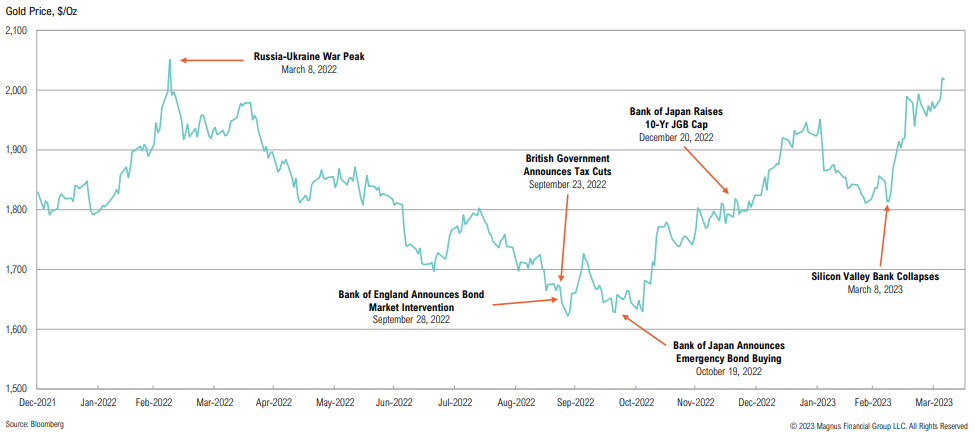
Gold Prices
Gold has recently been testing record-highs in U.S. dollars and is starting to behave more favorably as a financial crisis and fiat currency hedge
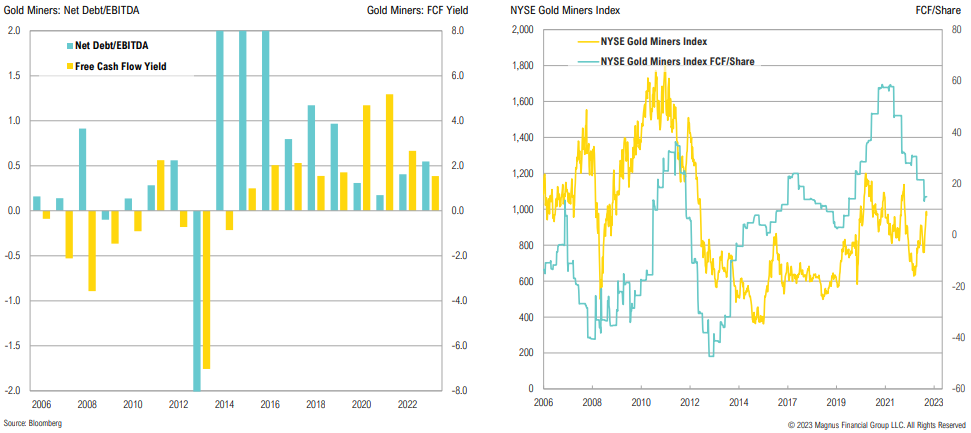
Gold Miner Fundamentals
Gold miners have rallied >60% from Sept ‘22 lows, as spot gold prices catch a bid, but increasing operating costs remains a key risk for miners
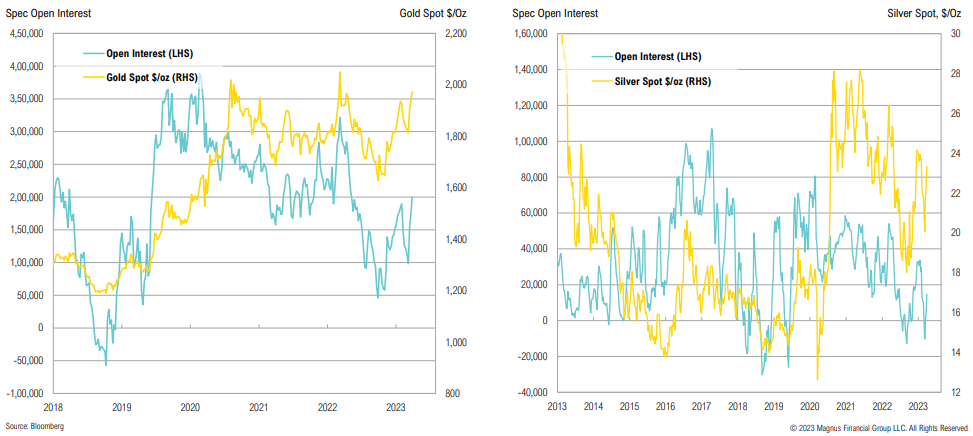
Gold Futures Positioning
Spec positioning in gold futures has increased as gold rallied; positioning is getting more constructive, but not stretched (implying higher odds of a sustained breakout)
Because financial conditions have not significantly tightened, the labor market continues to be strong and quite tight, and inflation is far above target, so monetary policy needs to be tightened further.How much further will depend on incoming data on inflation, the real economy, and the extent of tightening credit conditions.
Christopher Waller, Federal Reserve Governor
Opportunistic
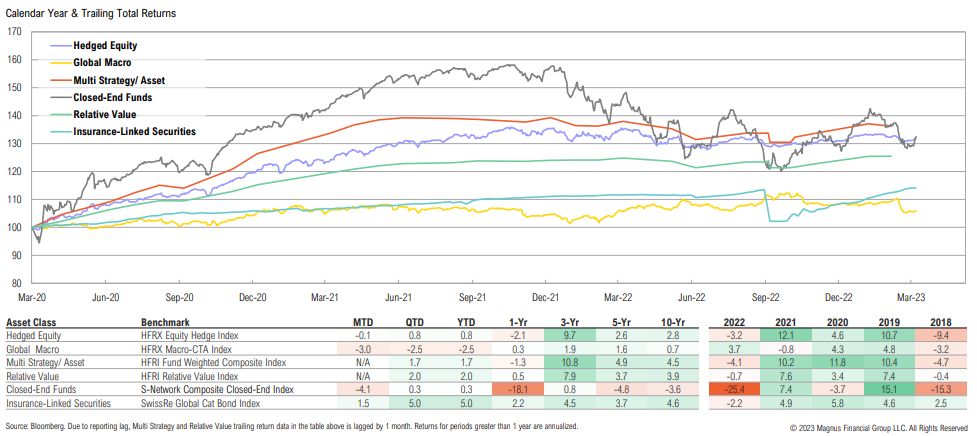
Market Returns Summary
Insurance-linked securities were the top-performing opportunistic asset class over the quarter, up 5.0%, while global macro had another poor quarter, down 2.5%
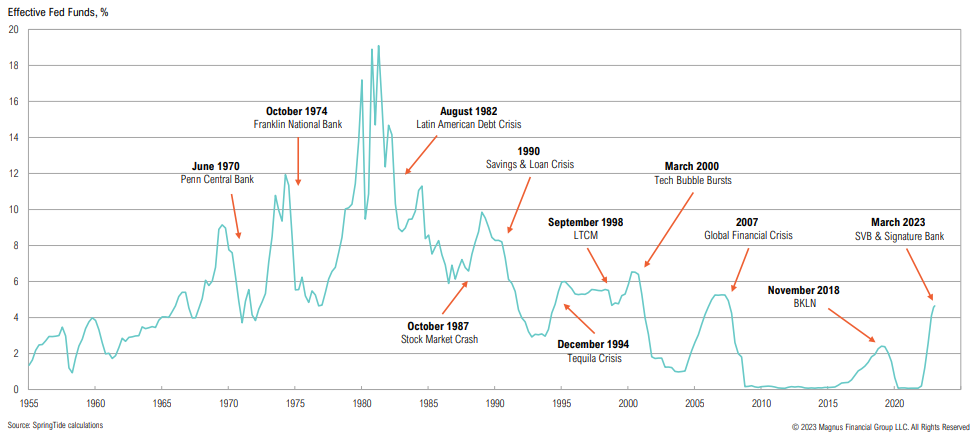
Rate Hike History
“Hike until something breaks” is typically how cycles play out
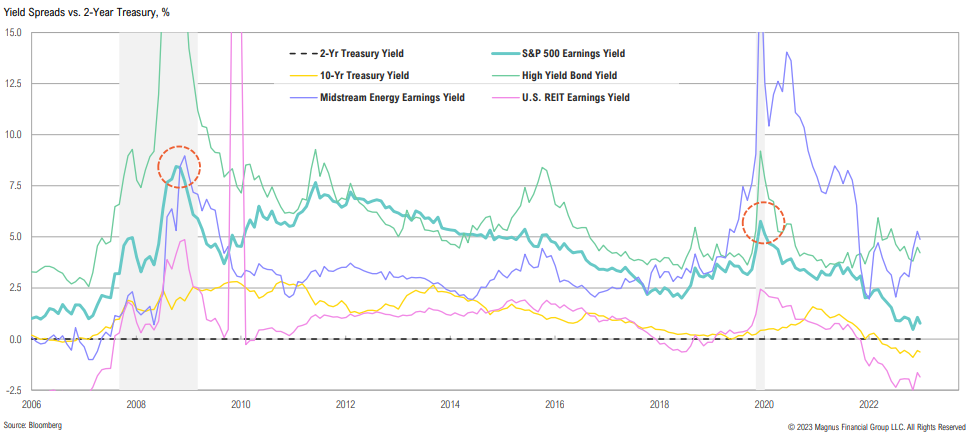
Yield Spreads
Most asset classes don’t look attractive relative to the 2-year Treasury yield; spreads have some way to go if past recessions are at all indicative
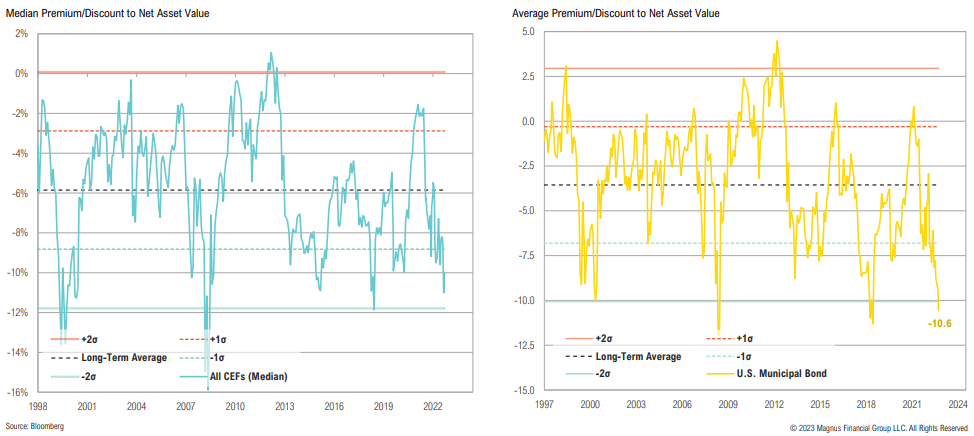
CEF Discounts
CEF discounts widened over the quarter and are currently at -10.1%; notably, U.S. muni bond funds have seen discounts widened to near record levels, with an average sector discount of -10.6%
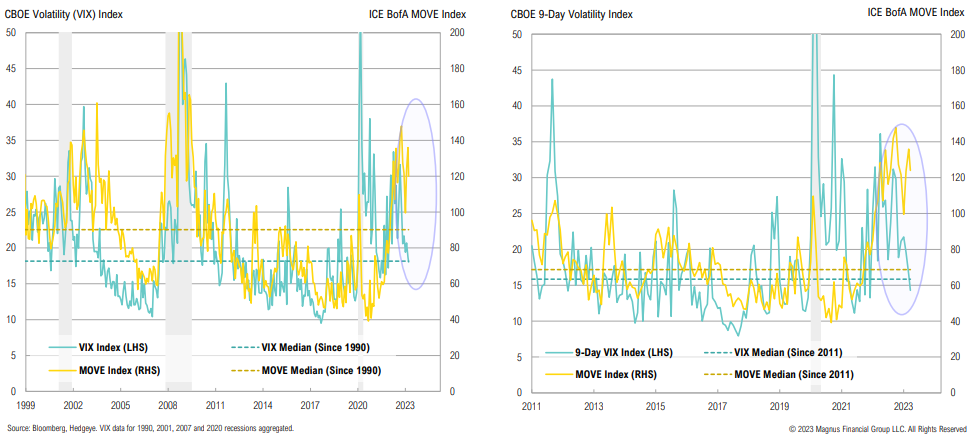
VIX vs. MOVE
The implied bond market volatility (MOVE) isn’t showing the same level of composure as equities (VIX); it is unlikely that both markets are correct
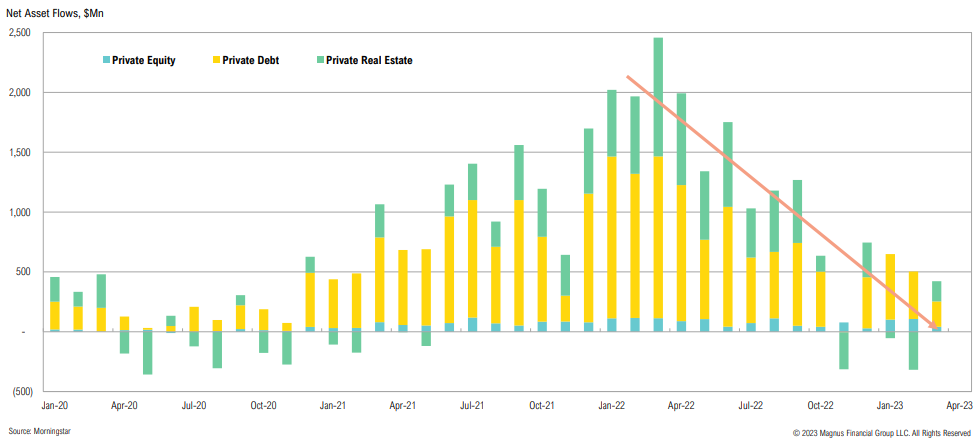
Interval Fund Flows
Interval funds saw massive inflows in 2021 and 1H 2022, but these may be starting to reverse; real estate interval funds have already started to experience meaningful outflows
Patience can produce uncommon profits.
Philip L. Carret, American Investor
Asset Allocation
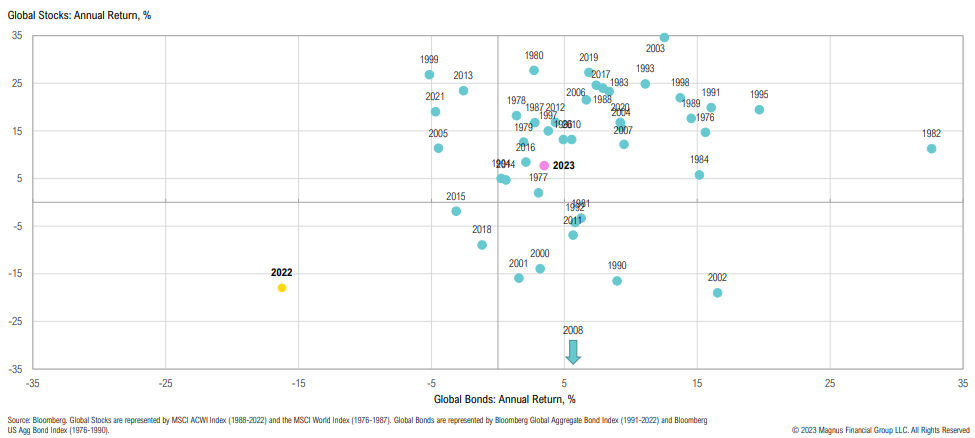
Stocks & Bonds
2021 was an unusual year for global stocks and bonds, 2022 even more so; while 2023 is off to a good start, returns have been volatile—it remains to be seen how the year will play out
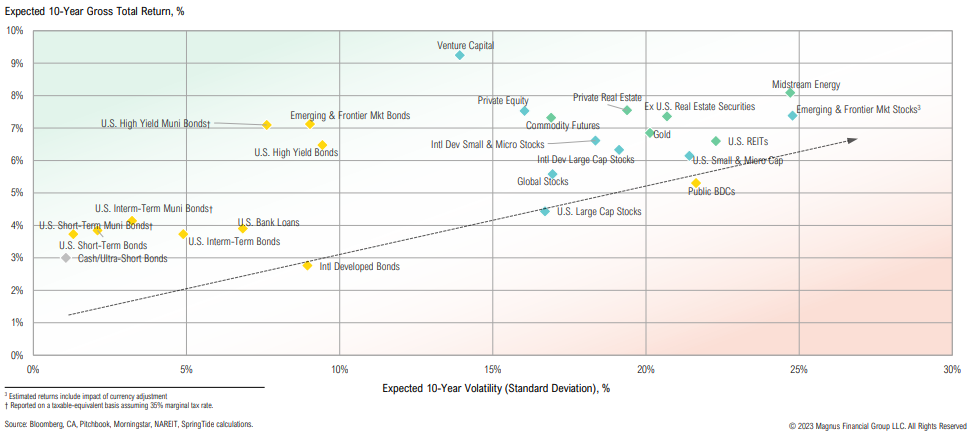
CMEs (As of 3/31/2023)
Expected 10-year returns for bonds fell marginally as yields fell; some equity and real assets became more attractive as dividend yields increased throughout the quarter