A Nickel For Your Thoughts
SUMMARY
“It is a fantasy to think the Fed can tame the fastest U.S. inflation in four decades without aggressively raising interest rates… We have to put downward pressure on the component of inflation that we think is persistent.”
– James Bullard, Federal Reserve Bank of St. Louis President , April 2022
Just as COVID-19 seemingly receded to the point that we could emerge in a new normal, Russian forces invaded Ukraine on February 24. Equities, which were already negative for the year, initially moved even lower while commodities added to their gains, fueled by concerns over supply chain issues and access to critical raw materials. Fears that inflation, already at uncomfortable levels, could surge even higher kept investors from seeking safety in fixed income securities and drove bond yields up significantly.
In February, the Consumer Price Index was up 7.9% on a year-over-year basis, reaching an almost 40-year high, and this reading did not yet include the effects of the Russian invasion. The March reading, which did incorporate the effects of the invasion, hit 8.5%, its highest since 1981. Before the war in Ukraine, markets were anticipating six interest rate hikes from the Federal Reserve in 2022. By the end of March, markets were anticipating ten hikes, signaling an expectation that inflation would persist.
The Federal Reserve, which was already falling far behind the tightening curve before Russia’s invasion, found itself in an uncomfortable predicament. Minneapolis Federal Reserve President, Neil Kashkari, summed up the environment well in a recent piece:
“We know that the wealth effect is a real phenomenon, and both the stock market and house prices are up 30% relative to pre pandemic levels, even households who don’t own stocks or homes have on average stronger balance sheets than before the pandemic. Perhaps this is leading people to be more confident and simply spend more. Either way, the FOMC must act to bring the economy back into balance.”
Because it can do little to improve the supply-side side constraints on commodity markets and global supply chains, the Fed seems focused instead on reducing demand by engineering an economic slowdown, a move that is justified by more than just inflation metrics. The most recent jobs report showed an unemployment rate of 3.6%, an unambiguously strong number and a dramatic improvement from the depths of the COVID-19 crisis. However, real GDP growth is already expected to slow substantially. The Atlanta Fed’s GDPNow model is estimating Q1 GDP growth to be 1%.
If we could read the minds of Vladimir Putin and Fed Chairman Jerome Powell, it would be significantly easier to allocate capital for the rest of 2022, but we cannot. Inflation remains the critical determinant for both economic growth and asset prices, and its trajectory remains uncertain. Although inflation is expected to gradually and organically decline during the year, the Federal Reserve may be able to slow it even more quickly via a demand shock, but Putin could thwart its efforts by extending the war. Further, with interest rates rising so rapidly, the risks of the Federal Reserve doing too little may outweigh the risks of it doing too much. As profoundly uncertain as the future is, such turmoil can provide opportunities, and we remain focused on analyzing incoming data to find avenues to deploy capital more efficiently and productively.

1Q, 2022 MARKET REVIEW
The first quarter was an unusually challenging in that both U.S. large cap stocks (-4.6%) and U.S. bonds (-5.9%) declined together

SUMMARY
LONG-TERM ASSET CLASS RETURNS
Key markets near all-time highs with inflation running well above “target” exposes the challenge policymakers face

GROWTH, INFLATION & POLICY
“[Controlling inflation] is the top concern that I have for 2022”
–Rafael Bostic, Federal Reserve Bank of Atlanta President , March 2022
GDP & INFLATION
Growth and inflation both expected to slow but remain above average for next several quarters

INFLATION TRENDS
Inflation surprise has bounced back in March after cooling off; still surprising forecasts on a global scale, a first since 2008

Two inputs that hurt low-end consumers the most: energy prices up substantially, foot prices at concerning levels

REAL EARNINGS
Since early 2021 inflation has outpaced wage growth, eroding real household disposable income

DEBT SERVICE & REVOLVING CREDIT
As transfer payments have waned, the consumer has started to dial up leverage, but plenty of room to go

INFLATION EXPECTATIONS
Post-Russian invasion, inflation and inflation expectations have become unhinged relative to recent history

CONSUMER SENTIMENT VS CONFIDENCE
The Consumer Sentiment minus Confidence spread suggests consumers have never been more pessimistic about their personal situation relative to the economy

2-YEAR TREASURY VS. FED FUNDS
Watch the Treasury market for policy changes: the 2-year Treasury tells you everything you need to know about pending Fed decisions

MORTGAGE RATES
Current pace of mortgage rate increase is unprecedented, but rates are still manageable in absolute terms

MORTGAGE RATES & HOUSING MARKET
With mortgage rates and home prices rising, housing is less affordable

MANUFACTURING & INVENTORIES
ISM Manufacturing PMI has rolled over; retailers have struggled to build inventories to match demand

RATE HIKE EXPECTATIONS
The market is now pricing in 11 rate hikes in 2022, up from the 7 expected post March FOMC meeting

TRANSIT ACTIVITY
TSA throughput is back to pre-COVID levels, while work-from-home may be here to stay

ENERGY PRICES & APPROVAL RATING
Rising energy prices will continue to be a hot topic for consumers and the current administration

MIDTERMS
Looking ahead to November, the race for Senate control will rely on a select few toss-up states

EQUITY
“We do know that the wealth effect is a real phenomenon, and both the stock market and house prices are up roughly 30 percent relative to pre-pandemic levels; even households who don’t own stocks or homes have on average stronger balance sheets than before the pandemic. Perhaps this is leading people to be more confident and simply spend more. Either way, the FOMC must act to bring the economy back into balance.”
– Neel Kashkari, President of the Federal Reserve Bank of Minneapolis, 2022
MARKET RETURNS SUMMARY
US large cap stocks held up best over the quarter but ended 4.6% lower; US small cap stocks and emerging & frontier stocks were both down ~7%

EARNINGS
U.S. large cap multiples contracted in Q1; earnings are expected to make new all-time highs this year

VALUE VS GROWTH
Growth equity prices still not supported by earnings

VALUATIONS
Valuations continue to contract so far this year

IPO MARKET
IPO withdrawals are at highest levels since 2008 despite IPO filings returning to more normal levels after extreme 2021

HIKING CYCLES & RETURNS
Can’t rely on averages when evaluating what the yield curve inversion means for markets; fast vs. slow hiking cycles remains the key
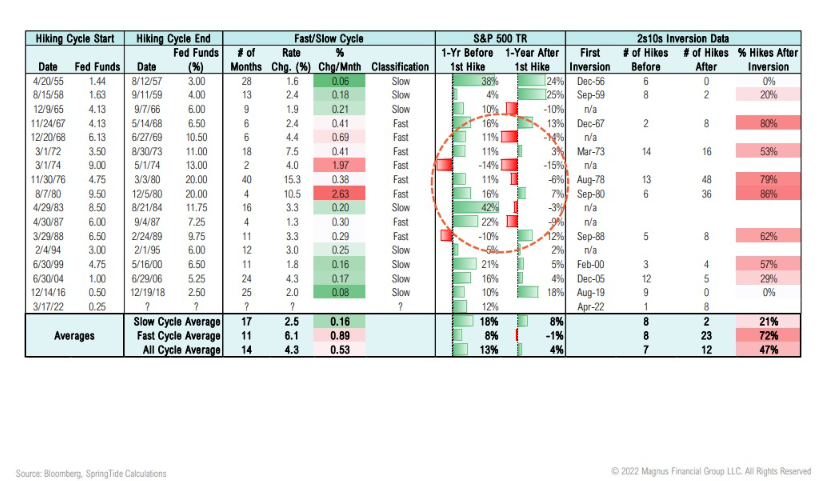
Fast hiking cycles correlate with poor returns following first rate hike; in order to be classified as a fast hiking cycle the Fed needs to hike more than 8 times

FIXED INCOME & CREDIT
“It is appropriate in my view to be moving a little more quickly. I also think there’s something in the idea of front-end-loading [the removal of stimulus].”
– Jerome Powell, Federal Reserve Chairman, April 21, 2022
MARKET RETURNS SUMMARY
All U.S. fixed income and credit asset classes were down over the quarter, U.S. bank loans holding up best, with international developed bonds selling off most

U.S. BOND RETURNS
2021 was 3rd worst year for U.S. bonds since 1989; 2022 is off to a dramatically worse start

TREASURY YIELDS & CREDIT SPREADS
U.S. Treasury yield curve has flattened with parts of the curve inverting, while credit spreads have remained at or near historically tight levels

SPREADS BY SECTOR
Credit spreads near median across most sectors as almost all pain in credit has been due to duration component (not spread widening)

TREASURY SPREADS
Yield curve inversion, could spell the end of this cycle; risky assets can generate strong returns in the year after the inversion

GLOBAL RATES
The U.S. bond market remains relatively higher yield, which could help keep U.S. rates somewhat contained

TREASURIES VS JGB’S
The yen has weekend to a 20-year low against the dollar as the BOJ continues its infinite QE; US treasuries looking attractive vs JGB’s

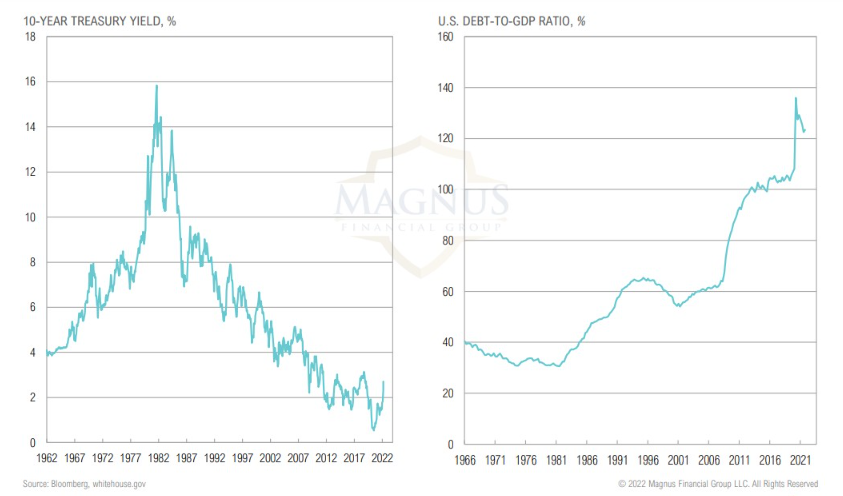
TREASURY MARKET
The treasury market has been an enabler of increasing deficit spending and debt levels…is it now “fed up”?
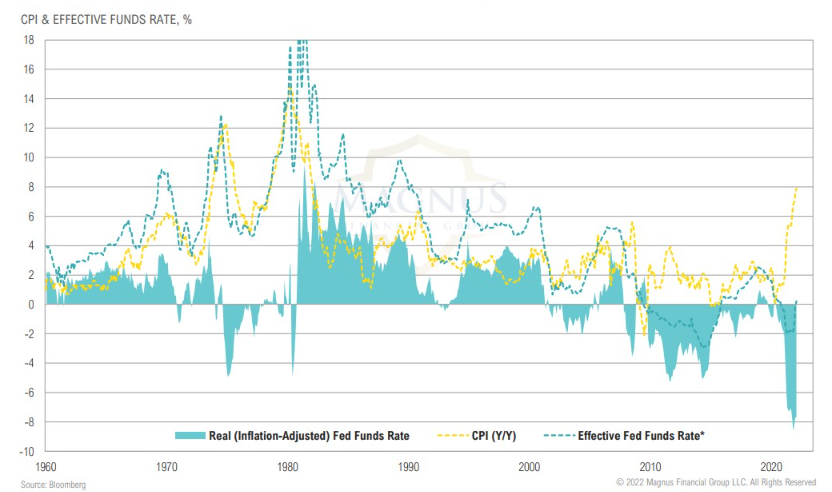
REAL INTEREST RATES
The Fed is falling further behind the curve & unless inflation rolls over, will be forced to hike into an economic slowdown and potential market correction
TREASURY ISSUANCE
Nearly $700bn in treasury issuance in first quarter is expected to slow to less than $70bn in Q2

REAL ASSETS
“The refusal of several Western countries to cooperate [with Russia] normally, including with regards to Russian energy resources…has already hit millions of Europeans, [provoking] a real energy crisis.”
– Vladimir Putin, April 13, 2022
MARKET RETURNS SUMMARY
Commodities and energy outperformed in the first quarter; U.S. REITs have struggled along with risky assets more broadly this year

OIL PRODUCTION/CONSUMPTION
Global petroleum consumption has outpaced production 18 of the last 20 months, but may improve; however, EIA forecasts have been overly optimistic for years

U.S. OIL PRODUCTION
Despite higher oil prices, U.S. oil producers are being held back by investor pressure to maintain capital discipline

REITS
REIT yields may be currently attractive on a relative basis, but in keeping perspective they are at the lowest absolute levels in history

OIL & NATURAL GAS
Oil and natural gas producers have been cautious to bring rigs back online despite rising prices

YIELDS
Midstream distribution yields trending lower but remain relatively attractive, free cash flow yields of energy sector remain attractive

GOLD MINER FUNDAMENTALS
Gold miner performance starting to catch up to fundamentals, the industry has seen broad deleveraging and improved cash flow

OPPORTUNISTIC
“The staff continued to judge that the risks to the baseline projection for real activity were skewed to the downside and that the risks to the inflation projection were skewed to the upside… The Russian invasion of Ukraine was perceived as adding to the uncertainty around the outlook for economic activity and inflation, as the conflict carried the risk of further exacerbating supply chain disruptions and of putting additional upward pressure on inflation by boosting the prices for energy, food, and other key commodities. Finally, the possibility that continued high inflation would cause longer term inflation expectations to become unanchored was seen as another upside risk to the inflation projection.”
– March FOMC Minutes, April 2022
MARKET RETURNS SUMMARY
Closed-end funds had a tough first quarter down 7.0%, while global macro returned 0.9% for the quarter thanks to strong returns in March

MONETARY POLICY & GLOBAL STOCKS
Global quantitative easing efforts supported the recent gains in global stocks

CEF DISCOUNTS
CEF discounts have widened to -7.6%, nearing 1σ below long-term average

ASSET ALLOCATION
“Nobody knows how this is going to turn out. This is an experiment.”
– Howard Marks, Co-chairman, Founder Oaktree Capital Management, 2021
STOCKS & BONDS
2021 was an unusual year for global stocks and bonds, 2022 even more so; again, highlighting the unusual predicament the Fed is in

CMEs (AS OF 3/31/2022)
Expected 10-year returns for fixed income rose substantially as yields jumped higher while equity returns rose modestly

CMEs
Modest improvement in 10-year returns, longer-term expectations hold relatively stable as the mean reversion of higher valuations is distributed over a longer time frame
