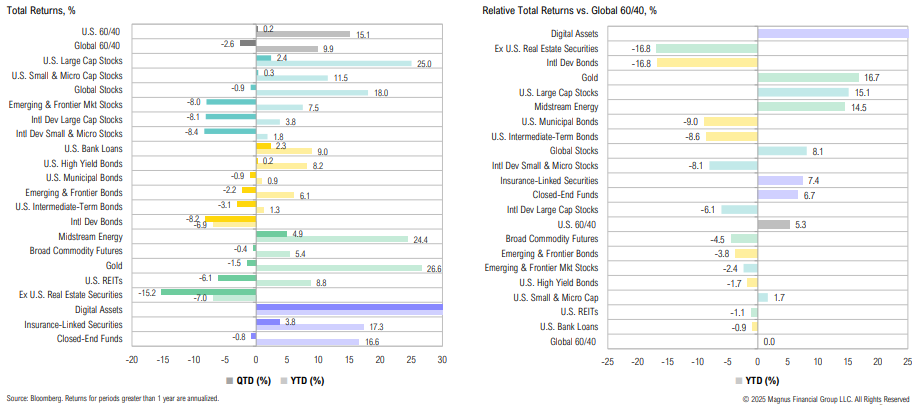
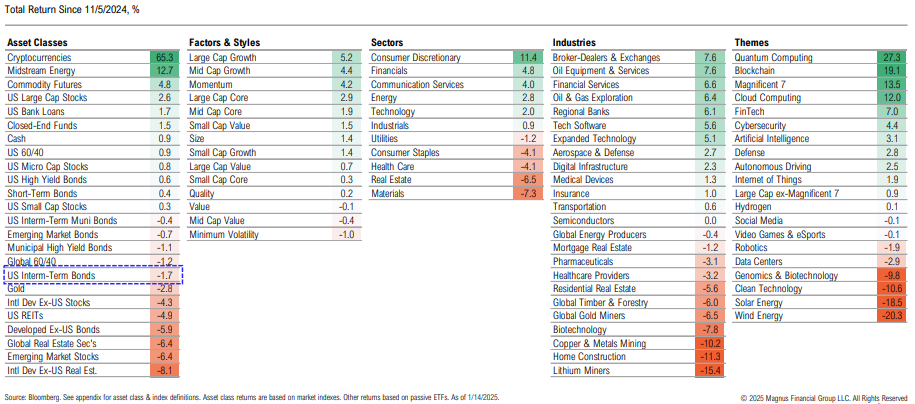
Major winners over Q4 included digital assets (+52.0%) and midstream energy (+4.9%) while ex-U.S. real estate (-15.2%) and international small cap stocks (-8.4%) lagged
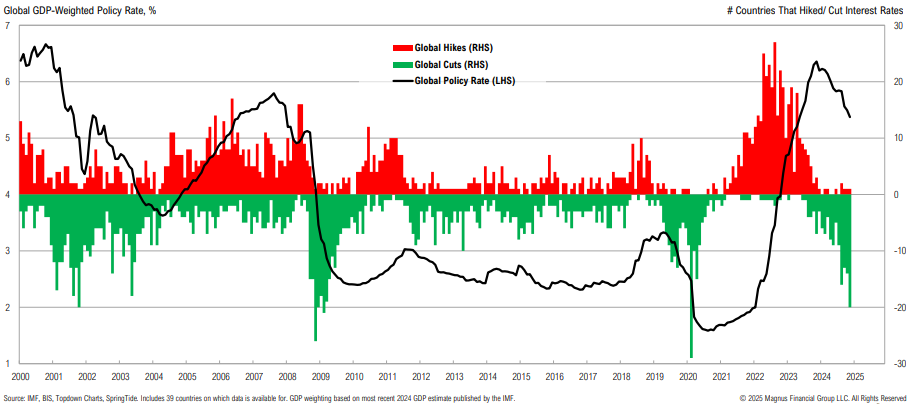
Globally, December 2024 saw the highest number of interest rate cuts and the largest drop in policy rates outside of a major crisis or pandemic
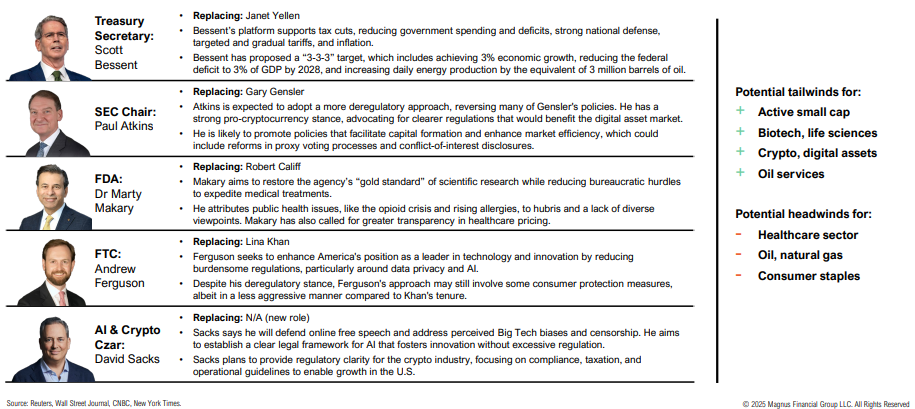
Recapping some of Trump’s picks for key White House and Cabinet jobs
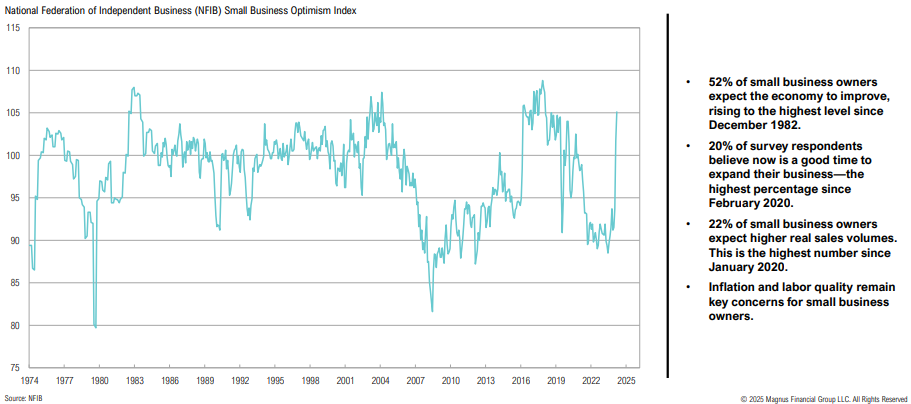
Small business optimism jumped to a six-year high in December in anticipation of pro-business policies and legislation from the incoming administration
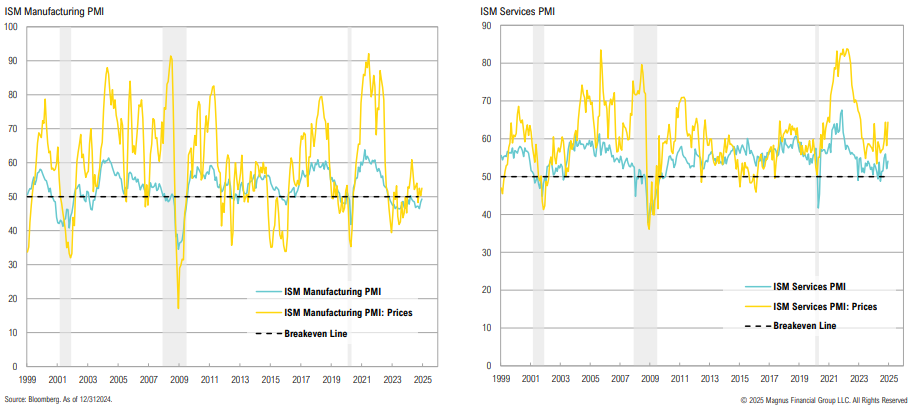
While the manufacturing sector remains in contractionary territory, the services sector remains strong; services prices paid continues to increase
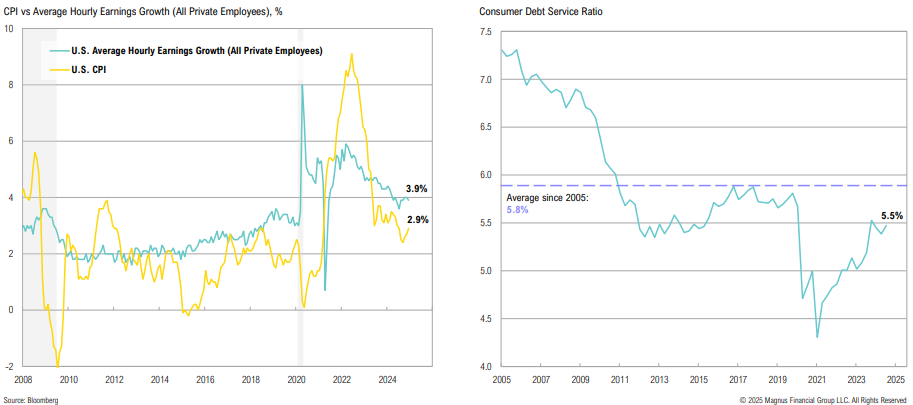
Hourly earnings continue to meaningfully diverge from CPI, rising 3.9% year-over- year in December; debt service ratios remain below average
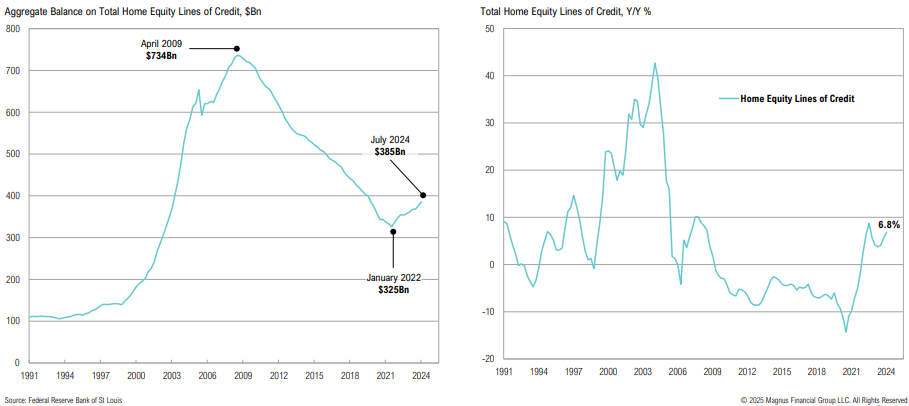
HELOC balances, which declined from 2009 to 2022, have started to climb higher again, and remain largely untapped as a source of consumer credit
Relative to prior major rate cutting cycles, the 10-year Treasury yield remains elevated since the first cut (more on this later)
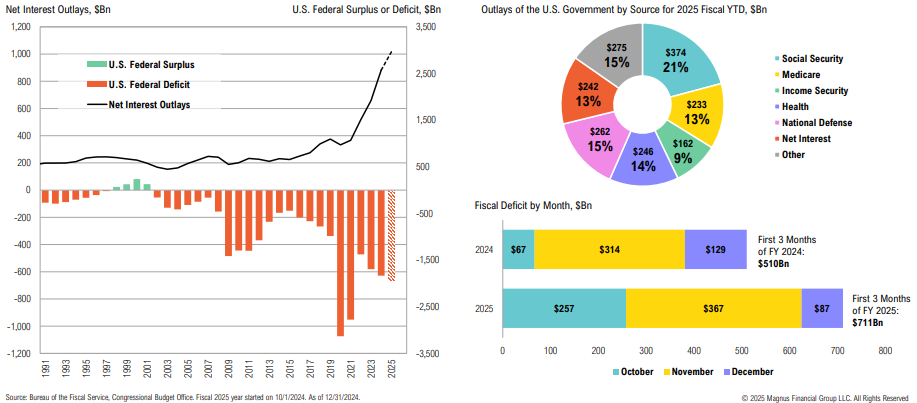
At $1.8 trillion, 2024 was the largest non-crisis/pandemic deficit on record; the CBO estimates the 2025 fiscal deficit to reach $1.9 trillion
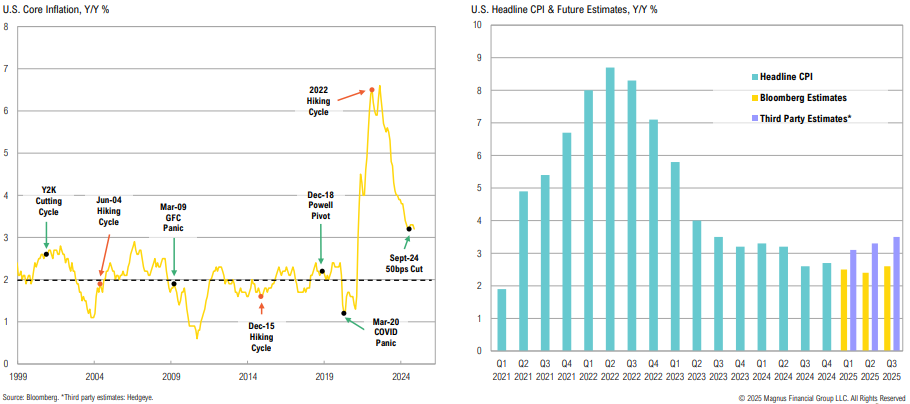
Inflation’s last mile: At 3.2%, core inflation remains well above target; estimates show that headline inflation is likely to remain above 2% through the Q3 2025
The ‘vibes’ are real… will they translate?
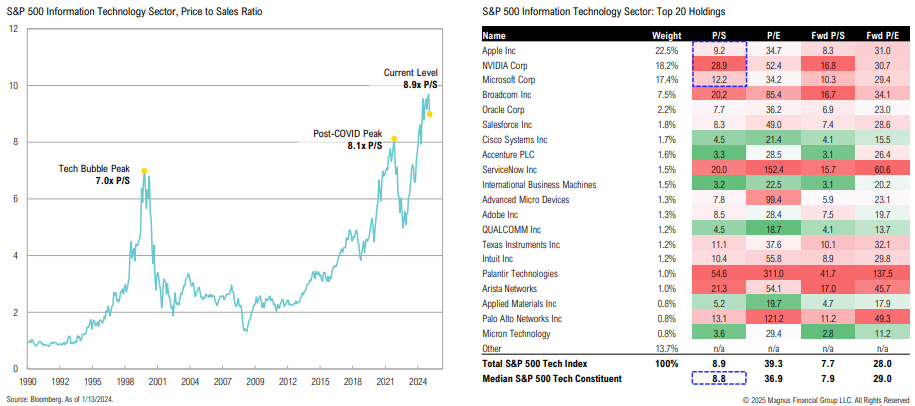
While off the peak, the tech sector P/S ratio remains nearly 30% higher than peak Tech Bubble levels; NVDA (28.9x), and MSFT (12.2x) account for ~40% of the sector
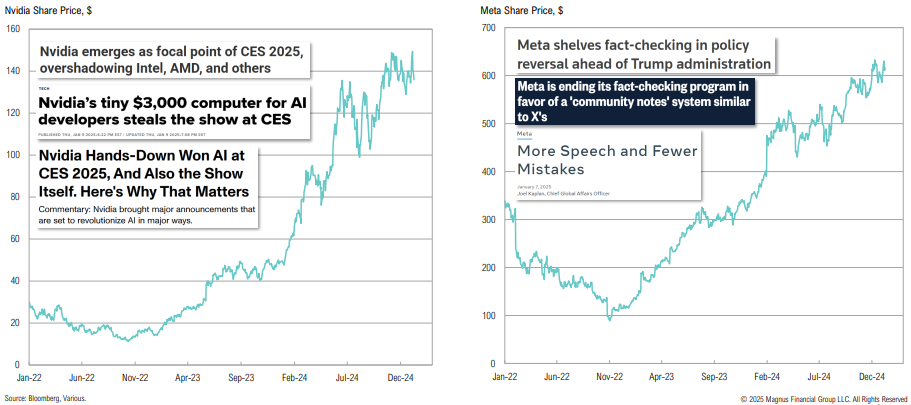
Mag 7 updates: Nvidia stole the show at CES 2025; Meta has announced policy changes, shifting to a free speech model similar to X
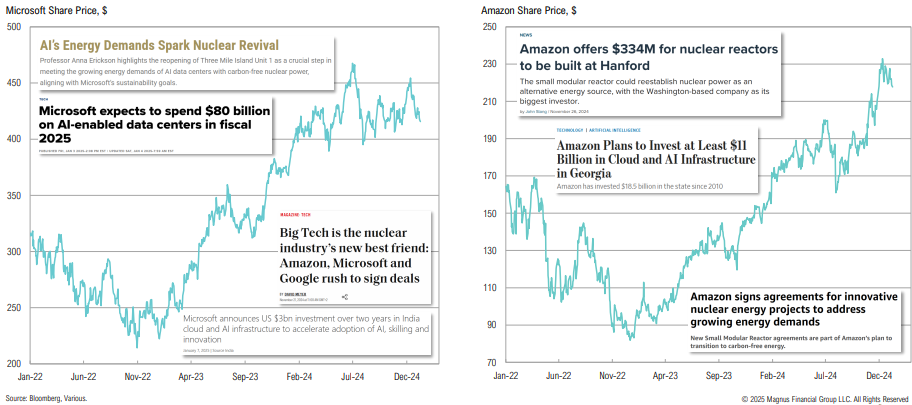
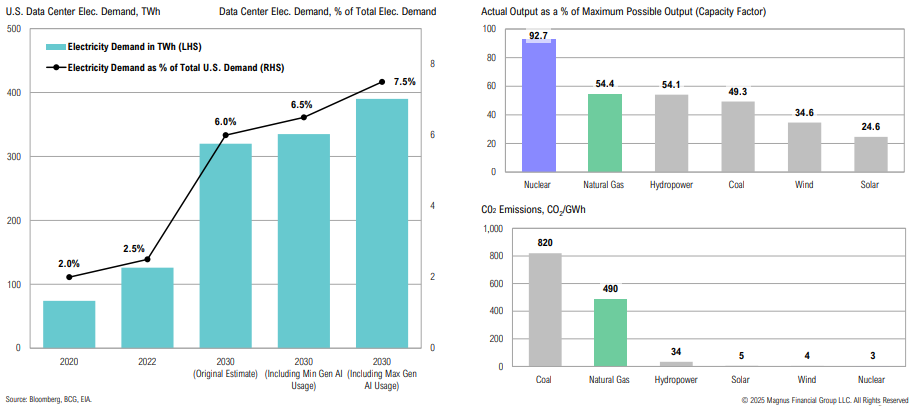
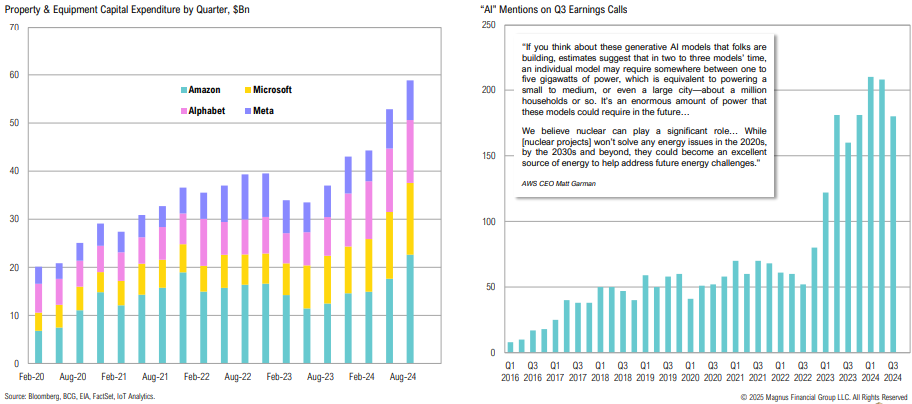
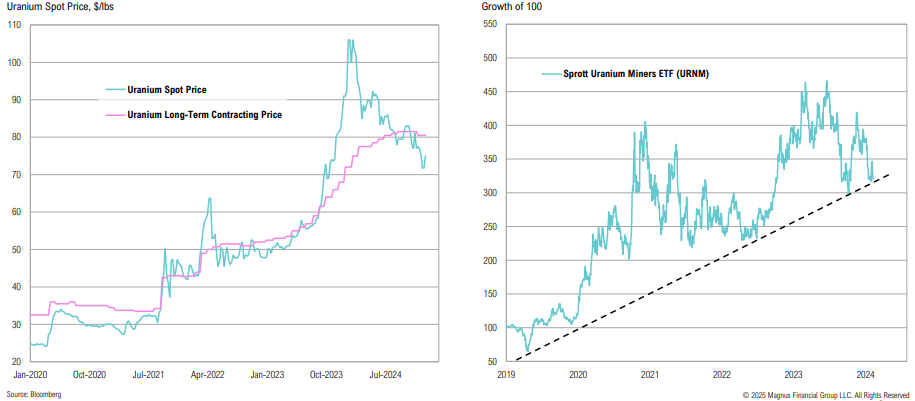
Mag 7 updates: Microsoft and Amazon both continue to invest in nuclear to meet rising energy demands stemming from AI developments
Post-election performance provides insight into the market’s expectations, but there are multiple cross-currents (how much was front-run, impact of rates, etc.)
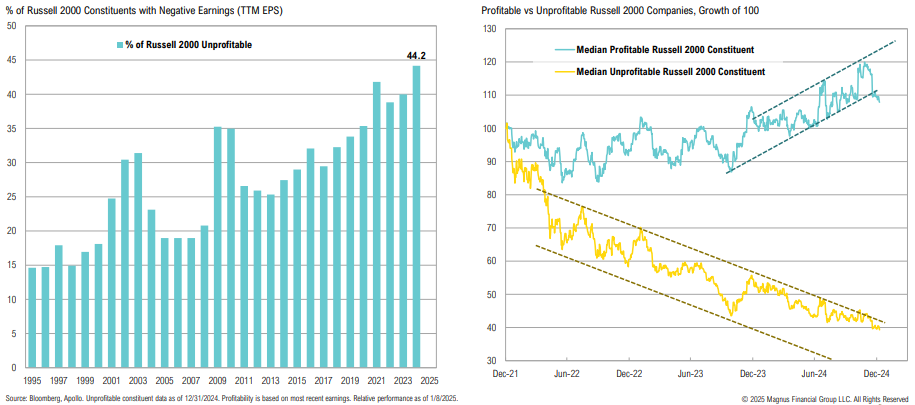
Profitable or not, small caps had started to break down as bond yields spiked
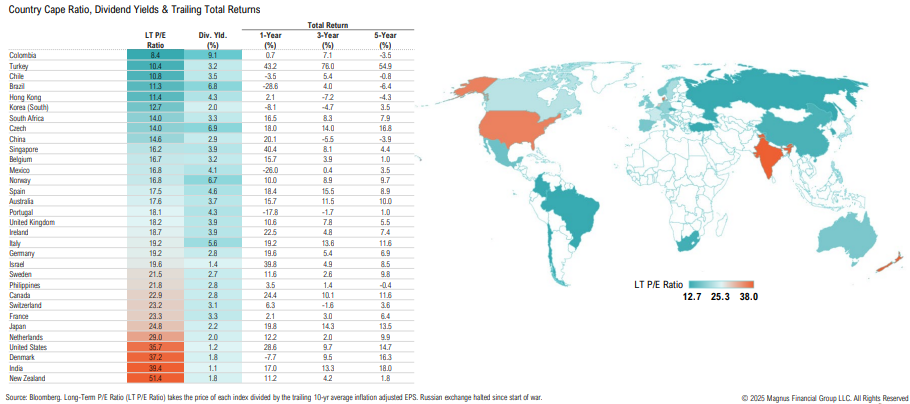
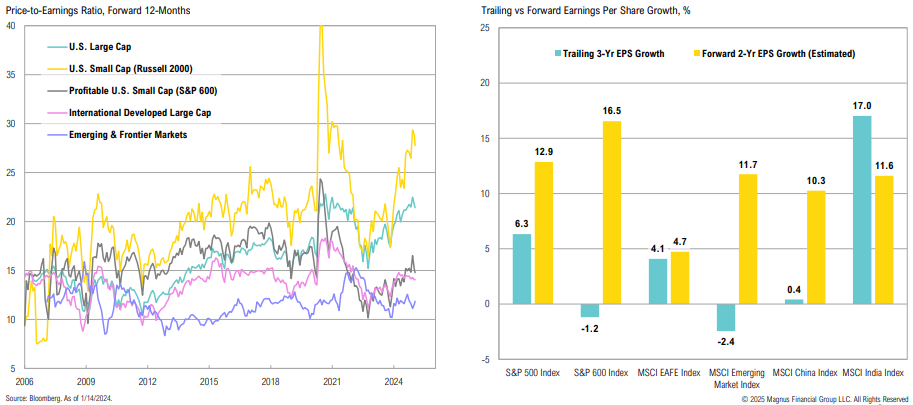
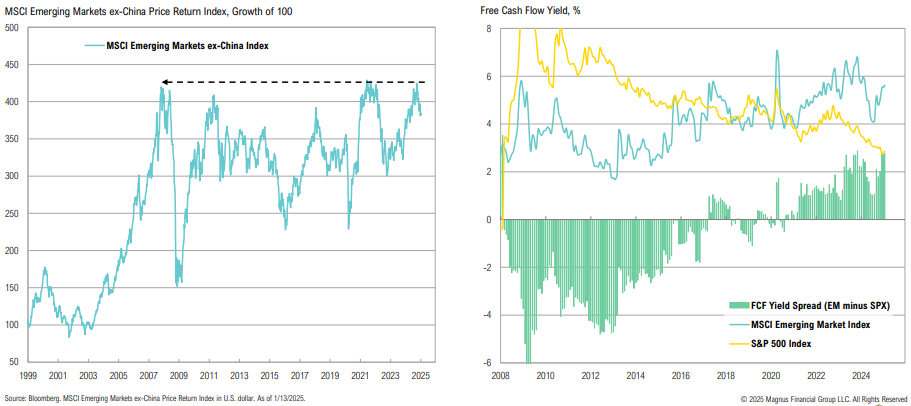
While EM ex-China stocks failed to break out of a 16-year resistance, they still appear attractively valued compared to U.S. large cap stocks; EM free cash flow yields are 2.8% higher than the S&P 500
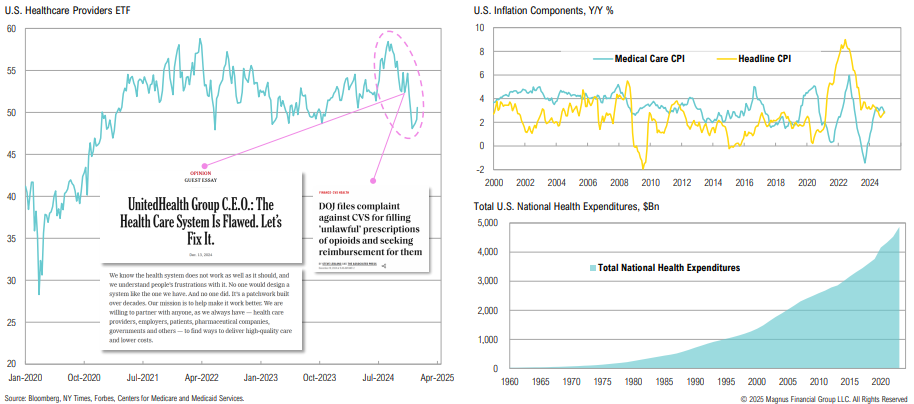
Healthcare stocks have been under pressure as various troubles plague the industry; government spending on health neared $5 trillion in 2023
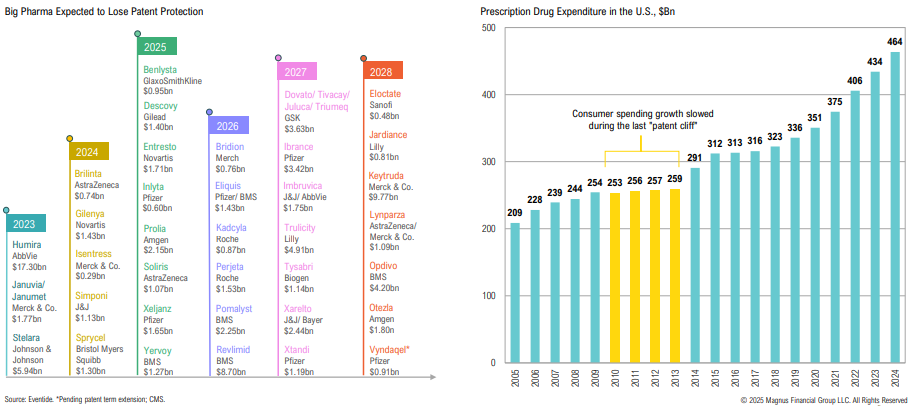
Big pharma faces a “patent cliff” which could impact more than $200Bn in annual revenue by 2030
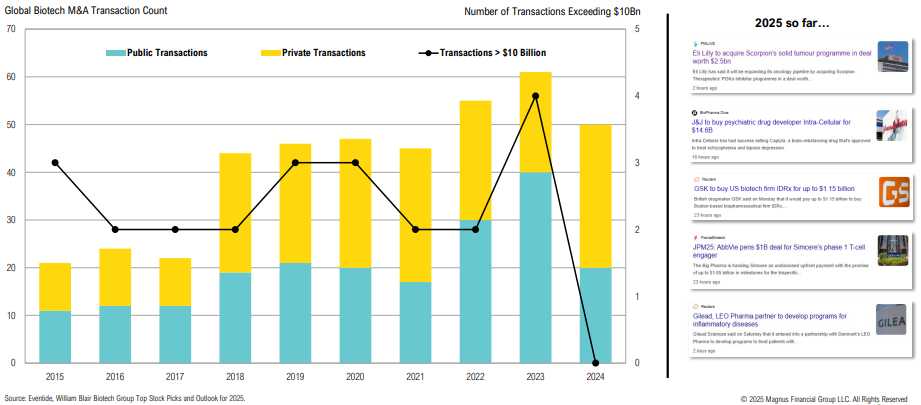
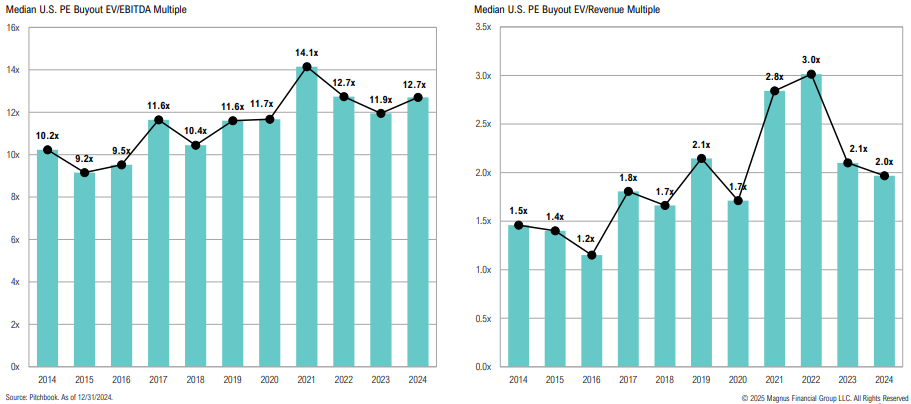
While M&A activity in 2024 was relatively healthy, deal sizes were small, with none >$10bn; 2025 is off to a strong start, with multiple deals already announced, including J&J’s $14.6bn transaction
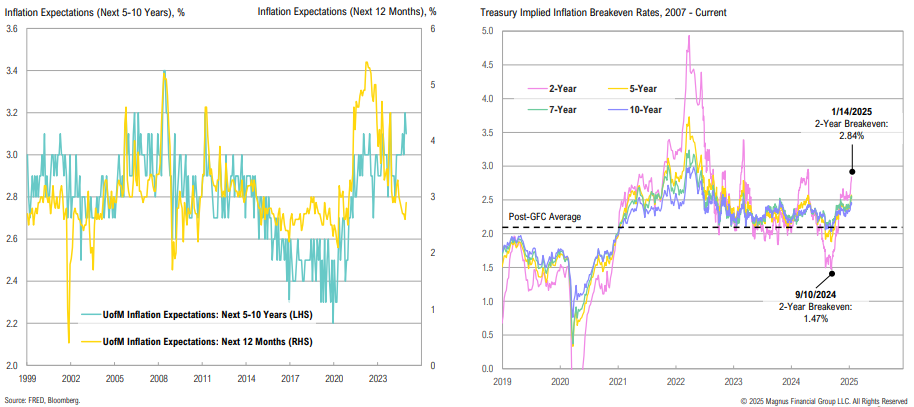
TIPS-implied inflation rates have been edging higher alongside declining 2025 rate cut expectations; short-and long-term inflation expectations have diverged
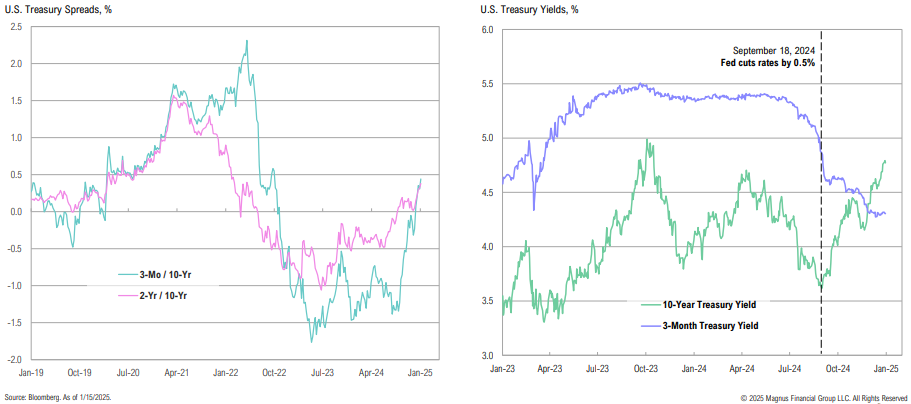
As evidenced by rising longer-term yields and simultaneously declining shorter-term yields, the Fed has little control over the long end
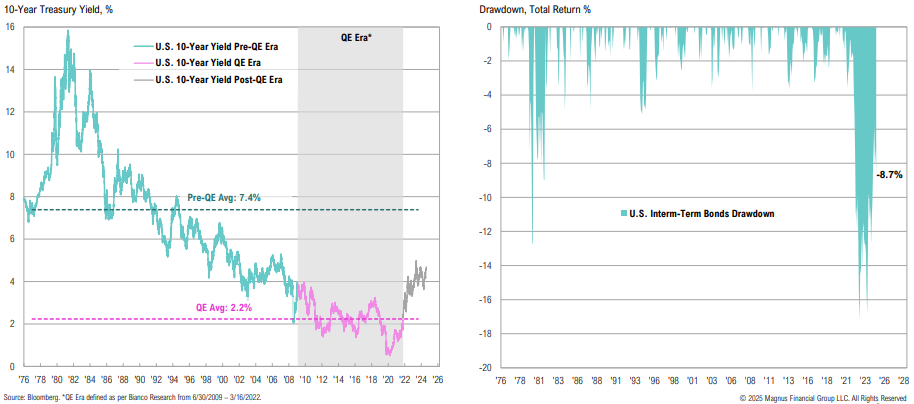
We are in the biggest bond bear market of all time; bonds peaked in August 2020 and have yet to recover
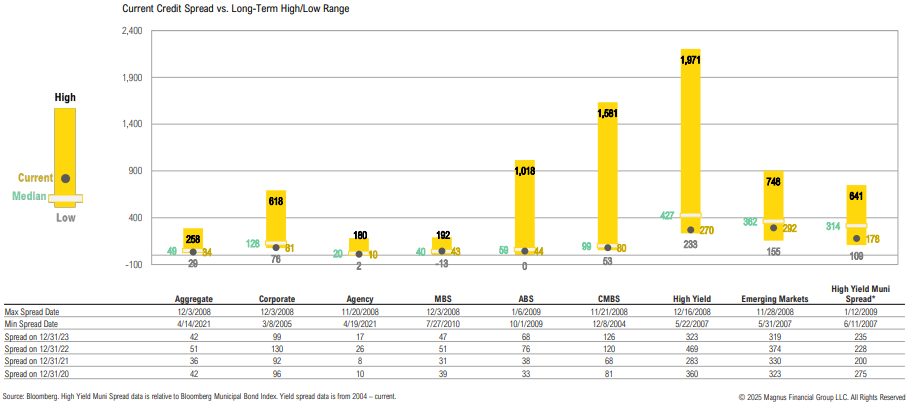
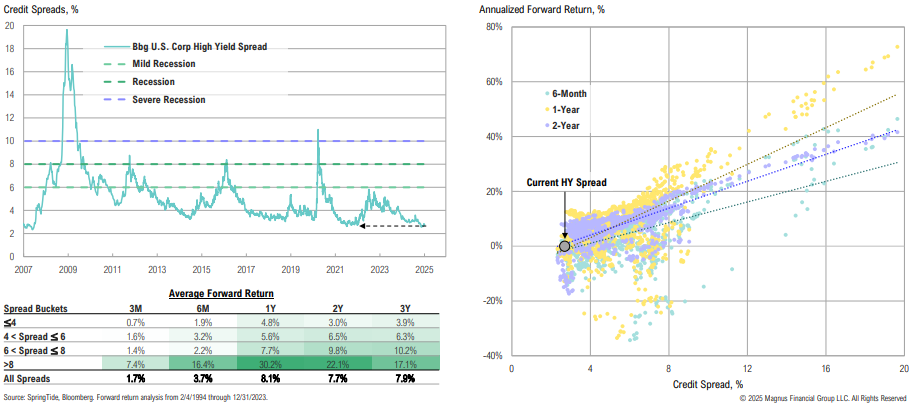
Credit spreads are near or below median across most sectors; high yield bond spreads at current levels continue to suggest that the economy may achieve a ‘soft landing’
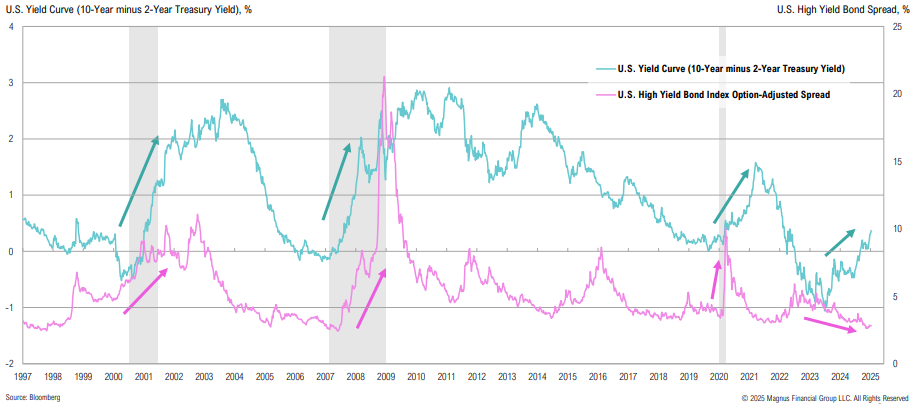
One of these cycles does not look like the others: credit spreads are at new cycle lows, while the yield curve continues to steepen
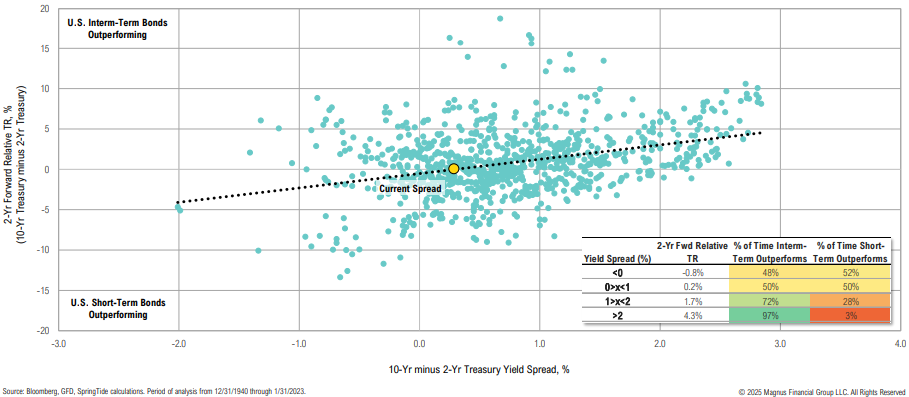
When the 2s10s spread is above 2%, investors should generally hold longer duration bonds; when it is between 1% and 2%, it is not a home run; and below 1% is a coin toss
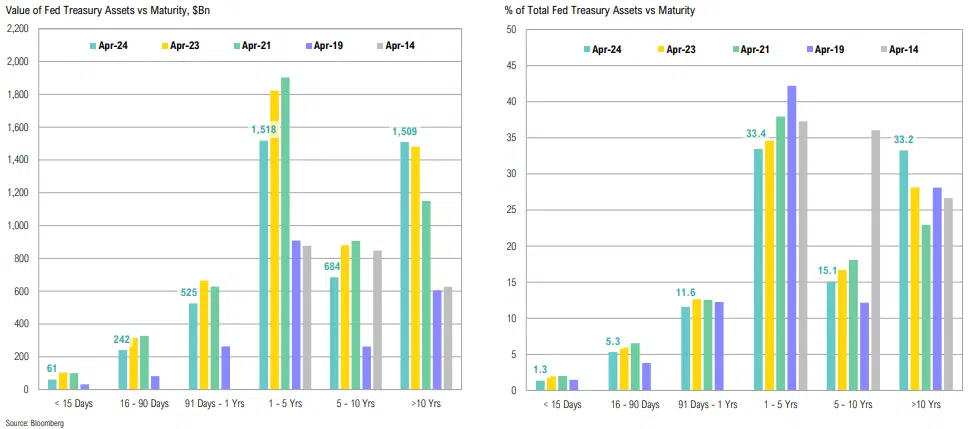
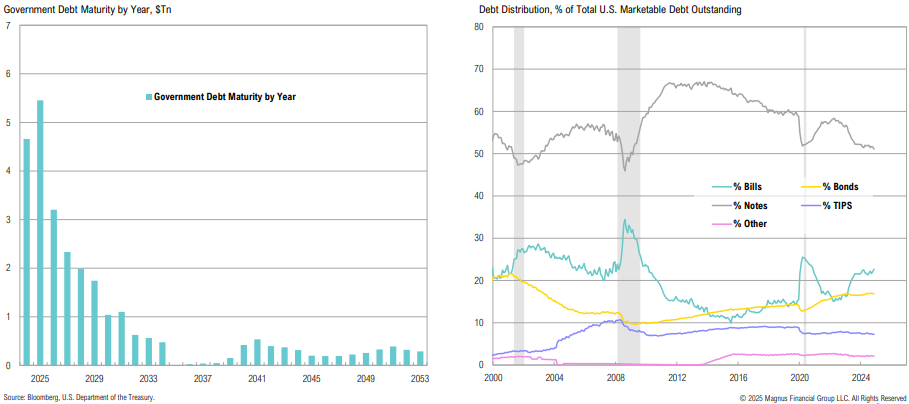
Over $5Tn in government debt matures in 2025, and will be rolled at much higher rates; bill issuance, which comprises over 22% of total debt, is expected to start declining this year
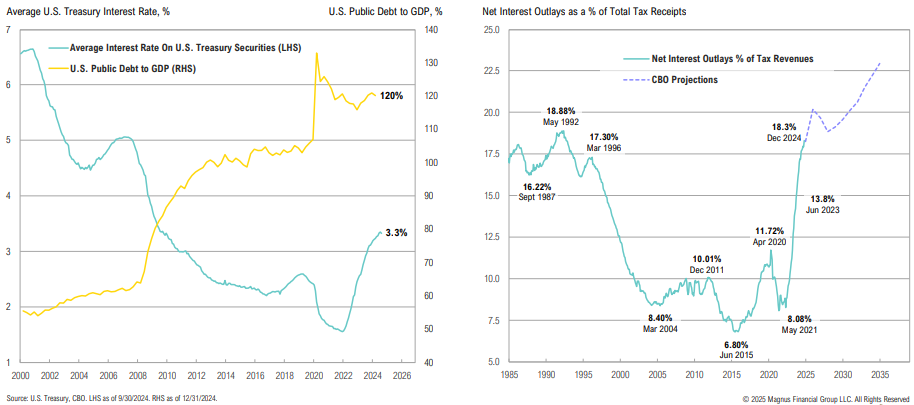
The average cost of Treasury debt outstanding has climbed to 3.3%, a level last seen when debt to GDP was ‘just’ 80%; tax receipts aren’t keeping pace, with over 18% of taxes going only to net interest payments
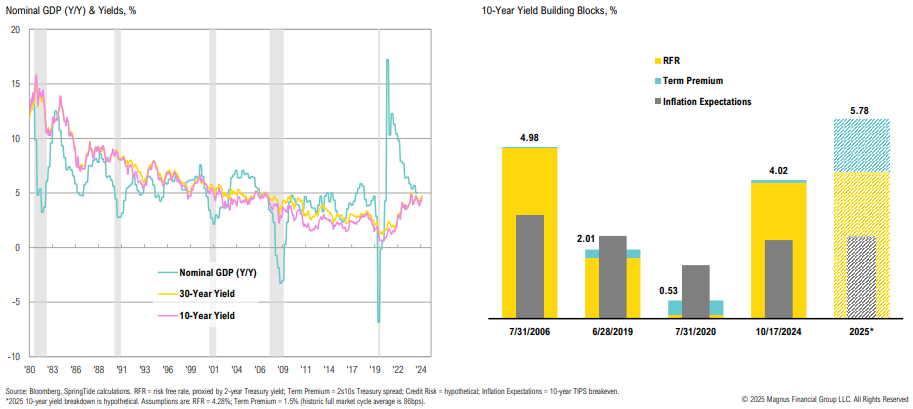
Historically, long-term yields tend to follow nominal GDP; pro-growth policy that drives up nominal GDP may have implications for bond yields
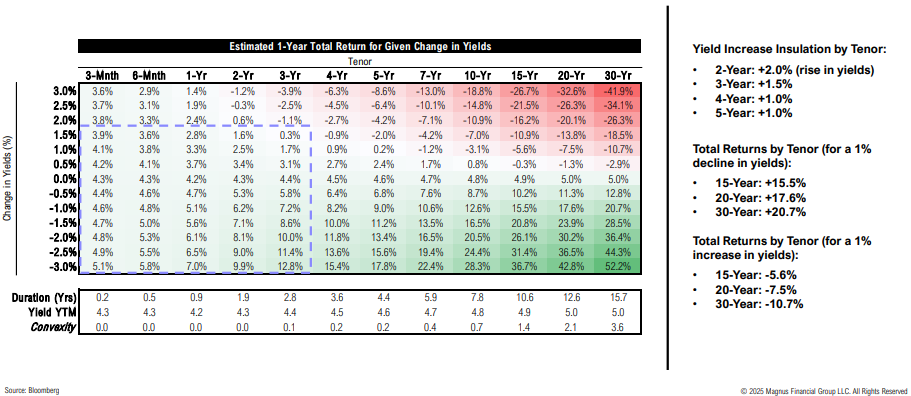
The 2–3-year part of yield curve has an attractive risk-reward profile—yields could rise 1.5% in the next year and total returns would still be positive
Not attractive: at ~274bps, credit spreads are in line with pre-COVID lows; low credit spreads continue to suggest runway for the economy (i.e., a ‘soft landing’)
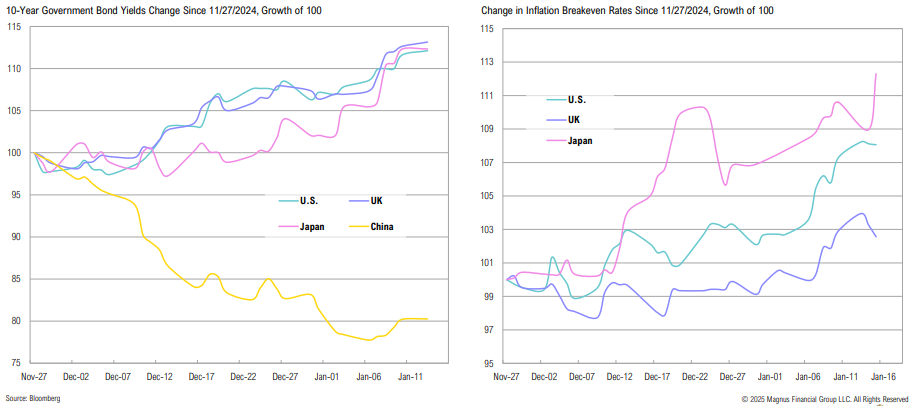
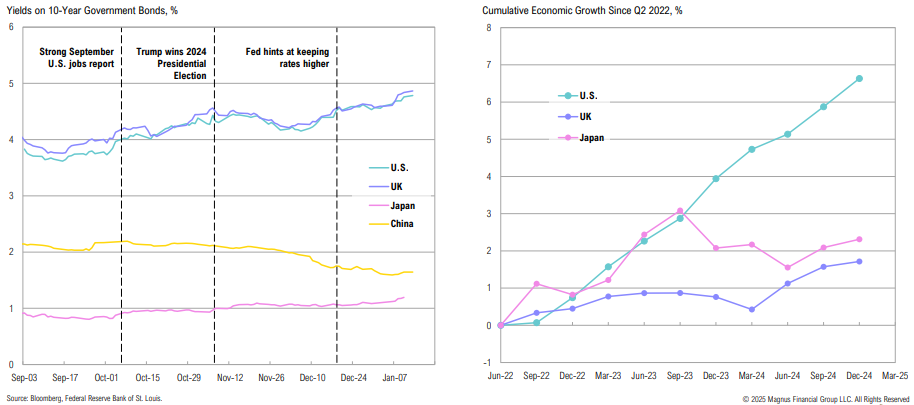
The recent rise in global bond yields has primarily been driven by higher long-term inflation expectations
Are rising U.S. Treasury yields also reflecting strong economic growth? Despite inflation well above target, U.S. economic growth has been far stronger than developed peers
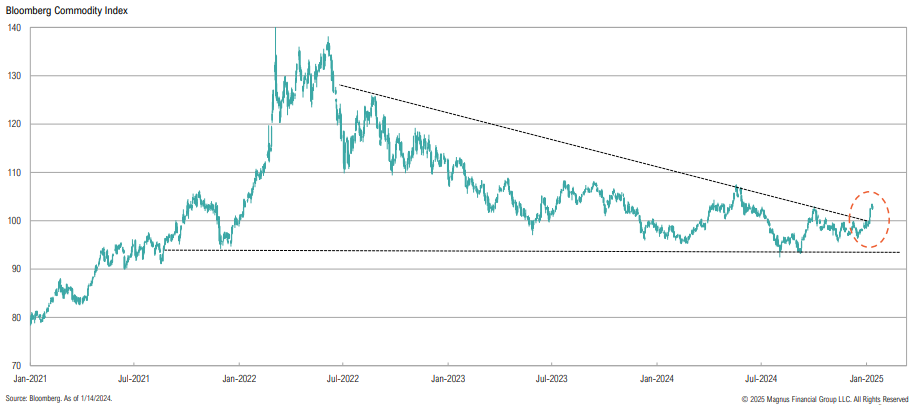
The recent breakout in commodities, which is primarily being driven by oil & gas, is interesting with the backdrop of a very strong dollar and weakness in China
AI remains a priority for U.S. companies; AI-related investments (including data centers and nuclear power projects) have accelerated
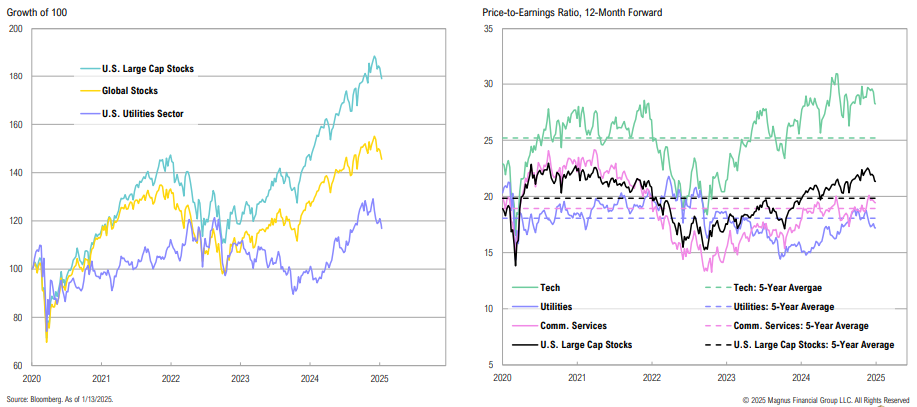
Despite rallying >23% in 2024, U.S. utilities have notably lagged both U.S. large cap stocks and global stocks over the past five years; utility valuations are below their 5-year averages
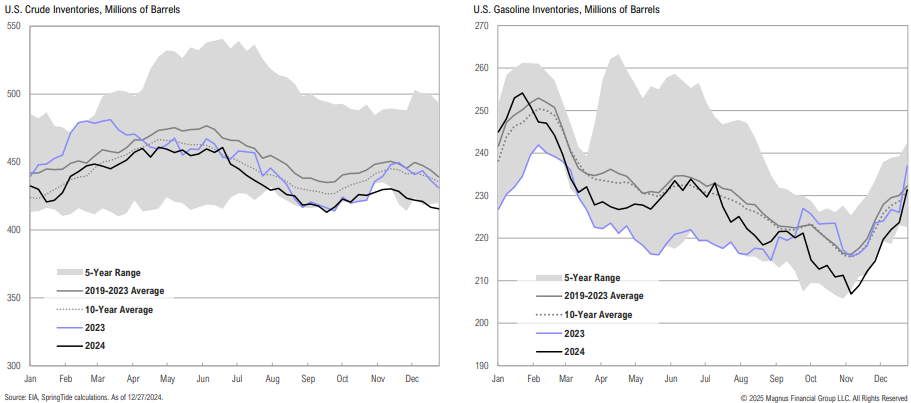
Crude inventories ended 2024 below the low end of their five-year range, while gasoline inventories ended in line with average levels due to higher refinery output
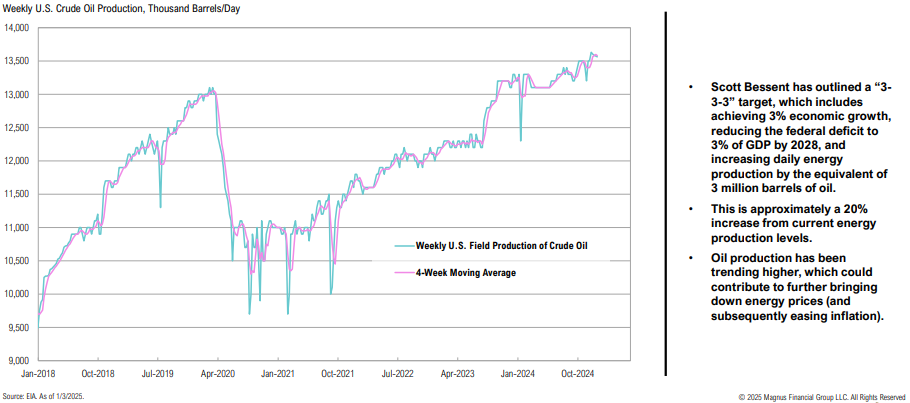
Part of the incoming administration’s plans are to increase U.S. energy production; oil production has been rising, once again surpassing pre-pandemic levels
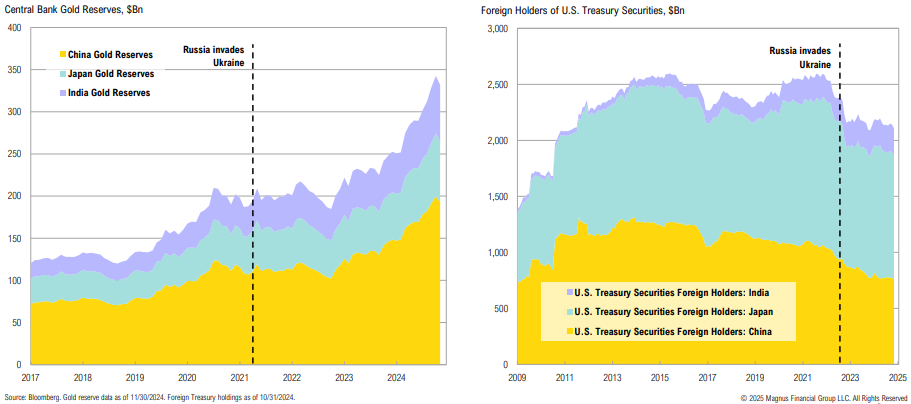
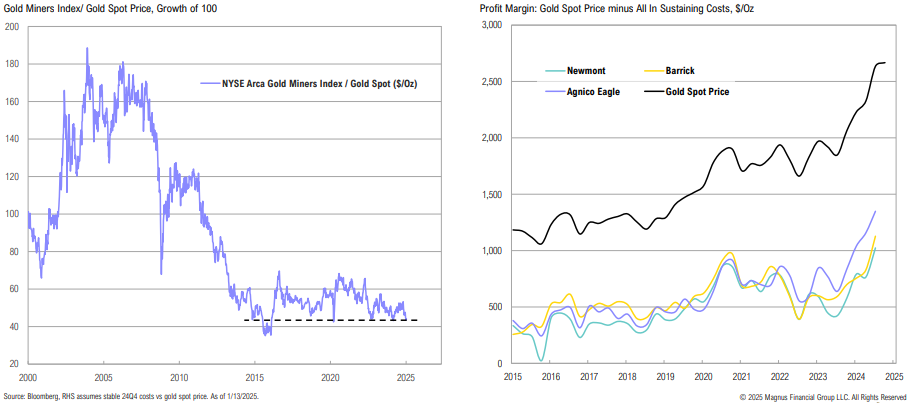
Accompanied by ‘flight to safety’ (geopolitics, U.S. fiscal situation), gold’s resilience despite higher real rates likely reflects sovereigns favoring gold; higher real rates remain a risk
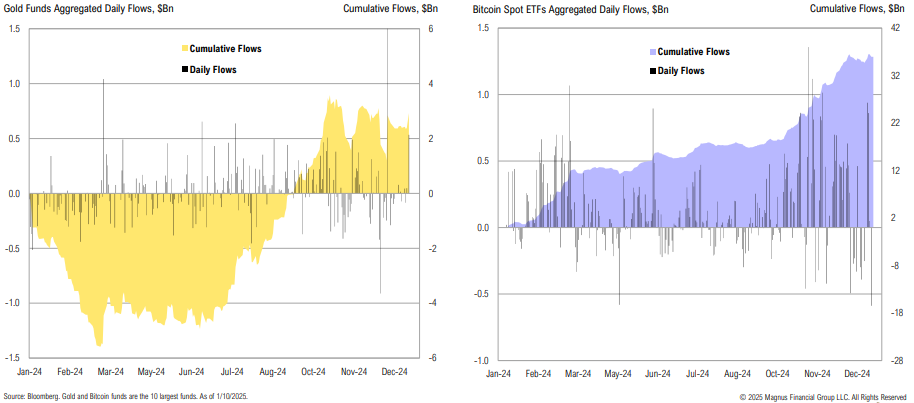
Gold fund flows started picking back up again in September; bitcoin flows have been more consistent and continue to rise as the price of bitcoin climbs
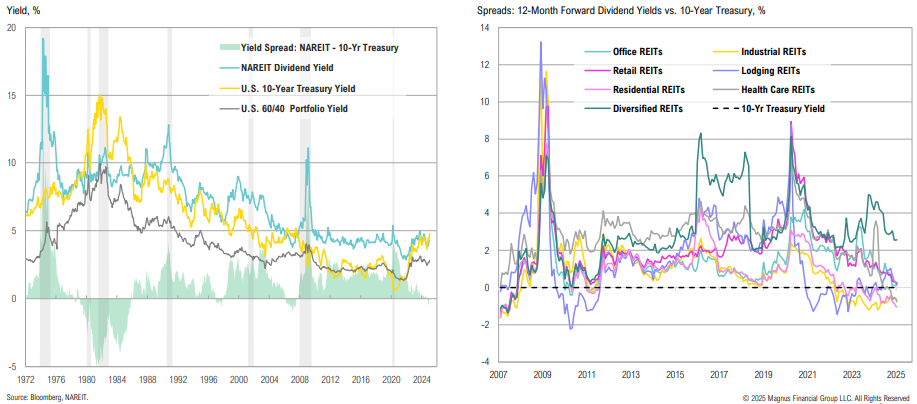
U.S. REITs are down >10% since the start of December, as higher yields have weighed on the asset class; despite the pullback, most REIT sectors still appear wholly unattractive on a relative yield basis
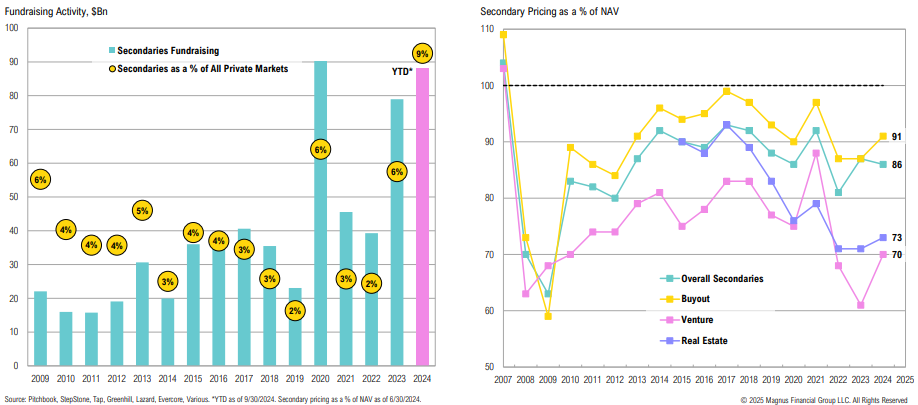
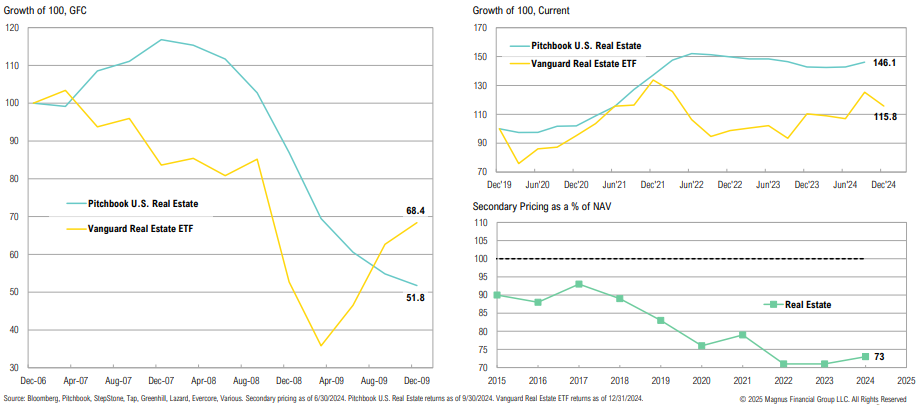
Private real estate funds have not marked down properties – while the gap has closed with public markets, secondary transactions remain at deep discounts
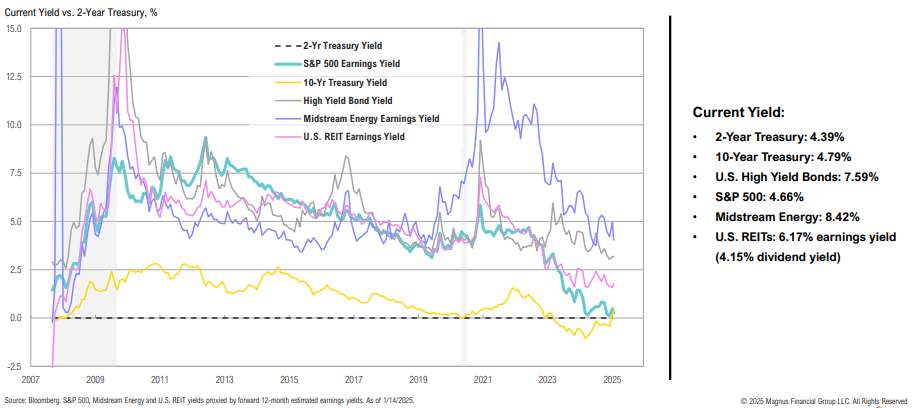
The relative yield case for high-yield bonds and REITs has been eroded by spread tightening/ higher Treasury yields
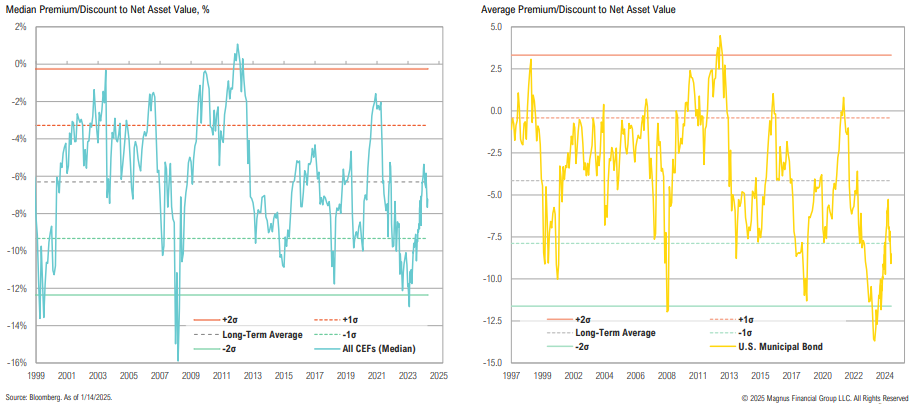
Median CEF discounts have been widening since last October and are now back below average levels; U.S. Muni CEF discounts are also more enticing, having widened from -5.3% to -9.1%
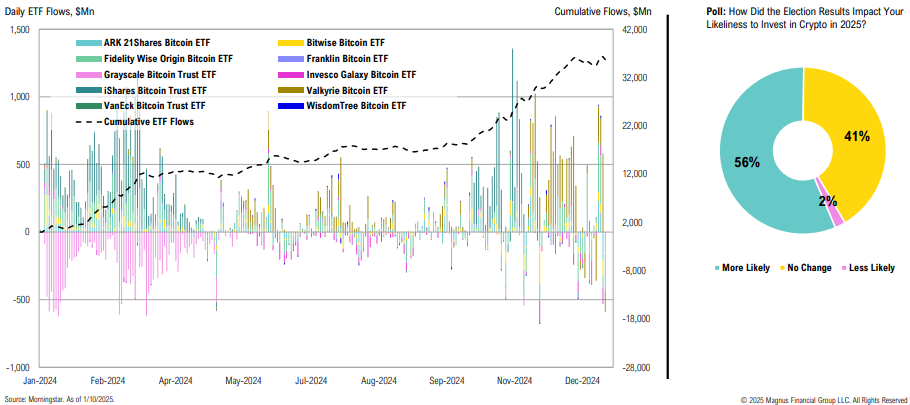
Bitcoin spot ETFs have stabilized and are moving higher again; the election outcome increased investor willingness to invest in crypto
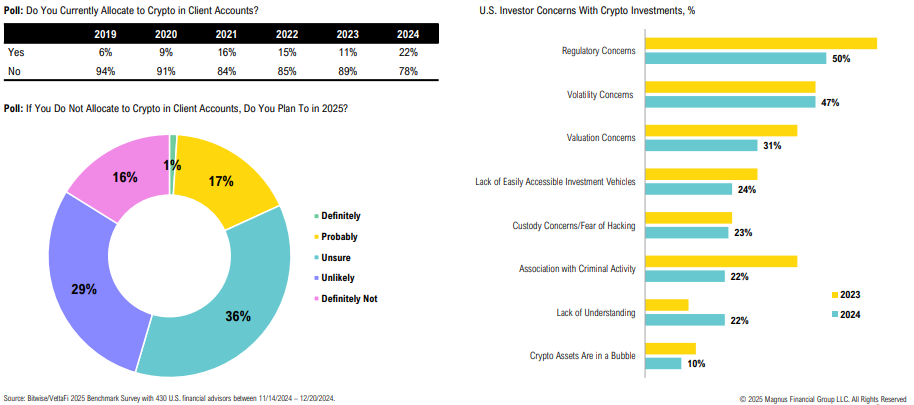
Is crypto starting to be recognized as a real asset class? Despite increased investment, financial advisors remain skeptical, with regulations and volatility key concerns
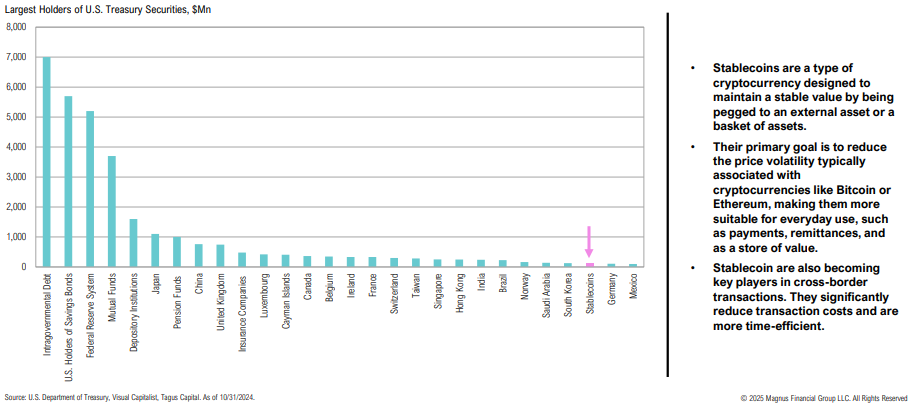
Stablecoins (at $120 billion) are the 26th largest holder of U.S. Treasury securities
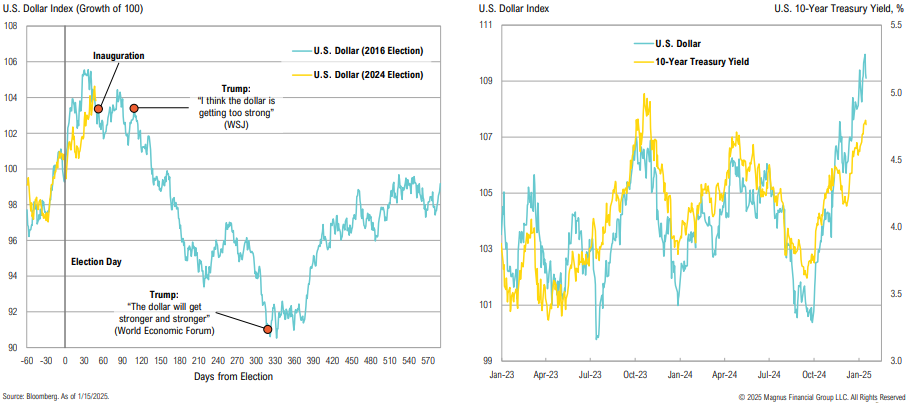
The USD reaction to this election is similar to what happened in 2016; a declining USD would likely require lower interest rates
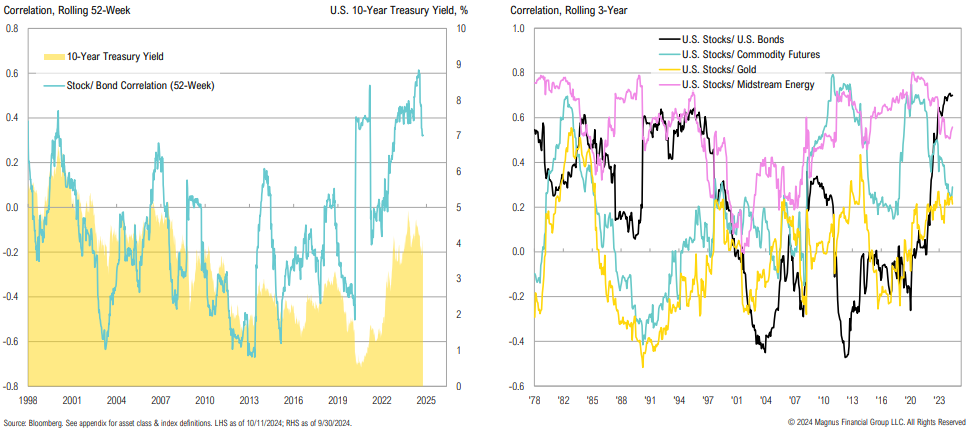
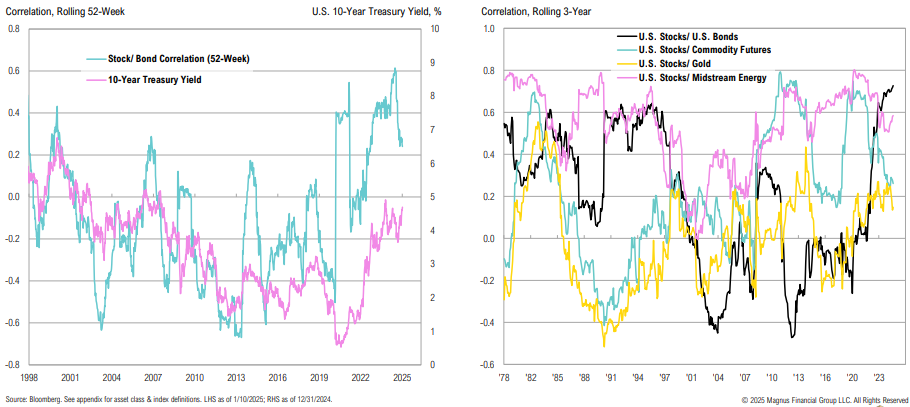
Bonds have recently provided less diversification benefits to stocks than other asset classes
Bonds have recently provided less diversification benefits to stocks than other asset classes; this would likely require hard-landing fears to change
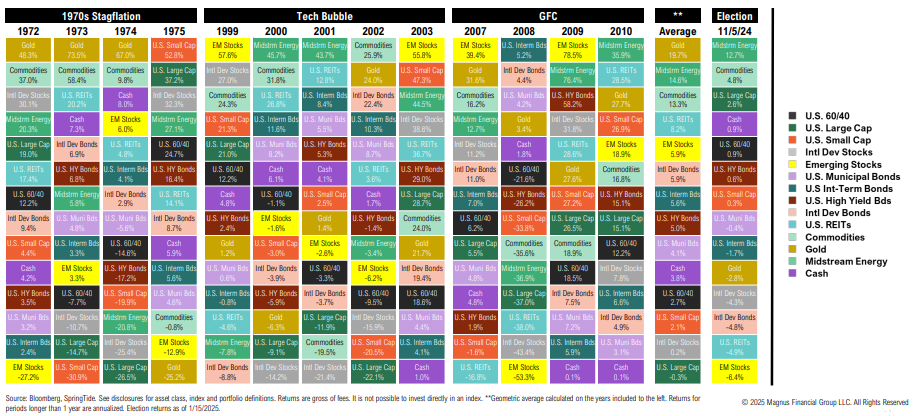
Even if not base case, returns during periods of stress (stagflation, bubble unwinds, banking crisis) contrast so starkly with the last 15 years that they should be considered
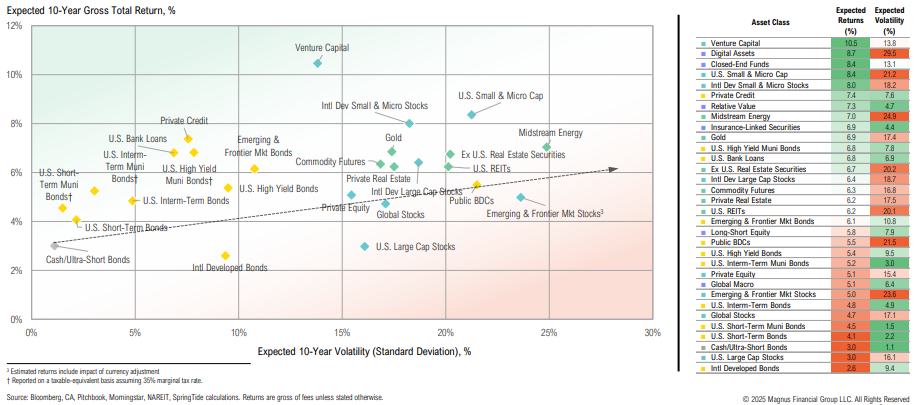
Higher equity valuations have resulted in more muted long-term forward returns, with bonds and credit looking relatively more attractive