
Money Like Water
The power of herd psychology to compel conformity and capitulation is nearly irresistible, making it essential that investors resist them.
– Howard Marks, Co-Founder of Oaktree Capital Management

Q4, 2022 MARKET REVIEW
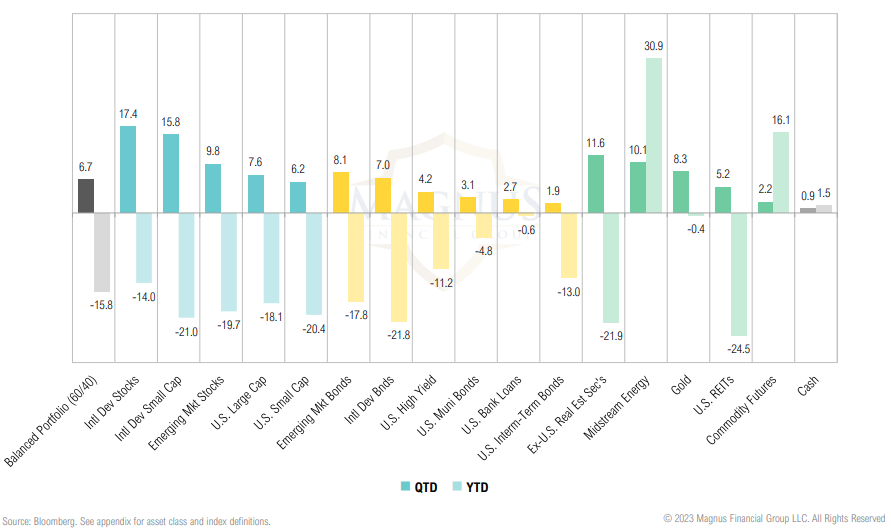
U.S. investors saw most investments rebound in the fourth quarter as both U.S. large cap stocks (+7.6%) and bonds (+1.9%) recovered together
Key themes for 2023
Era of tighter monetary policy – higher, but more volatile inflation underpinned by structurally constrained labor, housing and commodity markets; increased volatility due to stop-and-start policy. The economy and markets will be caught between a timid Fed fearful of a 1970s “Burns” error and fiscal stimulus that could goose growth.
Structurally lower real growth, with potential stagflation – inflation erodes real growth; high debt levels, poor demographics and sustained deficits will continue to impede growth in Europe, Japan. Based on the shape of the yield curve and recession models, a recession in 2023 is the base case, but the outlook could be better or worse.
Consumers spending themselves into a wall – real incomes lagging inflation; U.S. consumer is incrementally exhausting COVID stimulus, increasingly relying on credit to maintain spending; combined hit from slowing economy and rising interest rates spells trouble for 2023/2024.
Policy will be stop-and-start but mostly restrictive – mostly constrained but potentially also quite contradictory as rolling ad hoc fiscal (and monetary) bailouts frustrates attempts to rein in inflation.
Be patient, wait for pricing to improve or central banks to pivot – bear markets don’t usually bottom until equity valuations get cheap and/or central banks pivot (pause ≠ pivot); market has never bottomed ahead of official start of recession and recession unlikely to start until labor market cracks. This time may be different, but the macro backdrop is challenging enough to err on the side of caution.
Tilt to quality and cash flow – the lesson from prior bubble unwinds is patience. While we are excited about the potential opportunity set in equities, we don’t think we are there yet; prefer to “hide out” in areas with strong balance sheets and highest cash flow yields (quality, dividends).
Moving to neutral for U.S./non-U.S. – Foreign stocks have been a value trap for many years, but the valuation spread reached an actionable extreme last quarter; it is time to consider going to neutral, potentially overweighting.
Paid to wait – finally getting paid to wait; better yields on short-term invest. grade bonds reduces the risk of a wait-and-see approach to the rapidly evolving macro, policy and market backdrop, if paired with policy hedges.
Keep duration low – fighting the temptation to increase bond duration because of concerns around path of inflation, Fed’s resolve once labor market breaks or U.S. credit event but maintaining modest duration barbell and gold allocation as a hedge against a premature pivot.
Budding opportunity in high yield bonds, other credit – high yield bonds near compelling level on an absolute & relative basis, except in the tails (right tail = early pivot, inflation; left tail = no pivot, severe recession).
Positive-carry policy hedge – midstream energy, gold miners and commodity futures now have positive carry and may provide a hedge if the Fed pivots early. Conversely, these hedges may underperform in a severe recession.
Opportunities emerging in real estate – maintain underweight (held since pandemic demand shock), waiting for dust to settle on higher rates, migration/ demographic, social and now recession-related disruption; expect to deploy in 2023/2024.
Volatility = opportunity – recession, if we enter one, usually see structural increases in vol; this = improved opportunity set for value-biased active managers, higher cost of capital rewards nimble fundamental managers.
Opportunity for dynamic asset allocation and active management – a period of stop-and-start growth, inflation, policy and trends in asset markets should benefit value-biased dynamic over static asset allocations.
GROWTH, INFLATION & POLICY
The timing of moderating rate increases is far less significant than the questions of how much further we will need to raise rates to control inflation, and the length of time it will be necessary to hold policy at a restrictive level. It is likely that restoring price stability will require holding policy at a restrictive level for some time. History cautions strongly against prematurely loosening policy.
– Jerome Powell, Federal Reserve Chairman
GDP & INFLATION
With the benefit of hindsight, the “Great Moderation” was just a persistent policy put resulting from historically low inflation
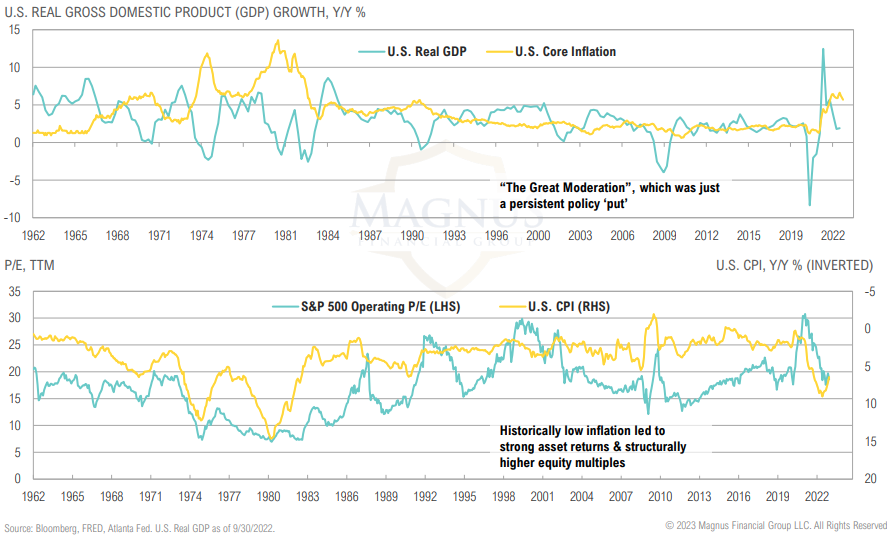
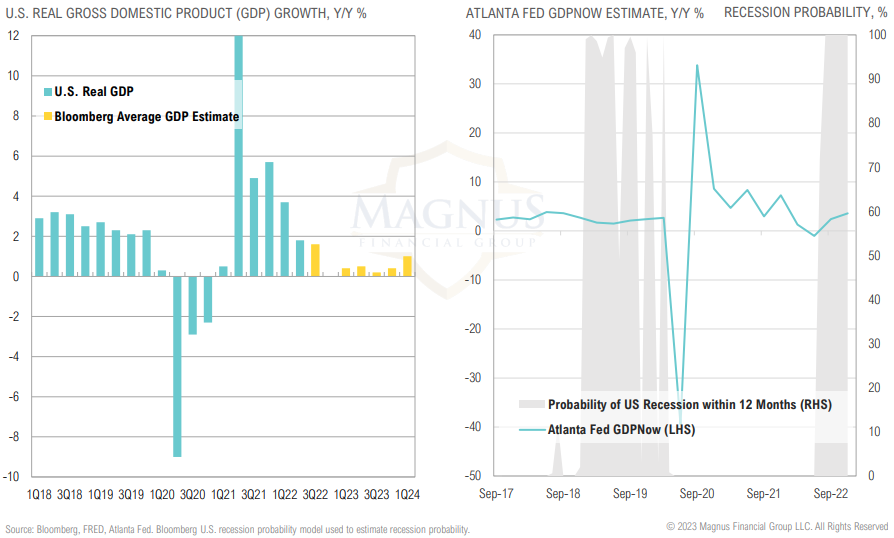
GDP
Most economic models suggest the potential for recession in next 12 months is high, arguably assured
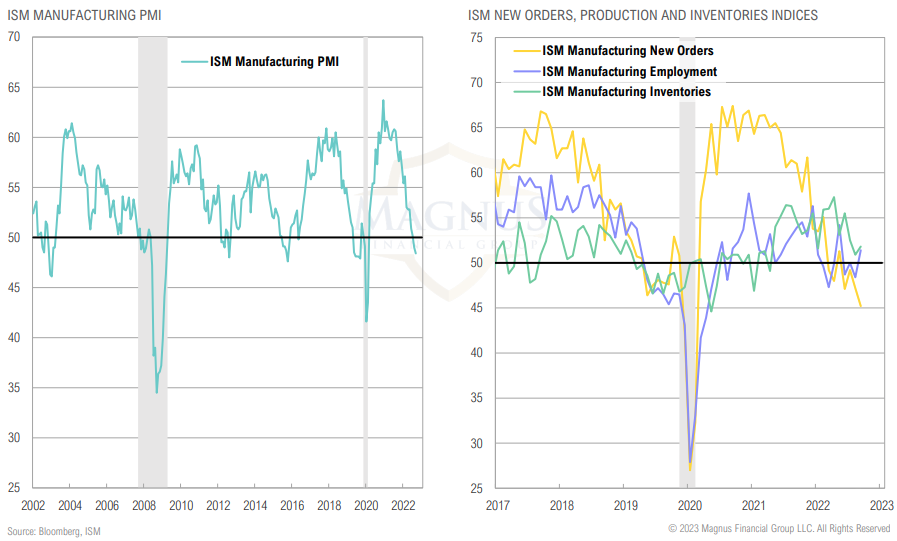
MANUFACTURING & INVENTORIES
ISM Manufacturing PMI is in contraction; increases in inventories have slowed, while employment has been oscillating between contraction and expansion
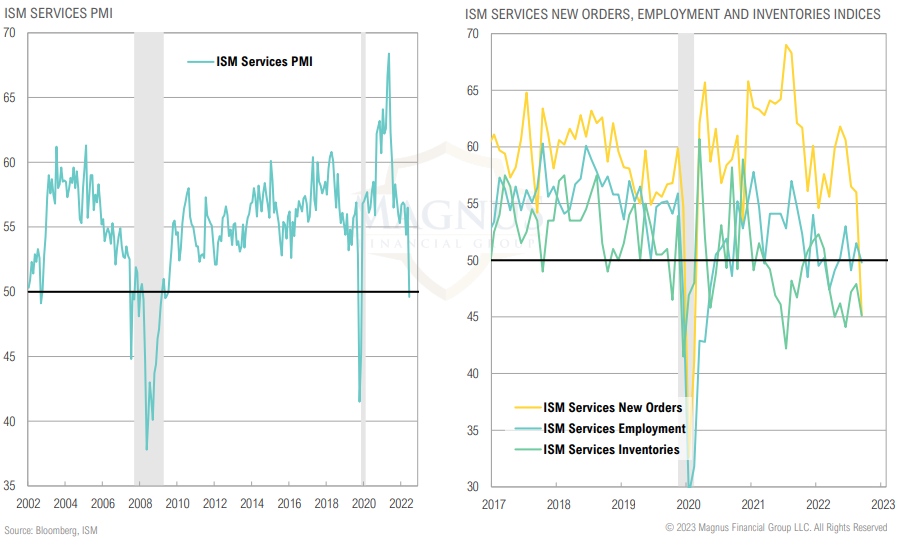
SERVICES & INVENTORIES
ISM Services now also in contraction but perhaps in healthier shape as consumer spending shifts from goods to services; services new orders have plummeted
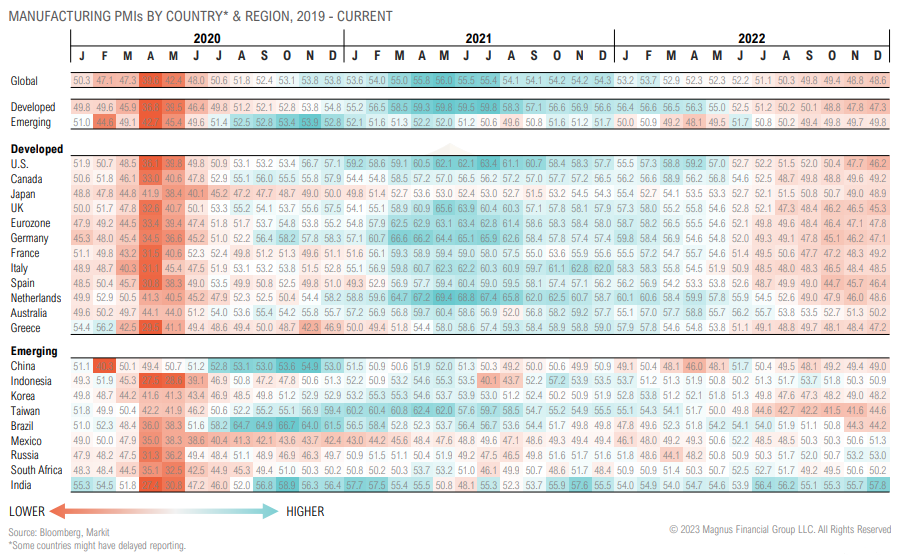
GLOBAL GROWTH
Global manufacturing activity slipped lower in December as developed market and emerging market activity continue to contract
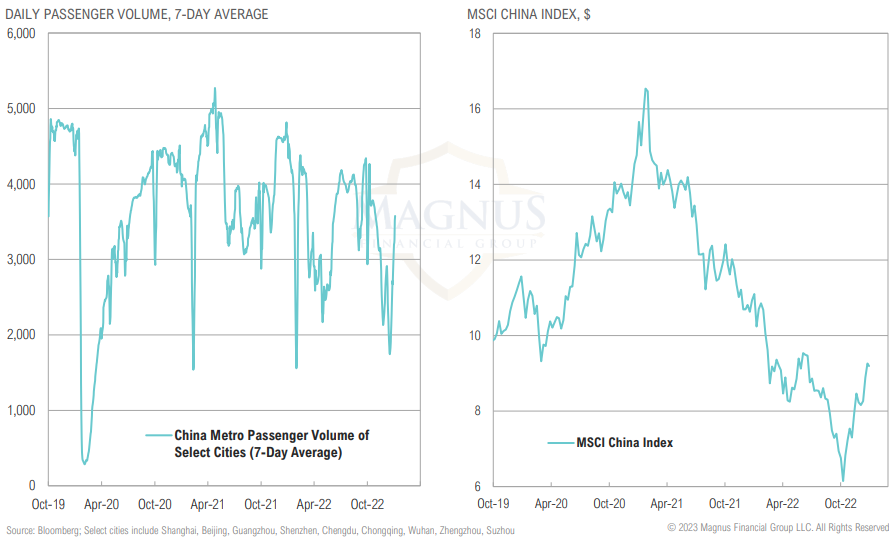
Following civilian protests, it appears mobility in China is increasing rapidly, potentially signaling an end to zero-COVID policy
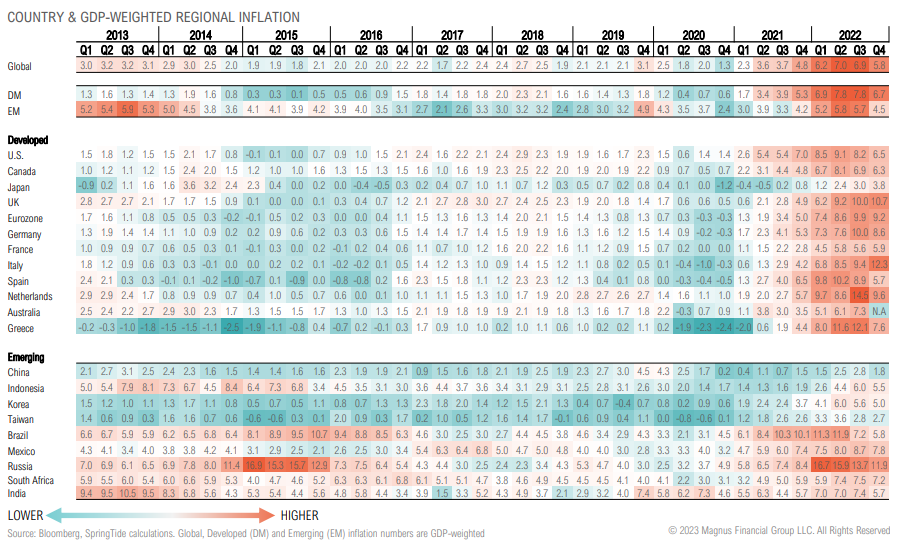
GLOBAL INFLATION
Pre-Russian invasion, global inflation was already at a decade high due to lack of investment in commodity supply, labor tightness, rising housing prices, supply chain bottlenecks, etc.
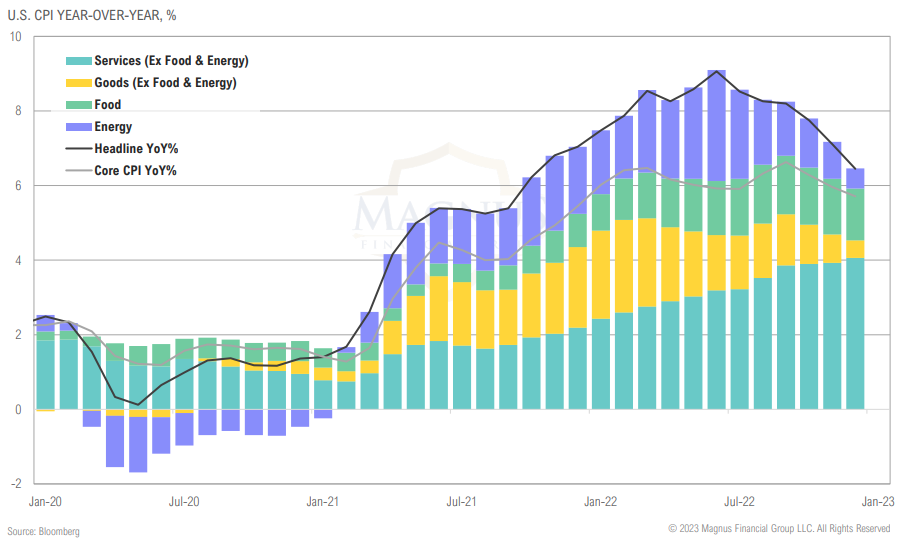
INFLATION
Headline inflation declines largely driven by lower energy and goods prices; core inflation proving more sticky, due to lags in shelter and persistent services inflation
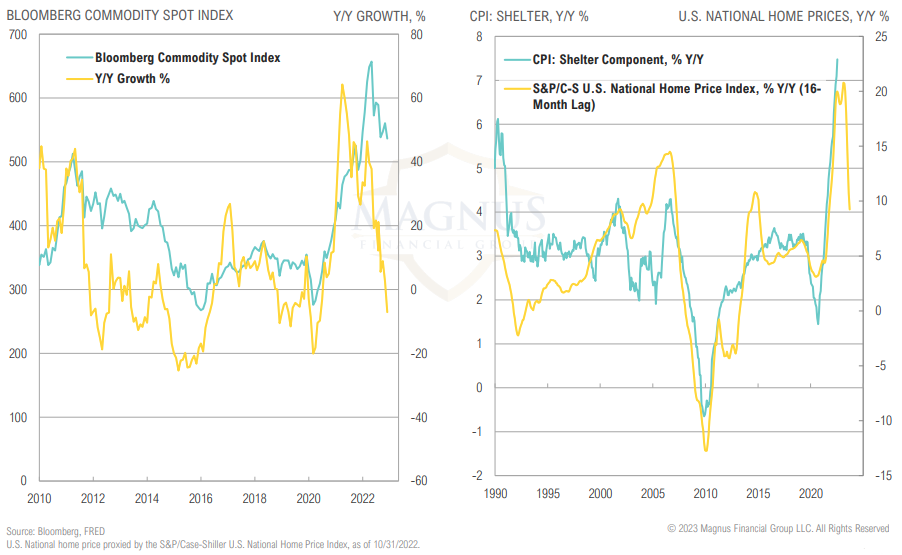
COMMODITIES & SHELTER
While commodity prices rolling over will help contain inflation, house prices impact the shelter component of CPI with a 12- to 18-month lag
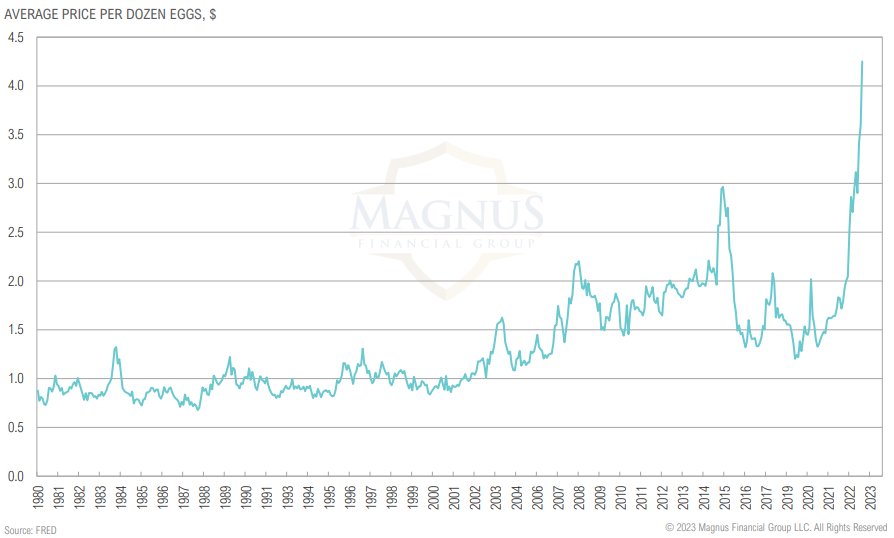
INFLATION
The price of a dozen eggs has more than doubled over the last year
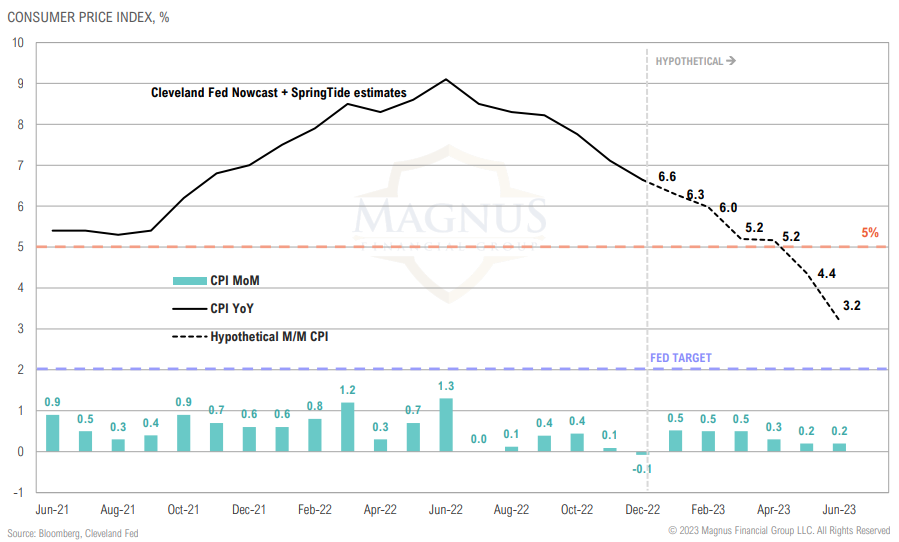
CPI
It is likely that YoY CPI will remain above 5% through Q1 of 2023
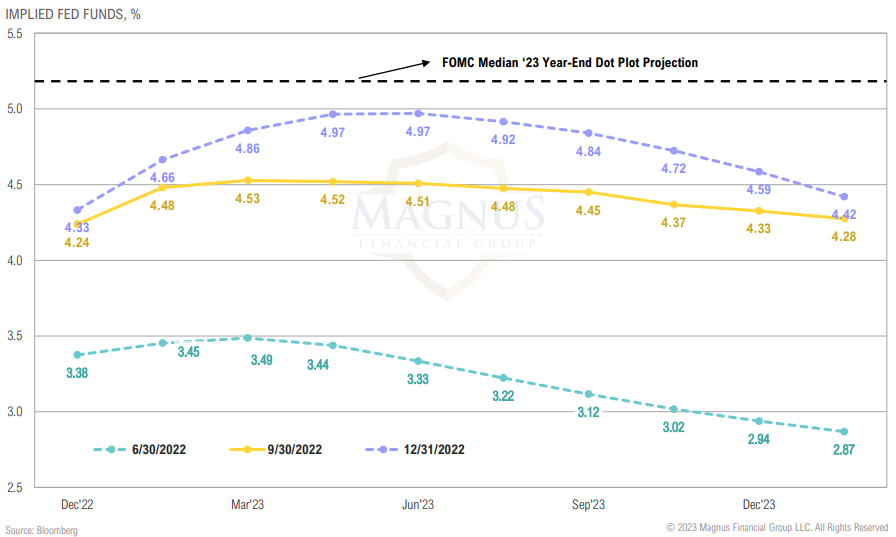
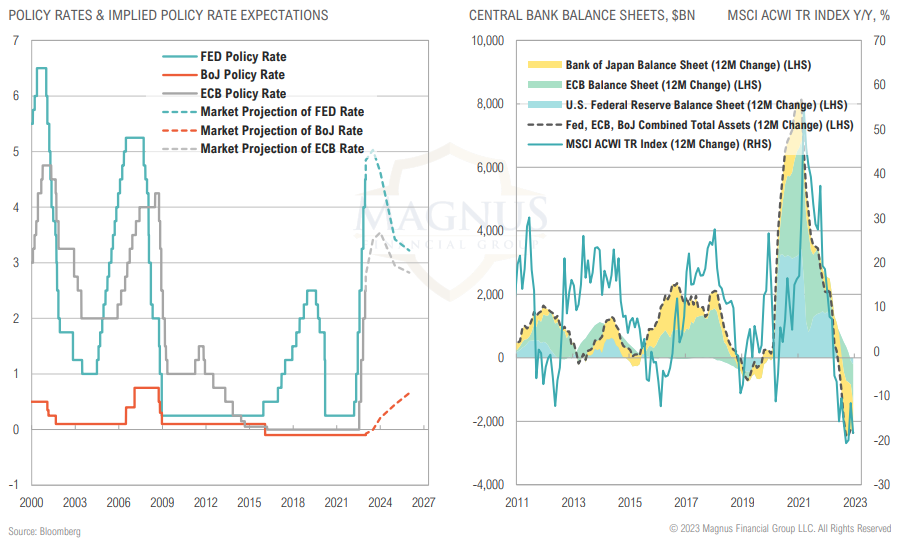
IMPLIED FED FUNDS
While the implied Fed funds rate has moved substantially higher over the year, the market still isn’t buying into the Fed’s “higher for longer” posturing
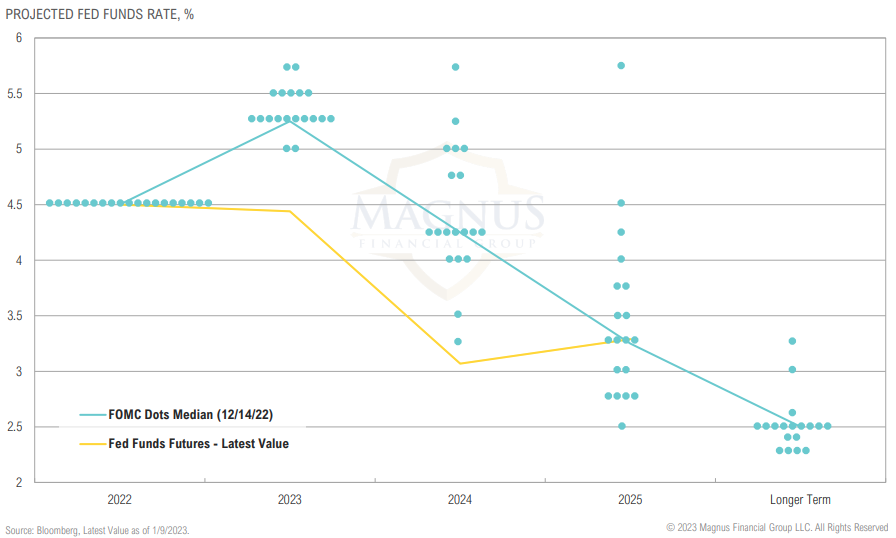
THE FED PIVOT
Market continues to price in a Fed pivot in 2023, despite the Fed signaling otherwise
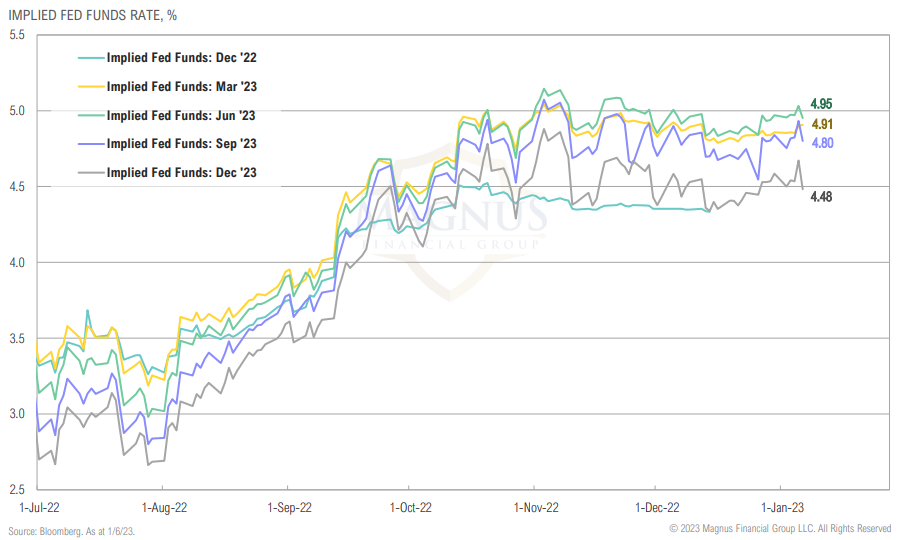
RATE HIKE EXPECTATIONS
Fed funds futures expecting peak rates in June 2023 and the Fed to start cutting rates in the second half of the year; Fed and market have both been poor in projecting rates 12 months out
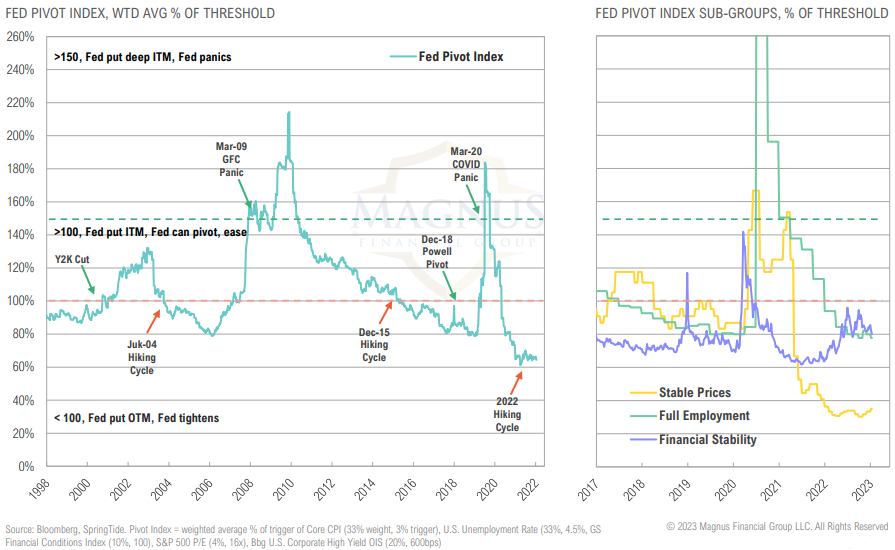
THE FED PIVOT INDEX
A Fed pivot at current levels isn’t justified by the data and would risk extending inflation shock and further eroding Fed’s credibility
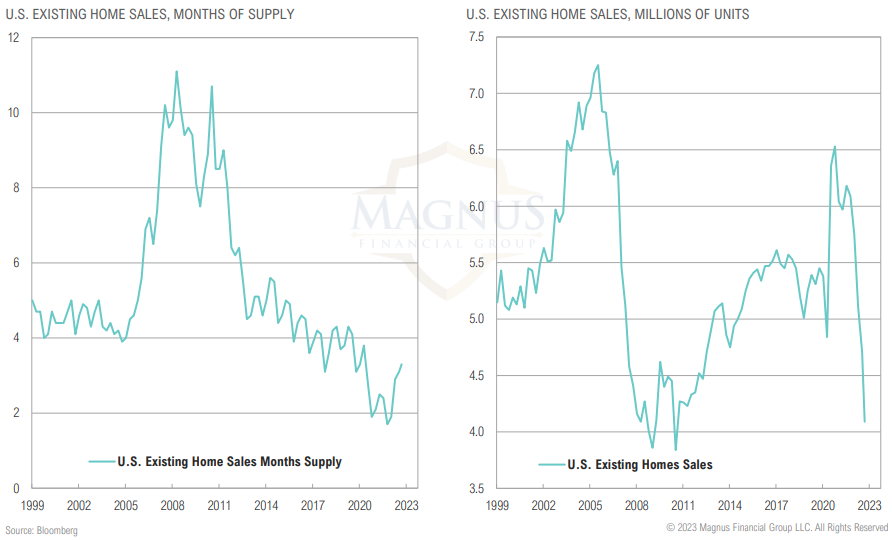
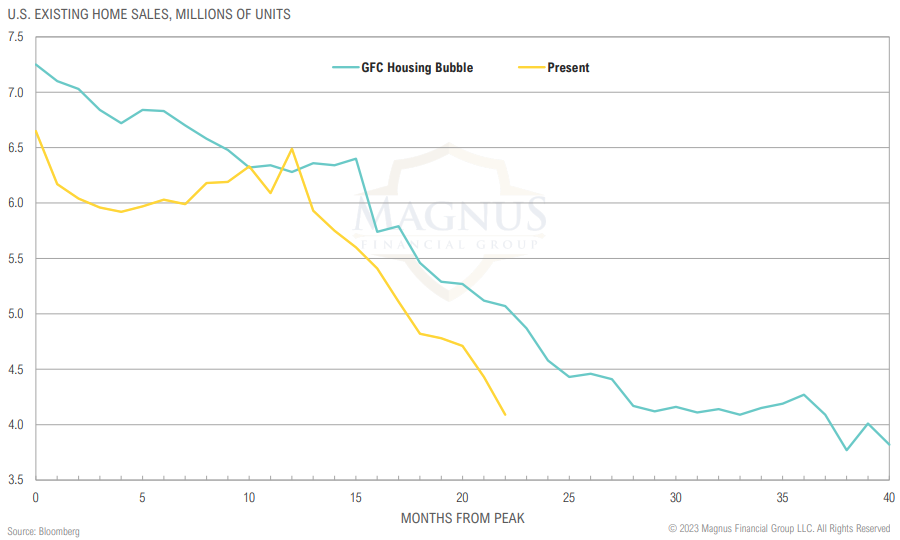
MORTGAGE RATES
Existing home sales have fallen by 2.5m over the past 22 months, which is a faster decline than during GFC; the difference between now and then is that supply of homes remains low
Existing home sales have fallen by 2.5m over the past 22 months, which is a faster decline than during GFC; the difference between now and then is that supply of homes remains low
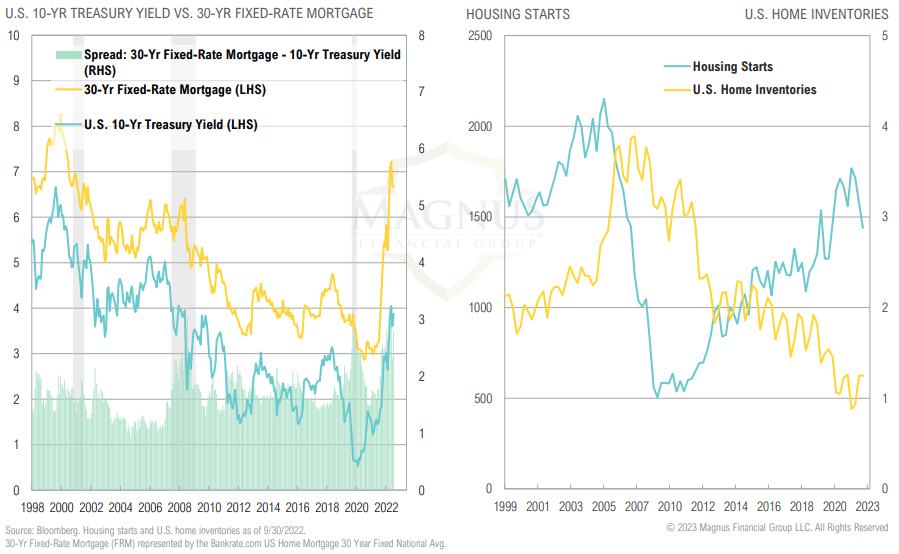
30-year fixed mortgage rates were unchanged in December, resulting in tighter mortgage rate spreads vs. 10-year Treasuries; increased rates in ‘22 will have a negative impact on housing and consumers with a lag
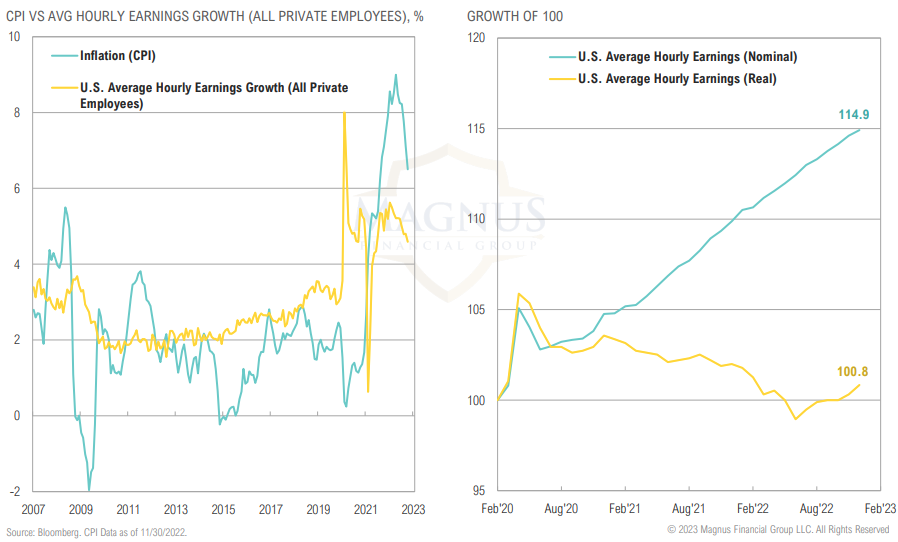
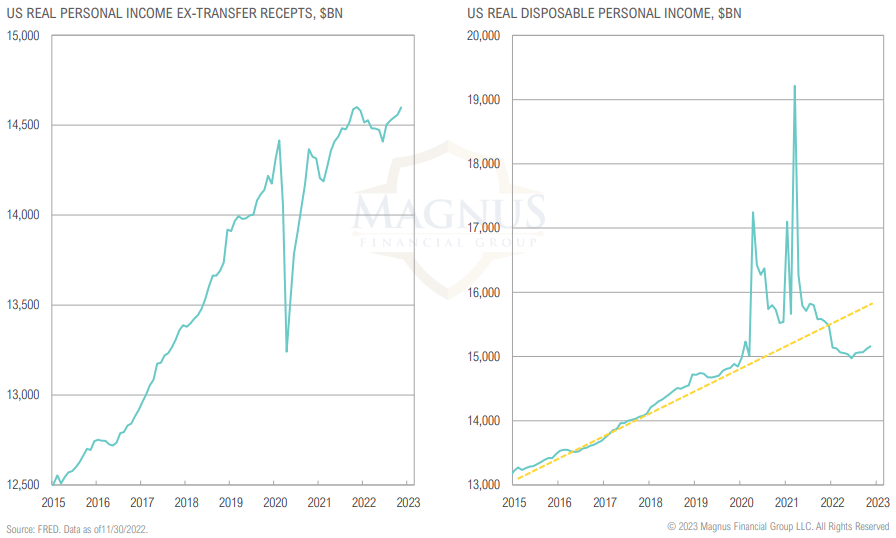
REAL EARNINGS
Since early 2021, inflation has outpaced wage growth, eroding real household disposable income
PERSONAL INCOME
Real income, excluding government transfers, is still grinding higher; total disposable income, however, has been treading water in recent months
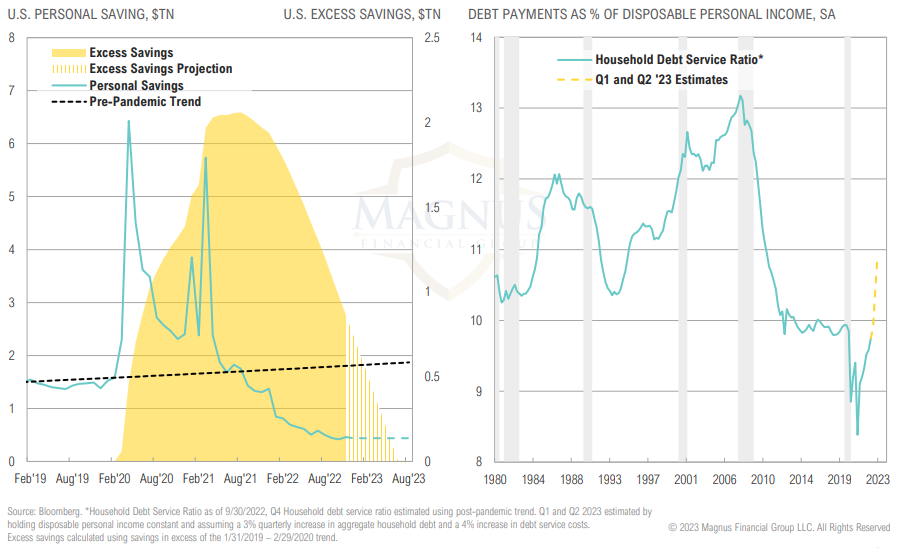
PERSONAL SAVINGS & DEBT PAYMENTS
Personal savings rates have plummeted to 2.4% vs 5-year pre-Covid average of 7.6%; if this savings rate continues, excess savings from Covid will be depleted by June ‘23
OPPORTUNISTIC
MONETARY POLICY & GLOBAL STOCKS
Global quantitative easing efforts supported the recent gains in global stocks; Fed, ECB and BoJ combined 12M change in assets have been negative since June ‘22
EQUITY
2021 was the most speculative year in markets I’d seen in 40 years. I dubbed it the “Dot Com era on steroids”. I never thought, after 2000, I would see investors do just completely insane things they were doing in 1999 and 2000 again. I was wrong and I was wrong in a big way.
I don’t think we appreciate in 2020 and 2021 the confluence of events that all came together in one witch’s brew of insanity. You had $5 trillion of fiscal stimulus, almost 25% of GDP, was literally pumped into economy in 12 months on top of the Federal Reserve’s zero interest rate policy and QE. So the most fiscal stimulus ever on top liberal monetary policy ever all coming together.
– Jim Chanos, Founder & President of Kynikos Associates
Excesses in one direction will lead to an opposite excess in the other direction.
– Bob Farrell, Merrill Lynch Strategist and Market Historian (Bob Farrell’s 10 Rules)
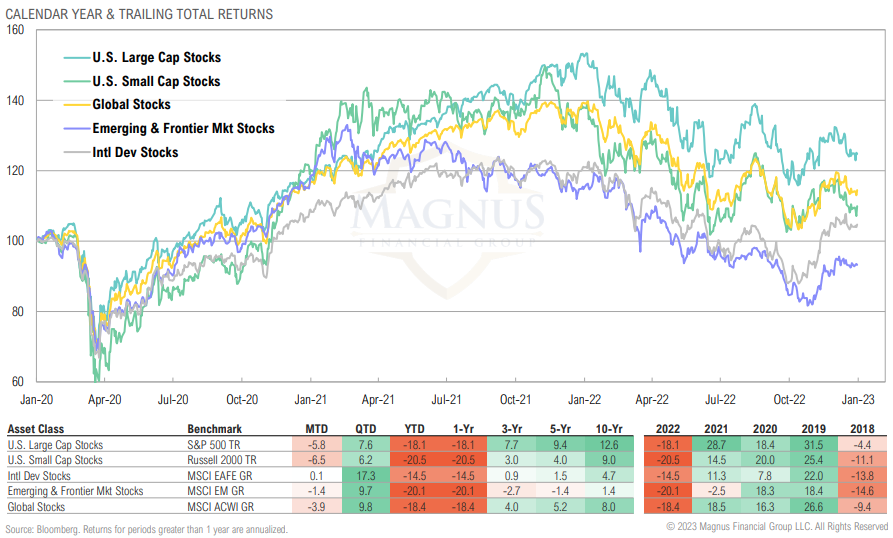
MARKET RETURNS SUMMARY
U.S. stocks underperformed their international peers over the fourth quarter, largely driven by a weaker dollar; DM stocks held up best over the year, driven by a mammoth Q4 rebound
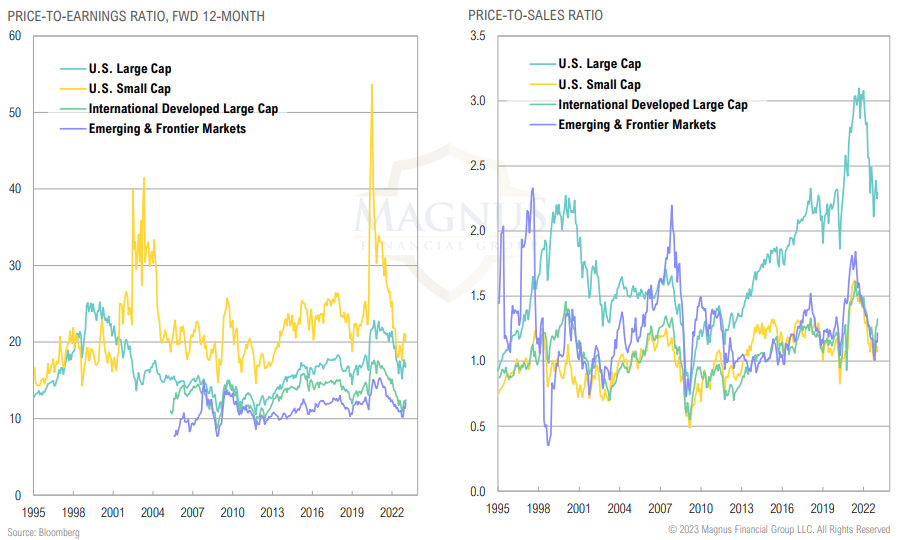
VALUATIONS
Valuations contracted over 2022 as stocks sold off globally
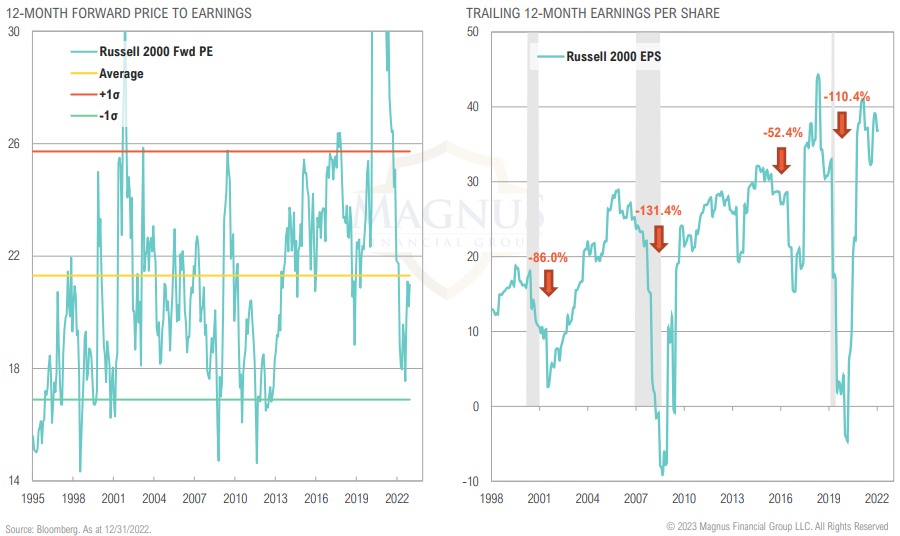
RUSSELL 2000 VALUATIONS
U.S. small cap forward valuations have improved due to bear market, slightly below average relative to history; focus now shifts to earnings decline
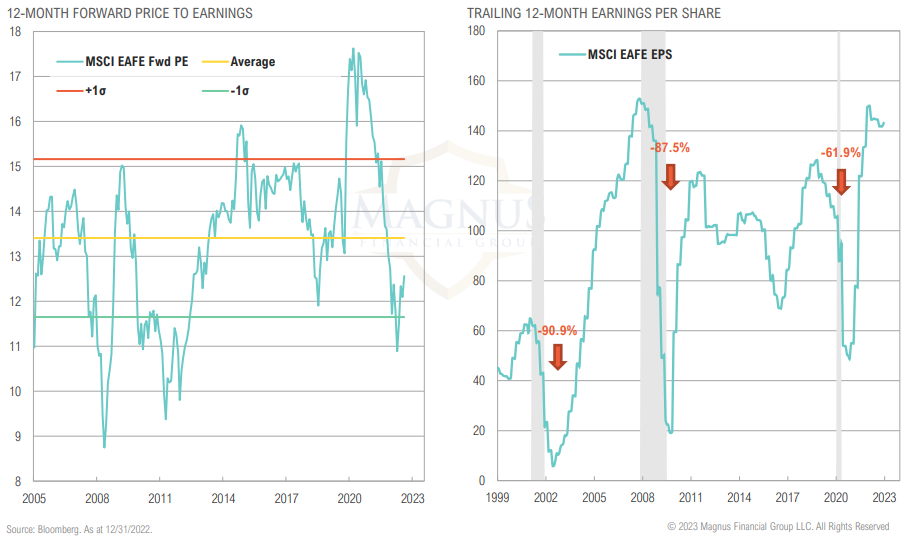
MSCI EAFE VALUATIONS
DM forward valuations have improved due to bear market, well below average relative to history; focus now shifts to earnings decline
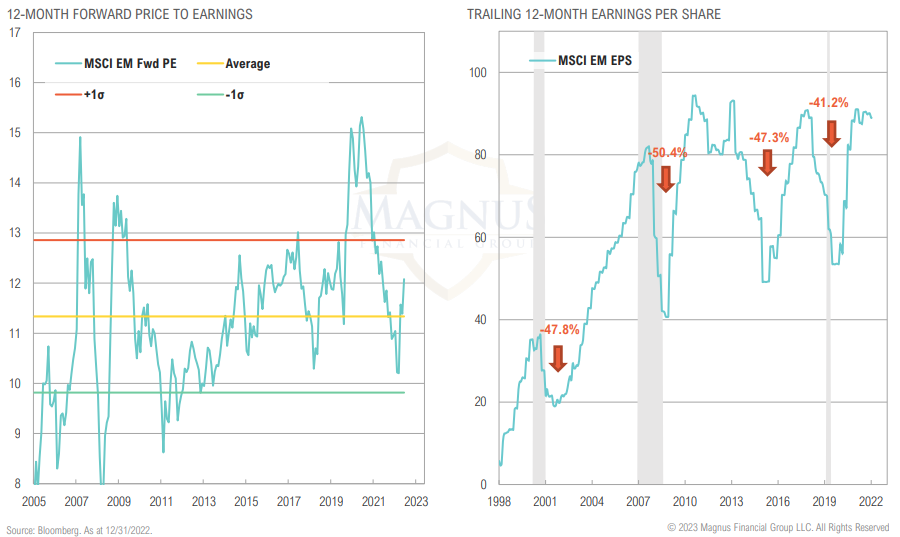
MSCI EM VALUATIONS
EM forward valuations have improved due to bear market, but back above average relative to history; focus now shifts to earnings decline
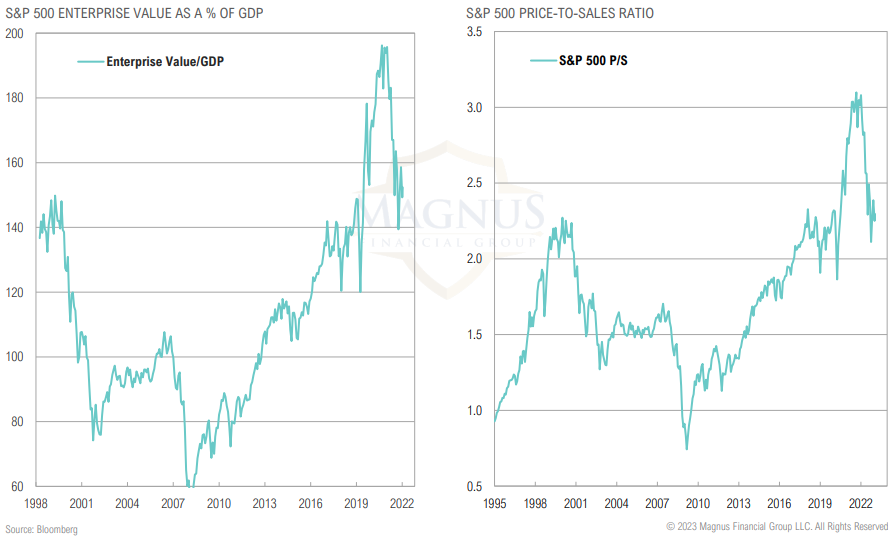
S&P 500 VALUATIONS
U.S. large cap valuations have improved due to bear market, slightly above average relative to history; focus now shifts to earnings decline; history suggests baseline should be at least 20% drop
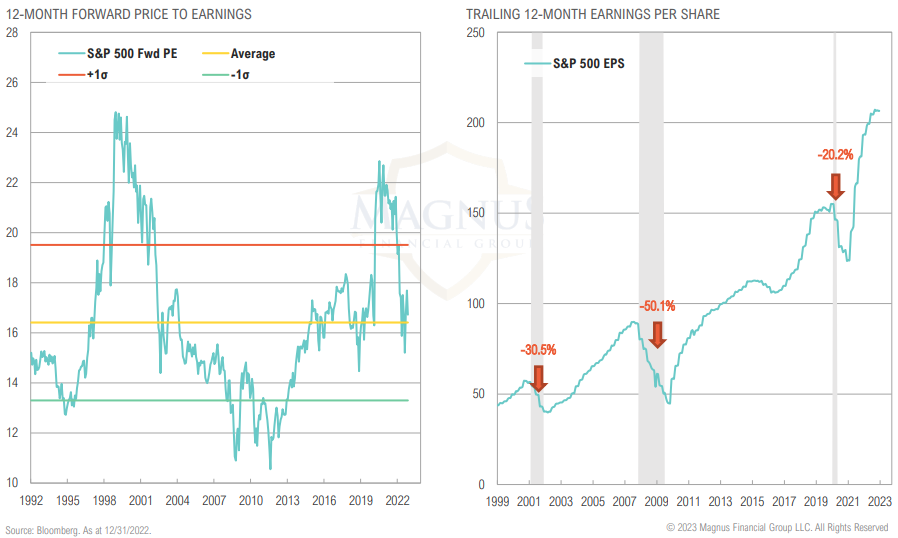
Adjusting for record-high margins, equity valuations are not compelling
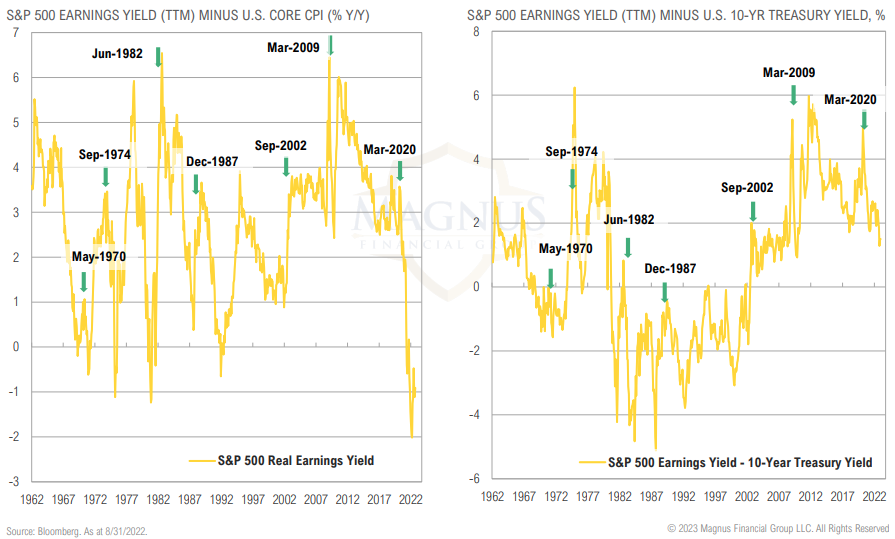
The S&P 500 real earnings yield is still decidedly negative, looks nothing like historical bear market highs (i.e., increases in earnings yield)
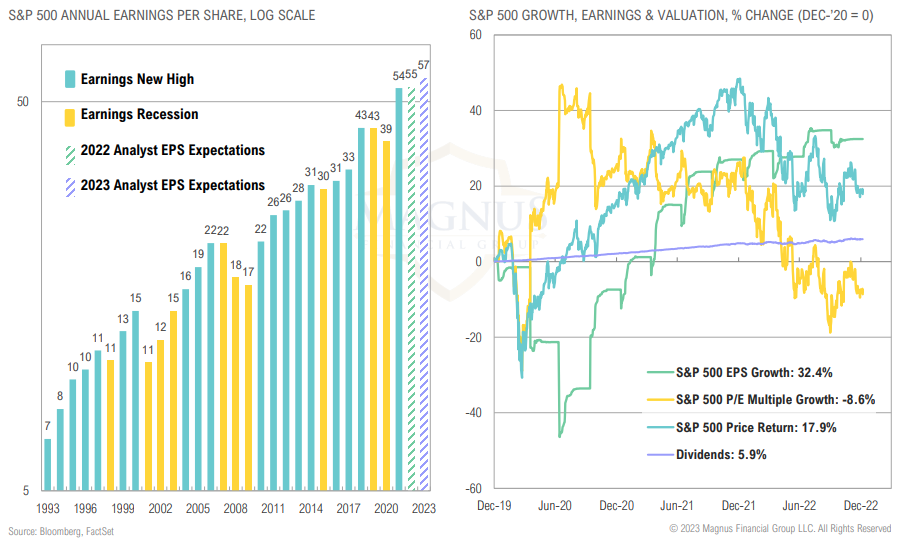
EARNINGS
Current 2023 analyst EPS growth estimates have been reduced to 5.5%
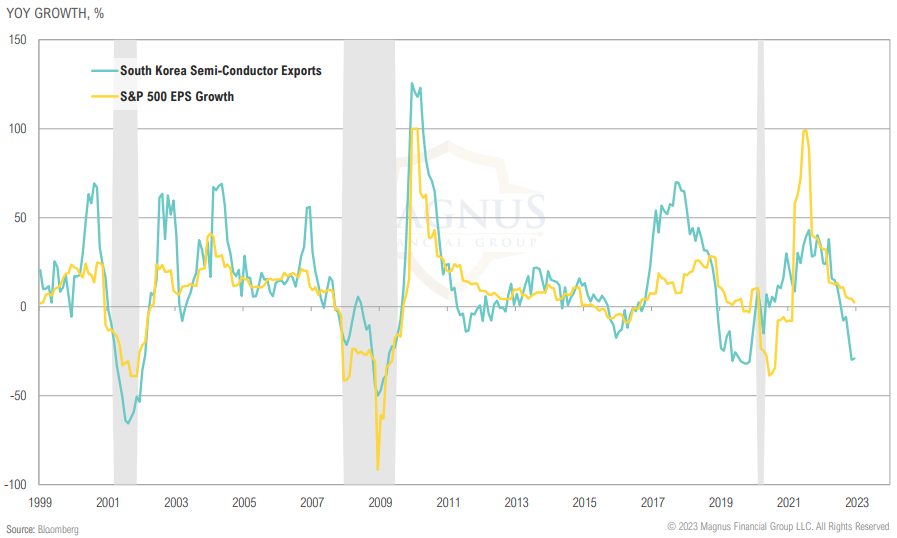
SOUTH KOREA EXPORT ACTIVITY
South Korea semi-conductor exports currently down 29.1% YoY; S&P 500 EPS growth and semi-conductor exports have roughly tracked each other in the past
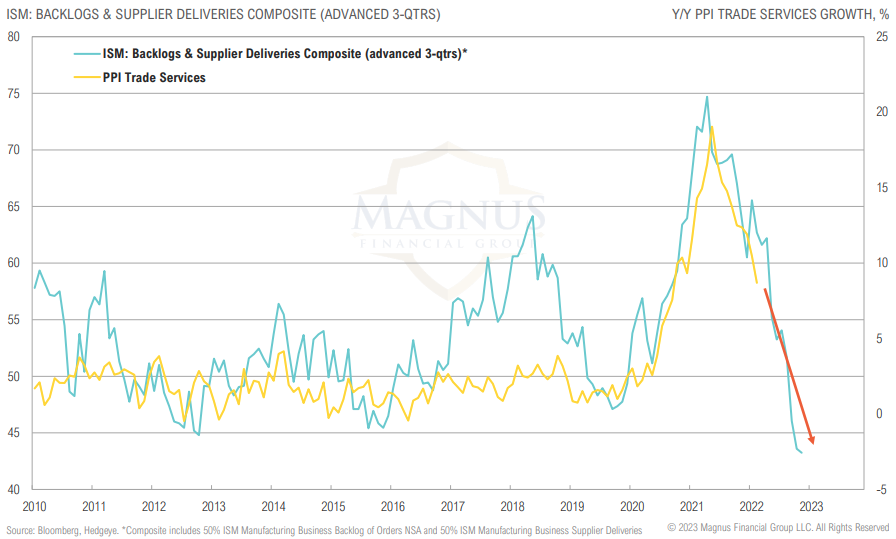
ISM VS CORPORATE MARGINS
Supply chain pressures (proxied by backlogs and delivery times) have led to higher margins (proxied by PPI Trade Services); margins look set to decrease in coming years
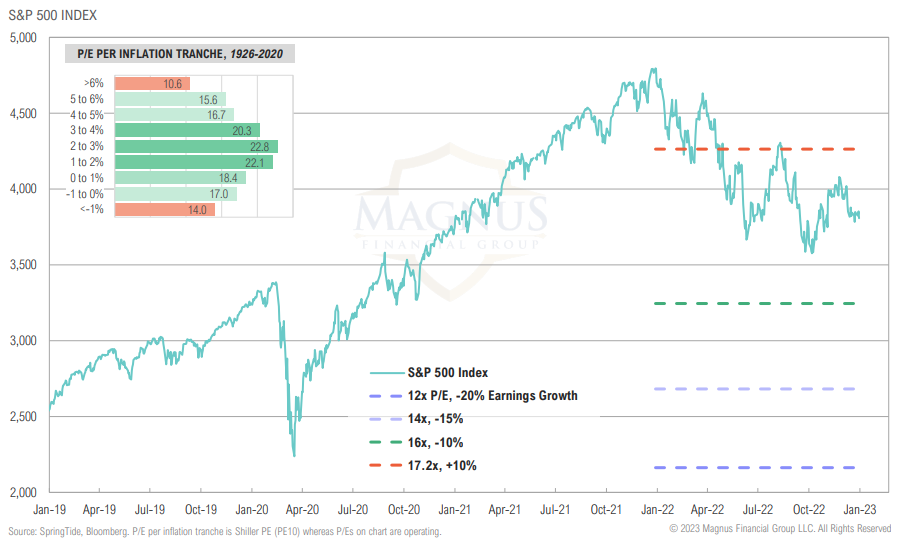
P/E MULTIPLES
What if inflation doesn’t roll and stay lower? How low can we go? P/Es to consider are 16x, 14x, and 12x, applied to various levels of earnings decline
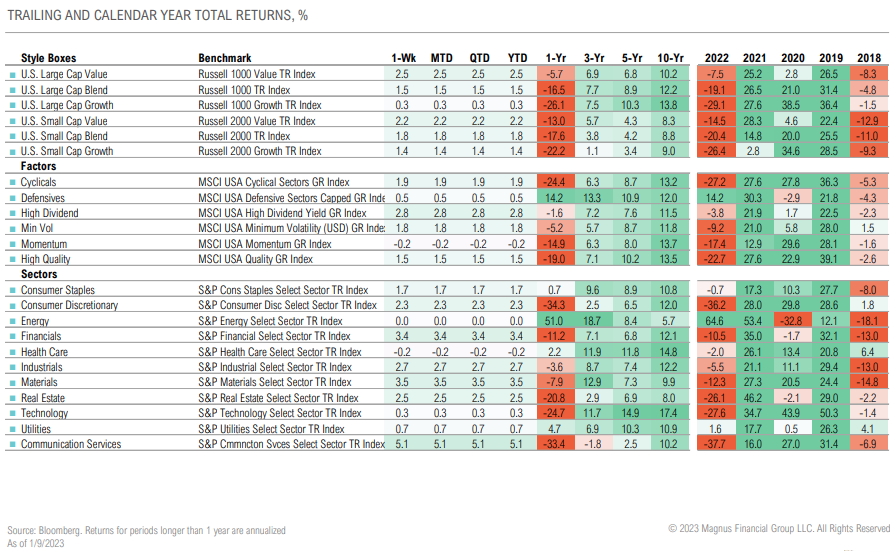
SECTOR RETURNS
Energy outperformed communication services by 105.6% in 2022, the widest sector performance differential since 1991
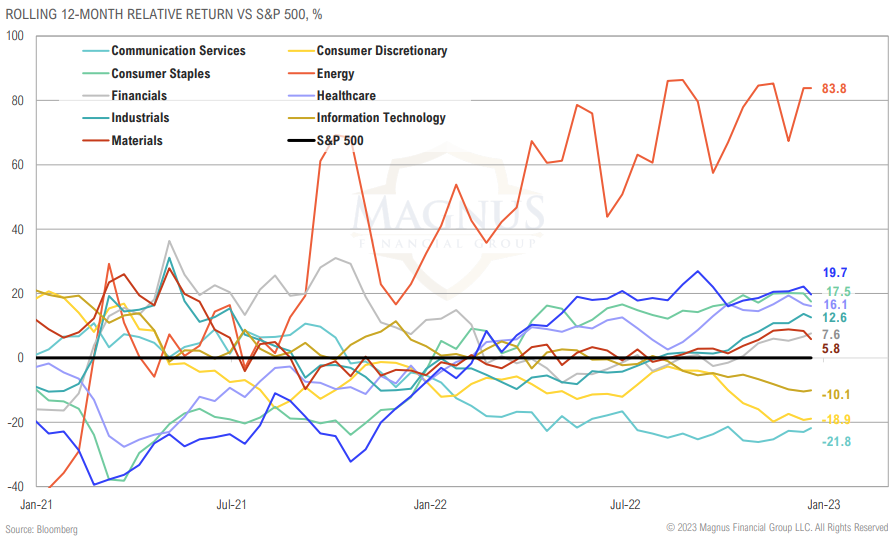
RELATIVE SECTOR PERFORMANCE
Growth sectors, including consumer discretionary, communication services and technology underperformed in 2022, with no clear indication of trend reversal
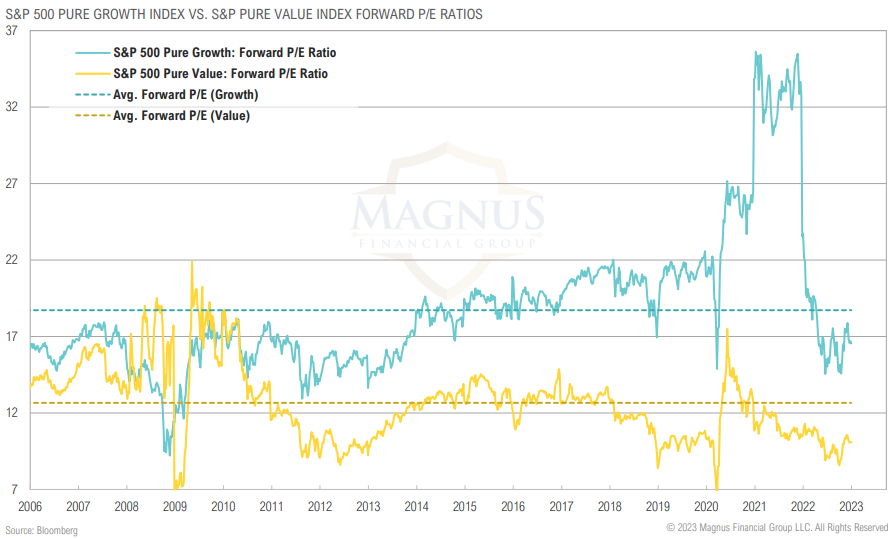
VALUE VS GROWTH
Forward-looking valuations improved dramatically, but earnings estimates will now come into question given potential margin pressure; value still looks relatively cheaper (i.e., this is not 2008-2010)
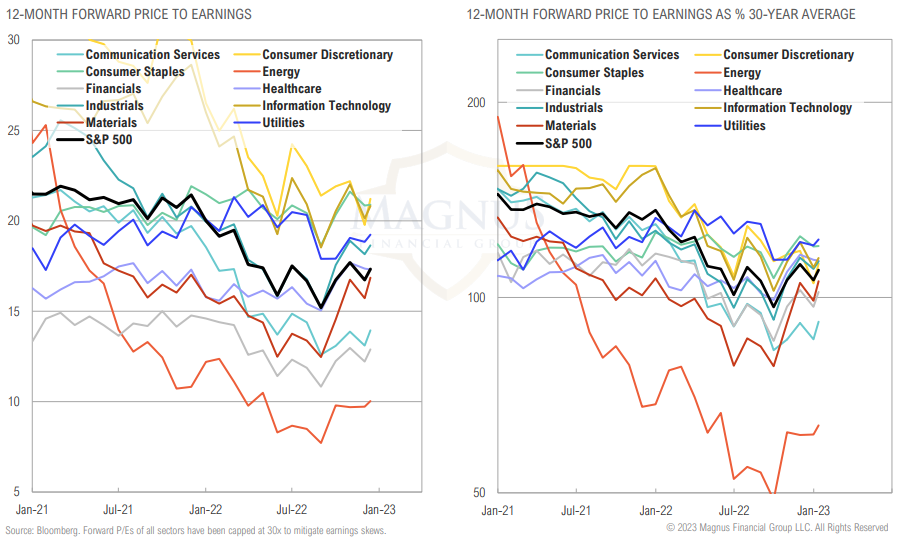
S&P 500 SECTOR VALUATIONS
Energy and Communication Services are currently the only two sectors which are trading below their 30-year average valuations
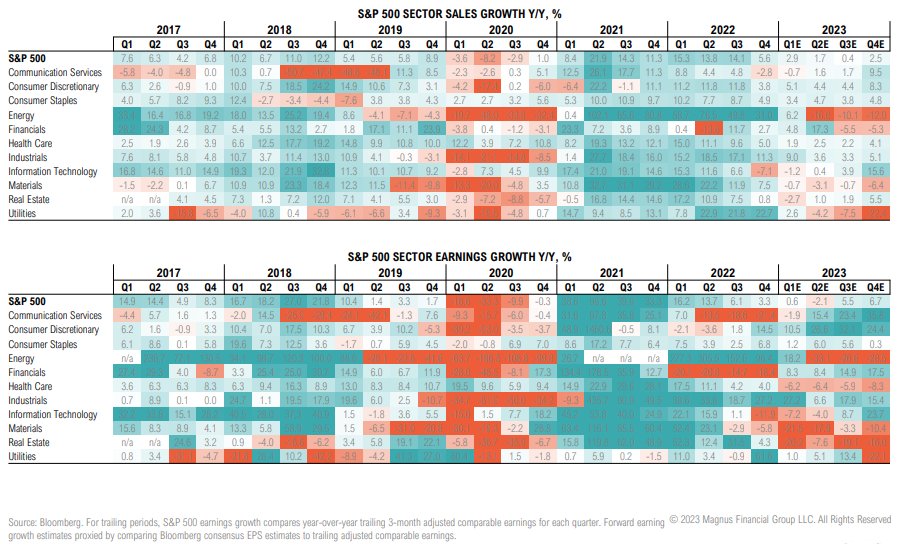
SALES & EARNINGS GROWTH
Nominal sales and earnings growth expected to decelerate but remain positive in 2023; impact of inflation and potential recession remain wild cards
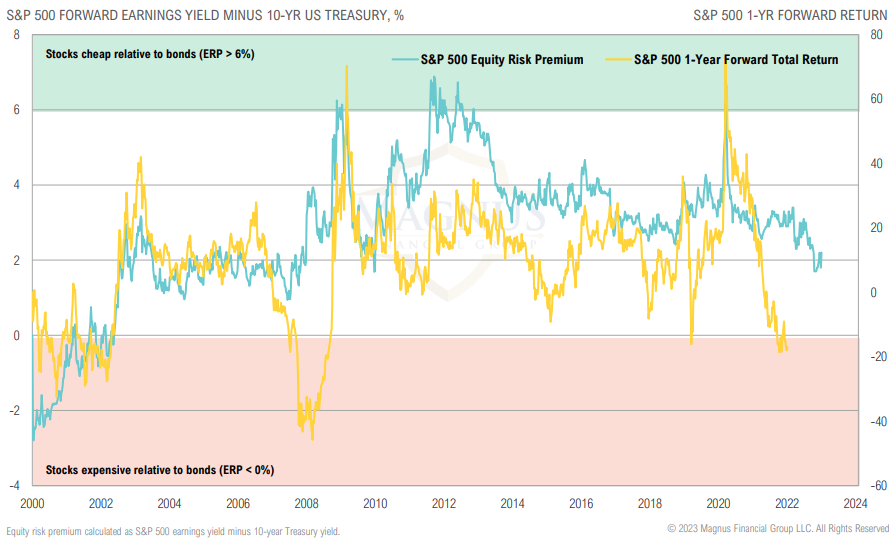
S&P 500 EQUITY RISK PREMIUM
Despite being in a bear market, stocks are arguably less attractively priced vis-à-vis bonds than they were coming into 2022
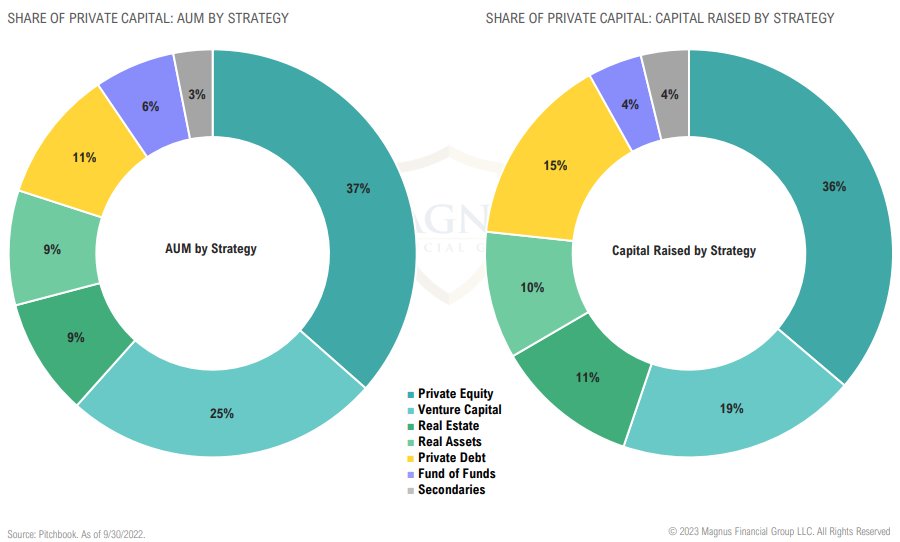
PRIVATE MARKET SHARE
Private markets dominated by private equity and venture capital
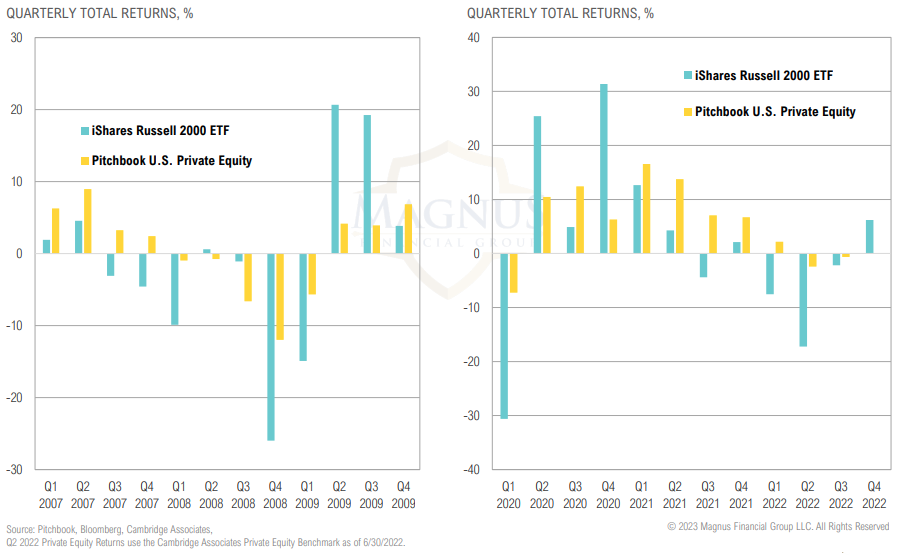
PRIVATE EQUITY
Private equity funds have not marked down their portfolios like they did in the GFC
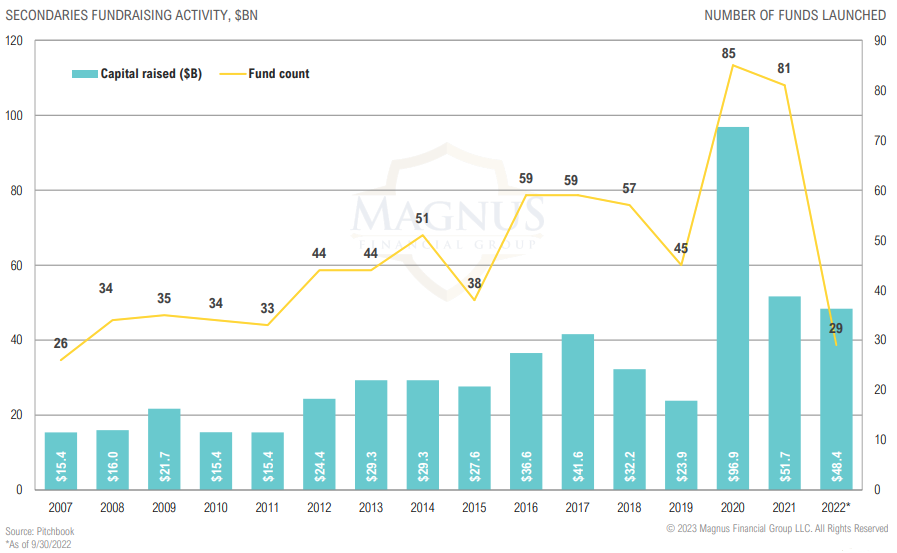
PRIVATE EQUITY SECONDARIES
Secondaries fundraising activity sees large increase in Q3
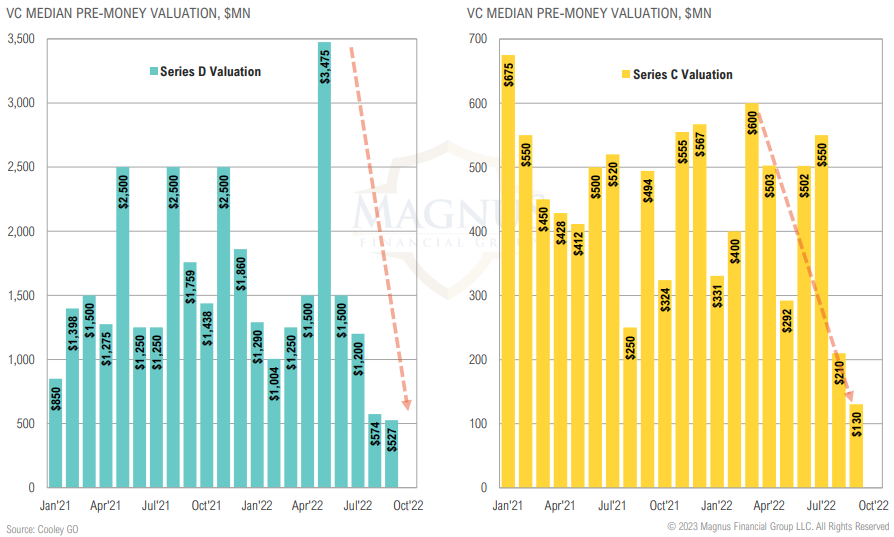
VENTURE CAPITAL
Overall, venture valuations remain high while exits are on pace for lowest year since 2016
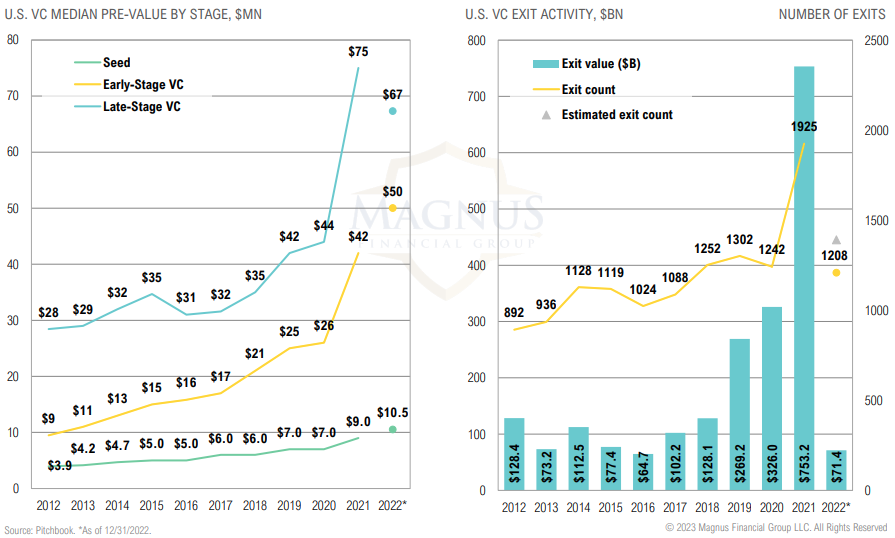
However, significant cracks are emerging; later-stage venture capital valuations cratered during Q3 of 2022
FIXED INCOME & CREDIT
Inflation is eroding everything I just said, and that $1.5 trillion will run out sometime mid-year [this] year. When you are looking that forward, those things very well may derail the economy and cause this mild to severe recession that people are worried about.
– Jamie Dimon, JPMorgan CEO
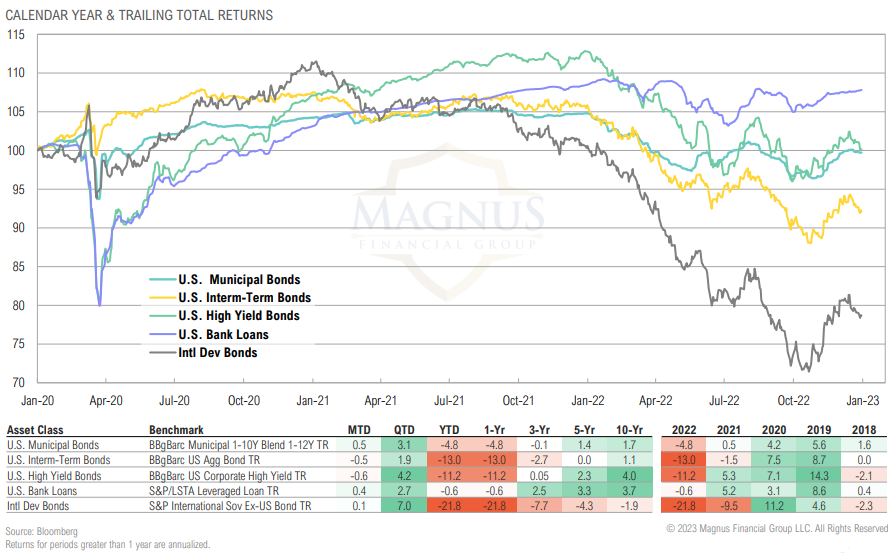
MARKET RETURNS SUMMARY
All U.S. and international fixed income & credit asset classes were up over the quarter; while international developed bonds performed best in Q4, they were the worst 2022 performer
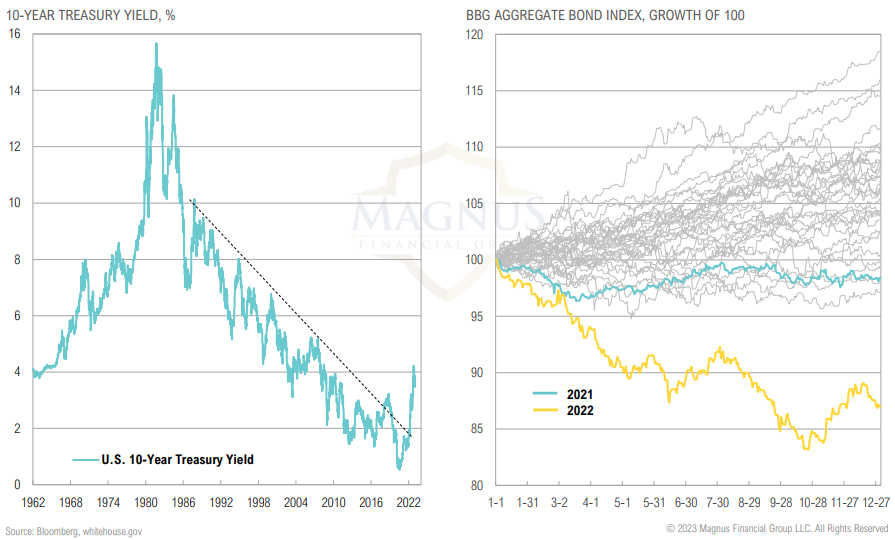
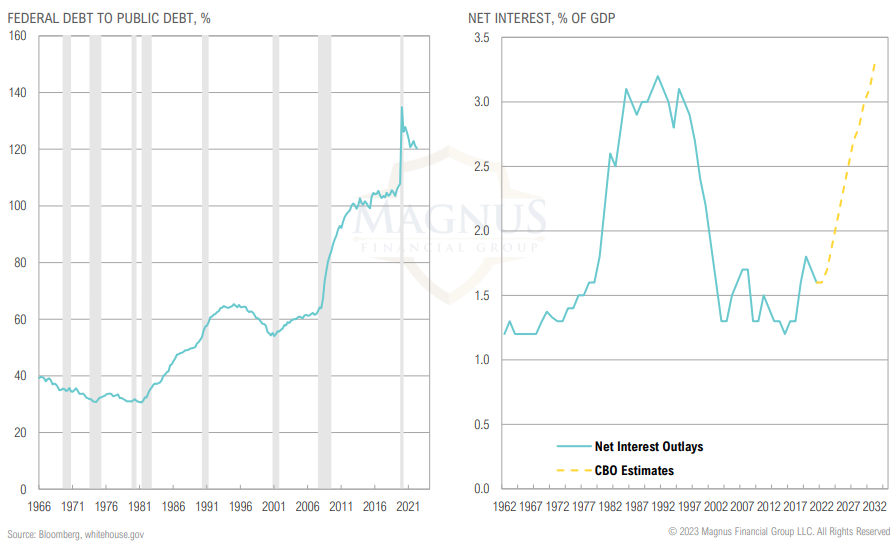
TREASURY MARKET
Context is important for Treasury markets
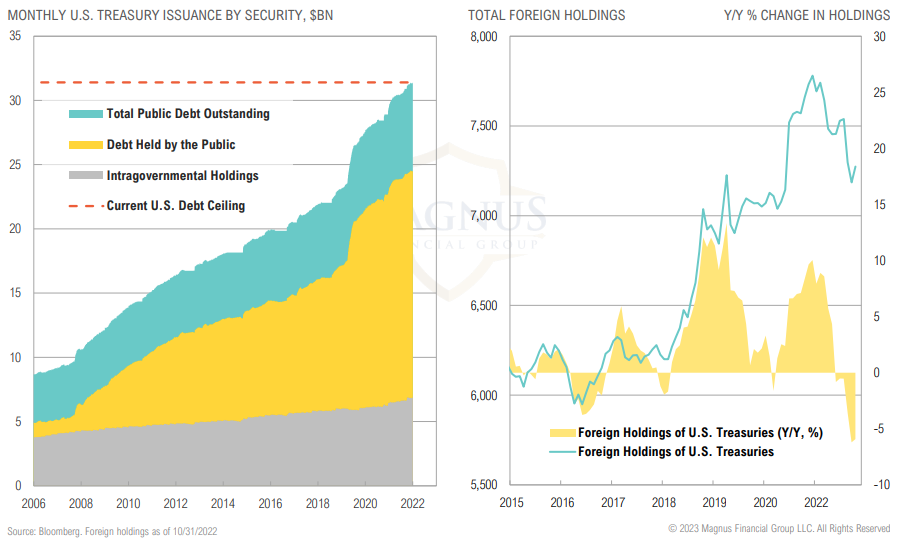
TREASURY ISSUANCE
Q1 2023 net issuance was expected to be $578Bn; Treasury cash balance now at $310Bn
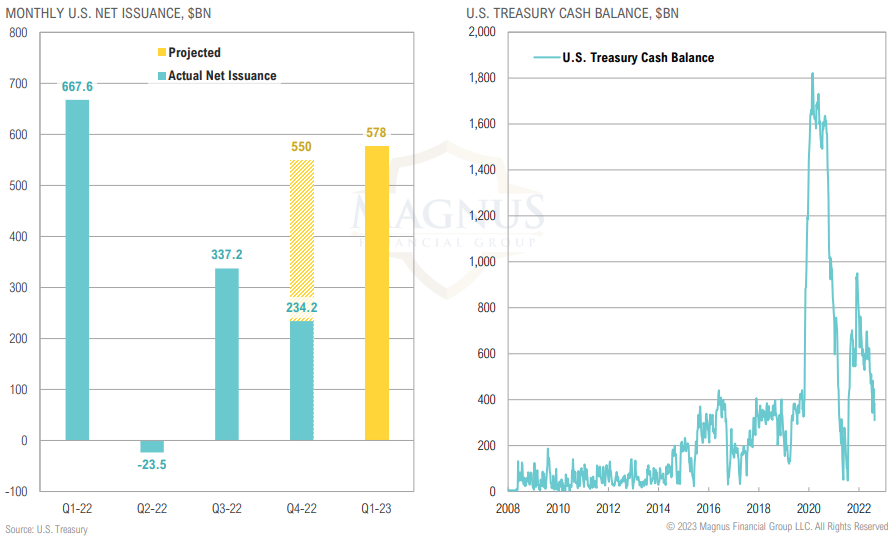
Q1 2023 net issuance expected to be $578Bn; Treasury cash balance now at $310Bn
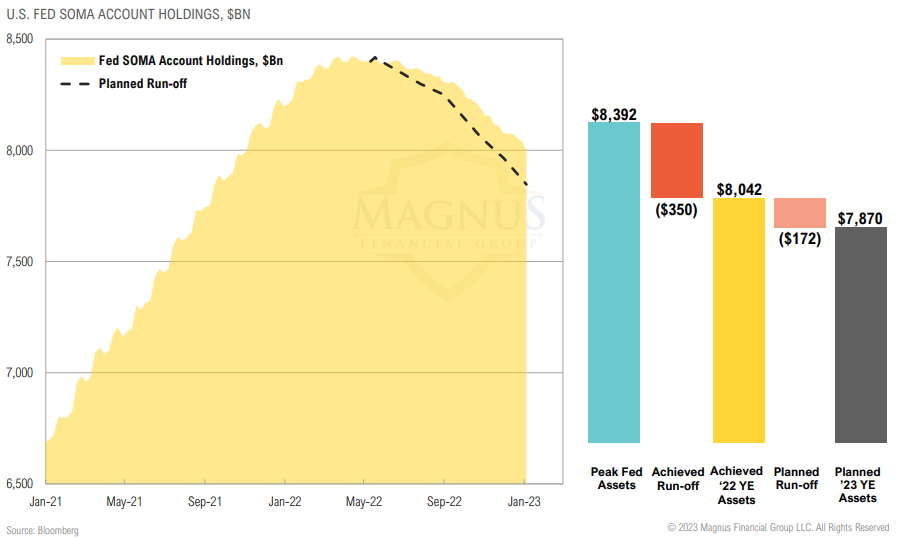
FED ASSETS
Fed’s planned balance sheet reduction ($47.5 bn/month from Jun-Aug ‘22 and $95bn from Sep ‘22) has started to take shape, even if massively lagging planned pace
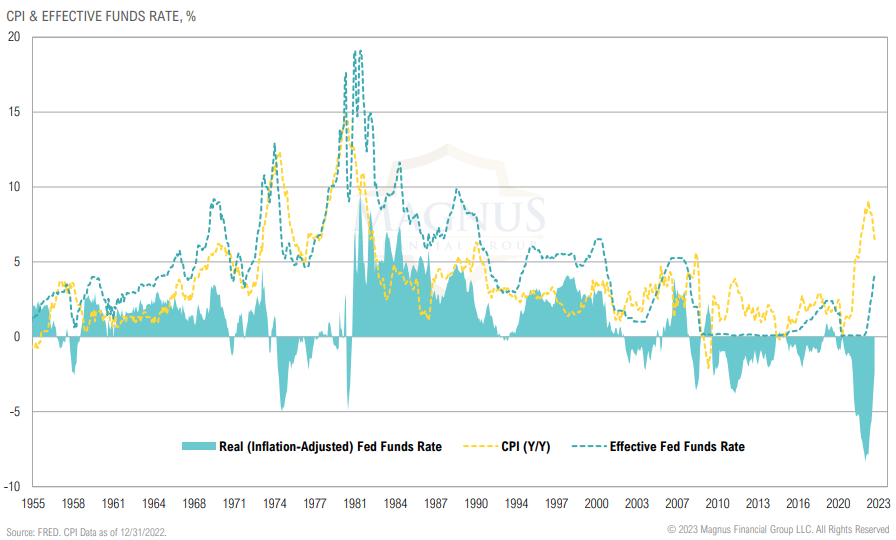
REAL INTEREST RATES
While CPI has rolled over from peak, the effective Fed funds rate is still negative
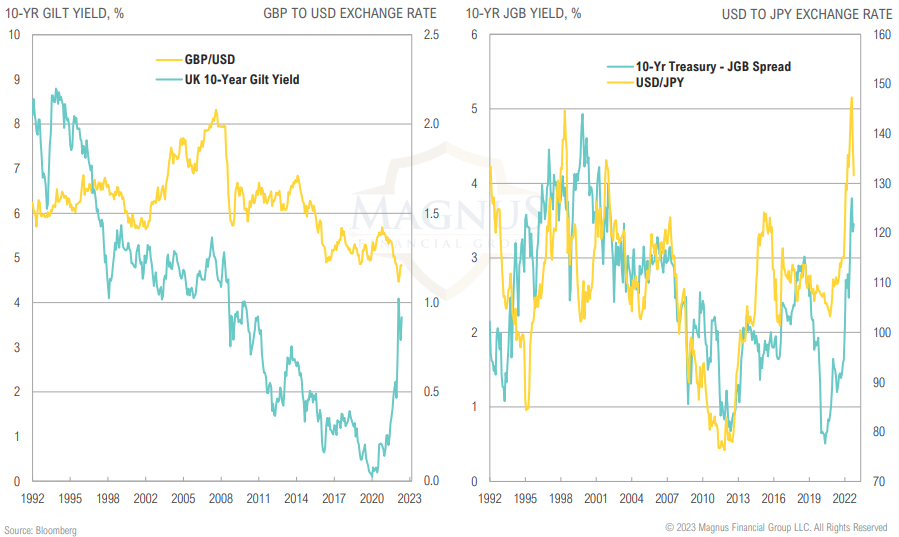
GLOBAL YIELDS & DOLLAR
Market increasingly punishing policy mistakes, especially when you’re not the global reserve currency
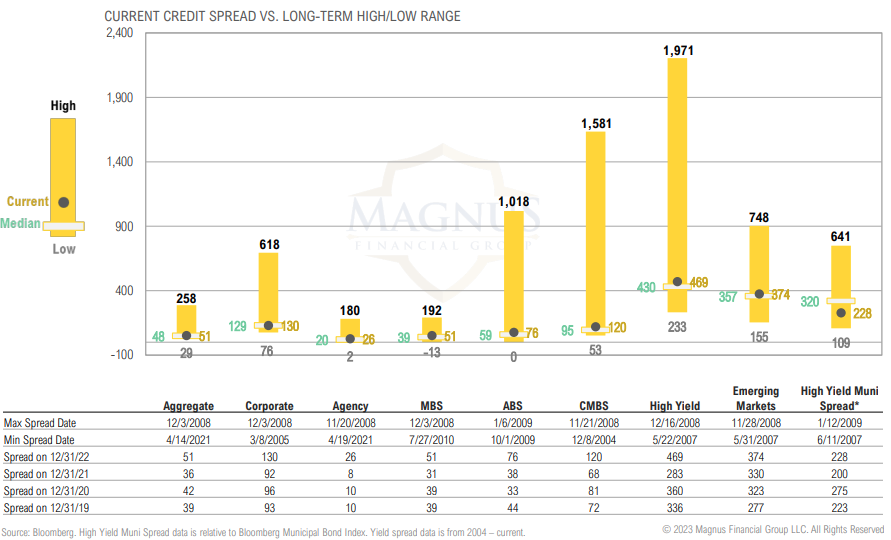
SPREADS BY SECTOR
Credit spreads at or modestly above average across most sectors; starting to shift up slightly as recession fears start to become more entrenched
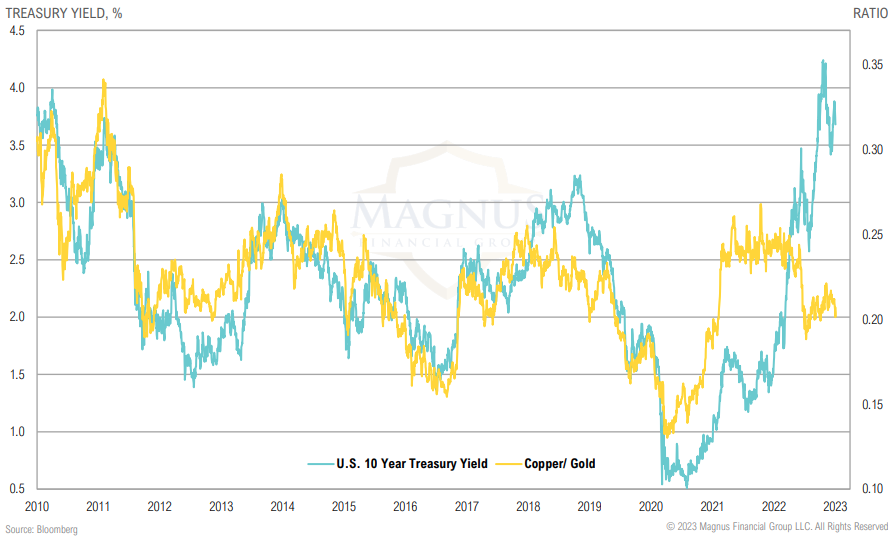
COMMODITIES & THE YIELD CURVE
Collapse in copper/gold ratio—a proxy for the real economy vis-à-vis financial assets—suggests Treasury yields may head lower
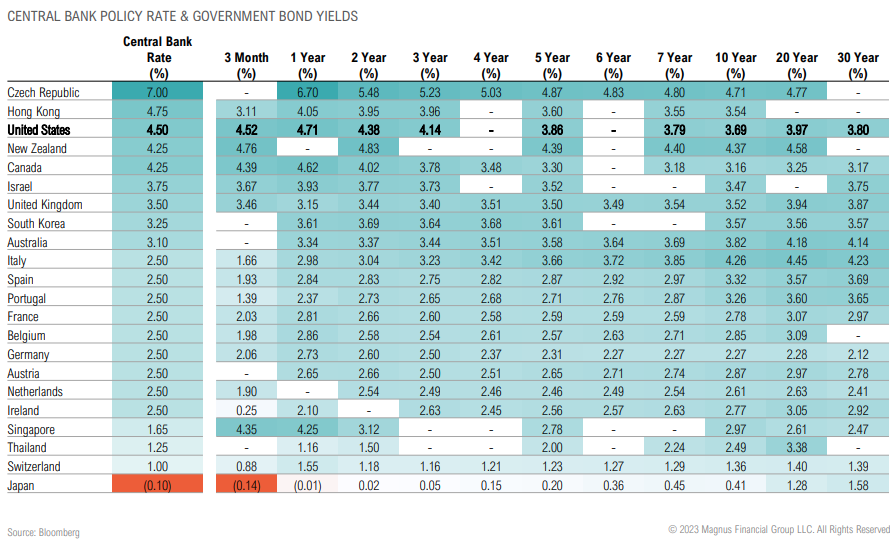
GLOBAL RATES
The U.S. bond market remains relatively higher yield, which could help keep U.S. rates somewhat contained
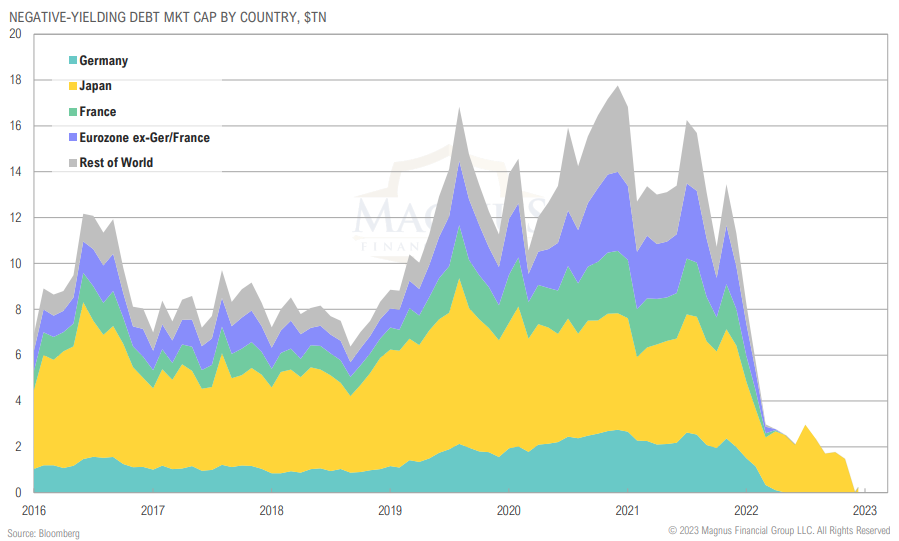
NEGATIVE-YIELDING DEBT
The end of an era? We hope so…
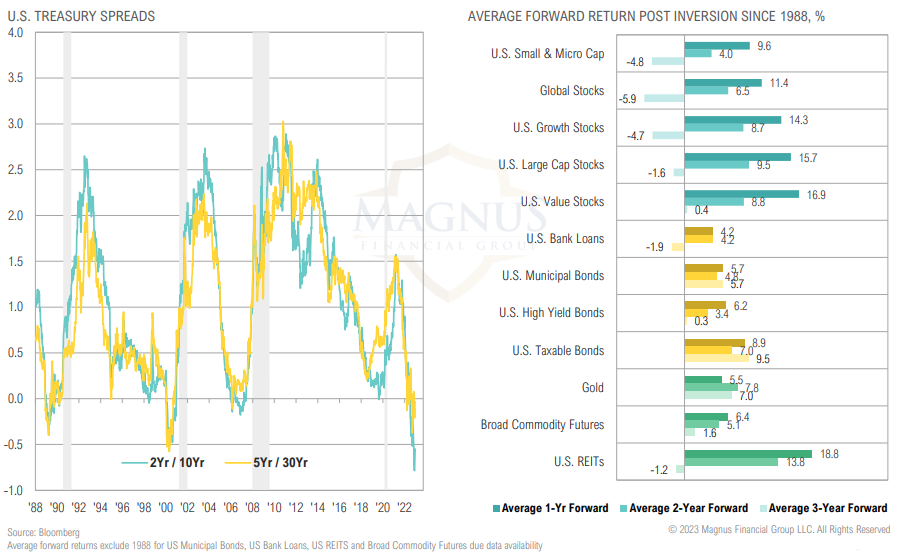
TREASURY SPREADS
Yield curve inversion signaling slowing growth; risky assets can generate strong short-term returns post inversion, but we don’t like “pennies in front of steam roller” trades
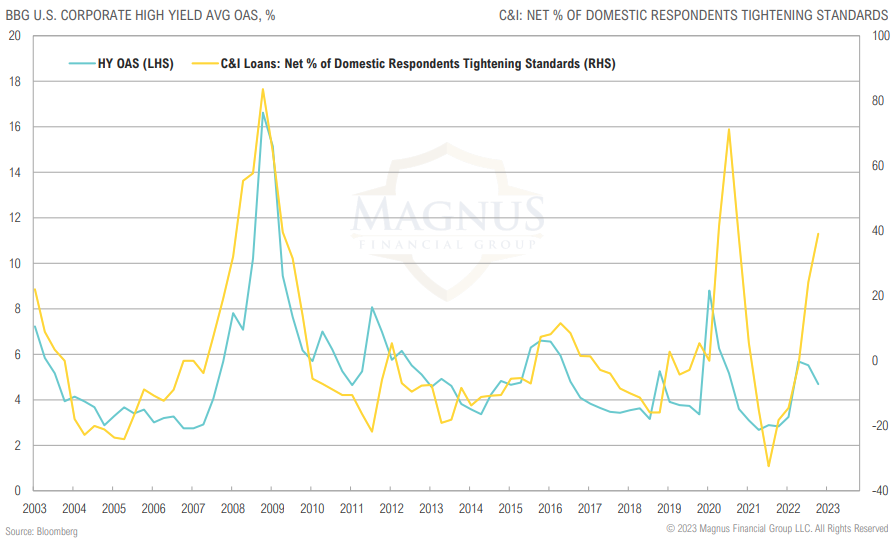
HY OAS VS LOANS
Domestic banks have tightened lending standards sharply over recent months, an event which has generally been associated with wider credit spreads
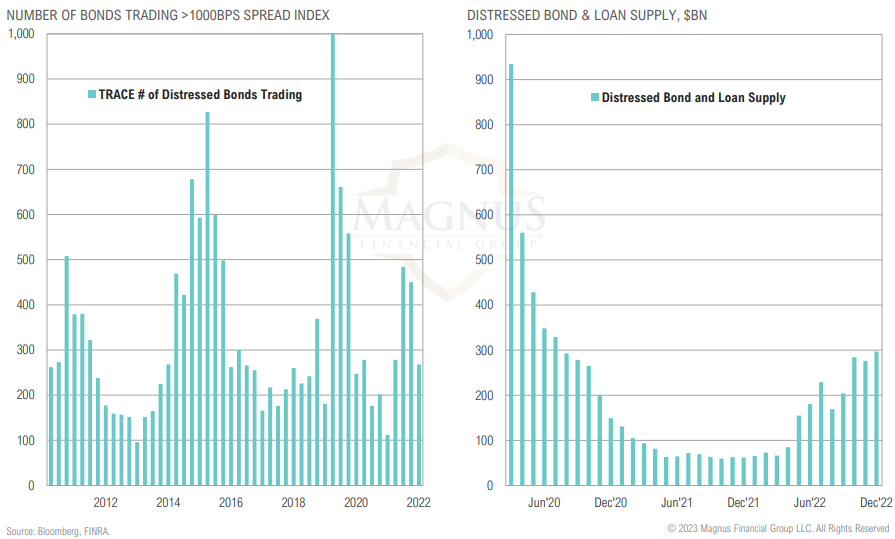
DISTRESSED DEBT
Supply of distressed debt has been on the rise over recent quarters
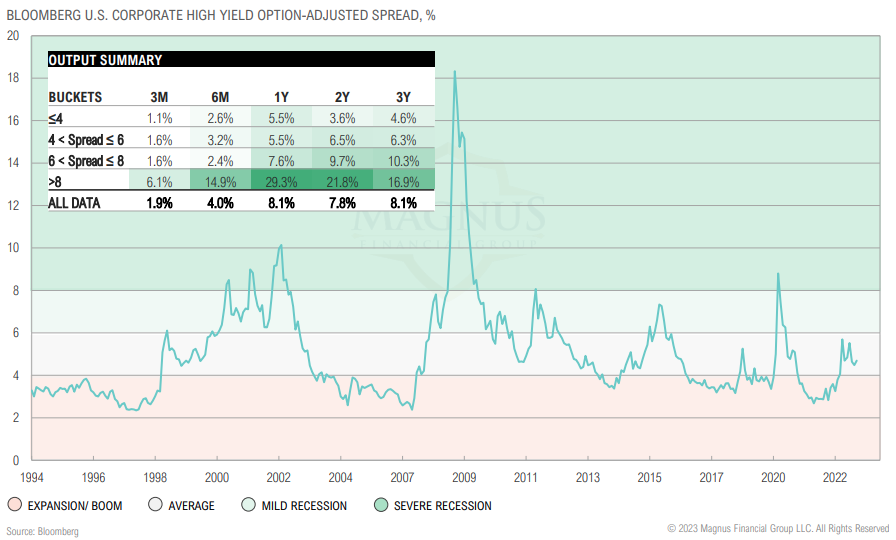
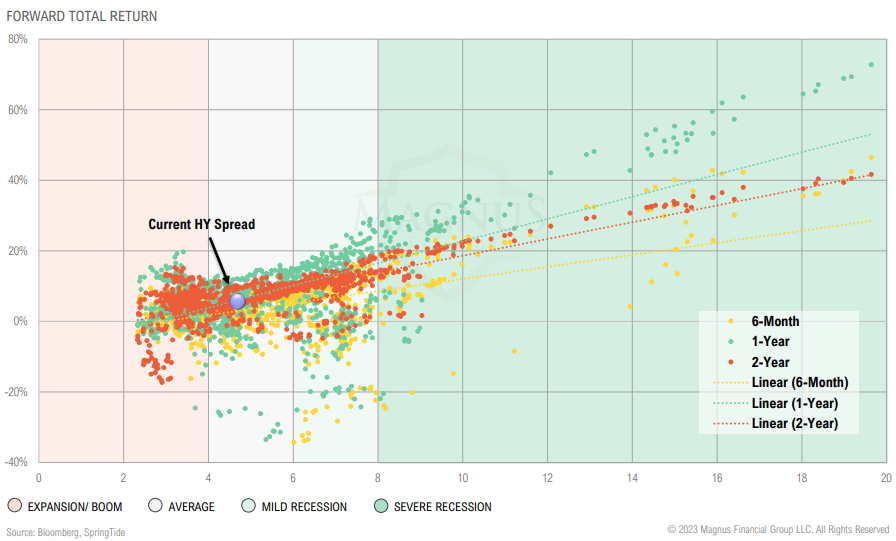
HIGH YIELD SPREADS
Historically, high yield spreads above 6% have resulted in above-average forward returns; high yield spread currently trading at a middling 4.7%
Historically, high yield spreads above 6% have resulted in above average forward returns; high yield spread currently trading at a middling 4.7%
REAL ASSETS
…we’re spending over a trillion dollars less than what I’ll call the previous cycle. That’s 2010 to 2014. So since 2015, the industry worldwide is spending over a trillion dollars less in investment.
– Scott Sheffield, Pioneer Natural Resources CEO
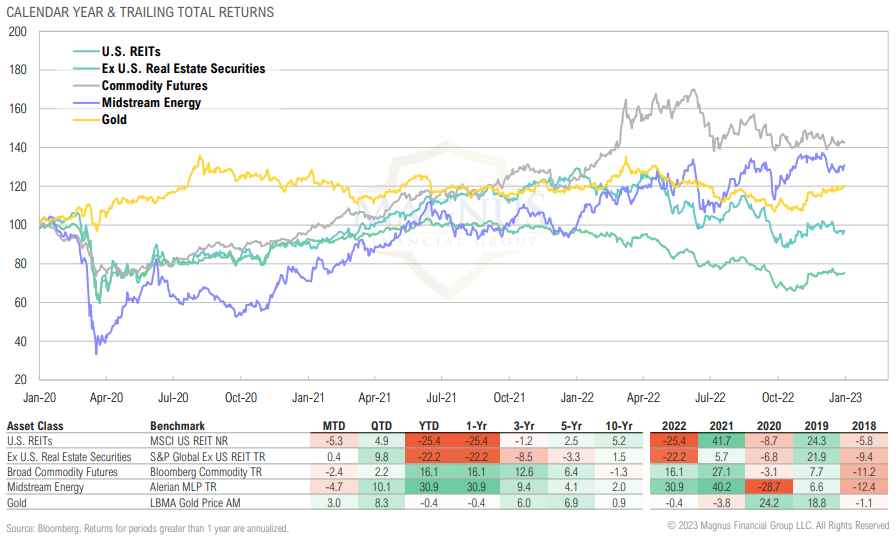
MARKET RETURNS SUMMARY
Broad commodity futures and midstream energy were among the top performing real assets over 2022, while both U.S. and global REITs ended the year in bear market territory
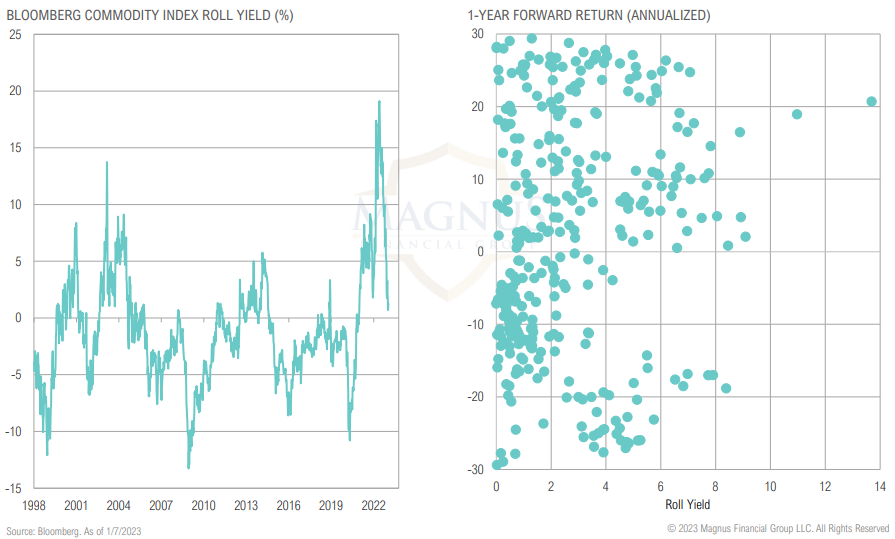
COMMODITIES
Commodity roll yields have dropped sharply, largely due to natural gas futures shifting back to contango, suggesting global commodity markets have loosened
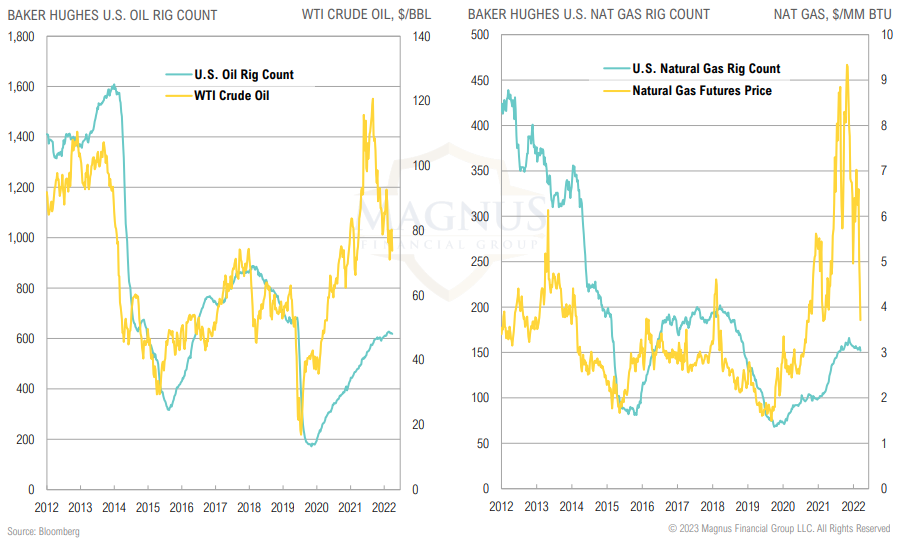
OIL & NATURAL GAS
Oil and natural gas producers have slowed increases in rig counts as prices have rolled over
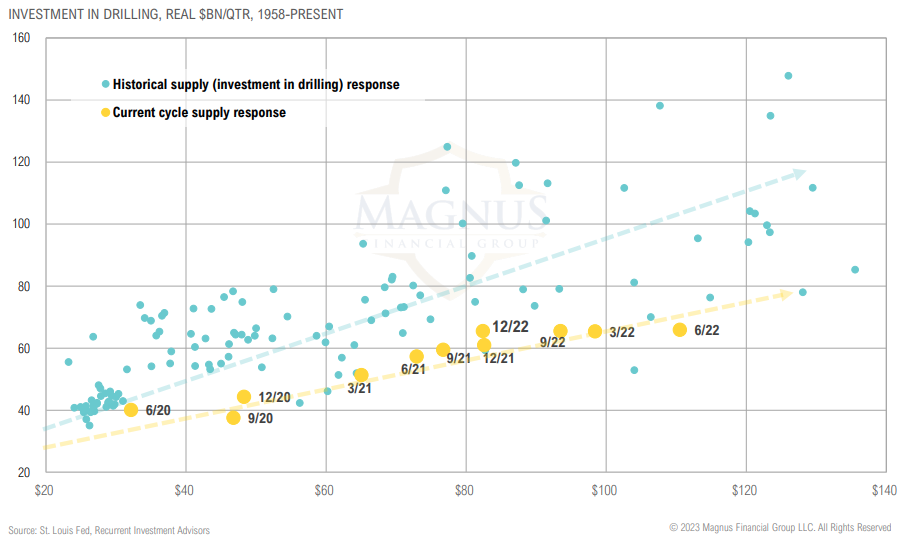
OIL PRODUCTION/CONSUMPTION
Since COVID, drilling capex levels have been near the bottom of a 65-year range
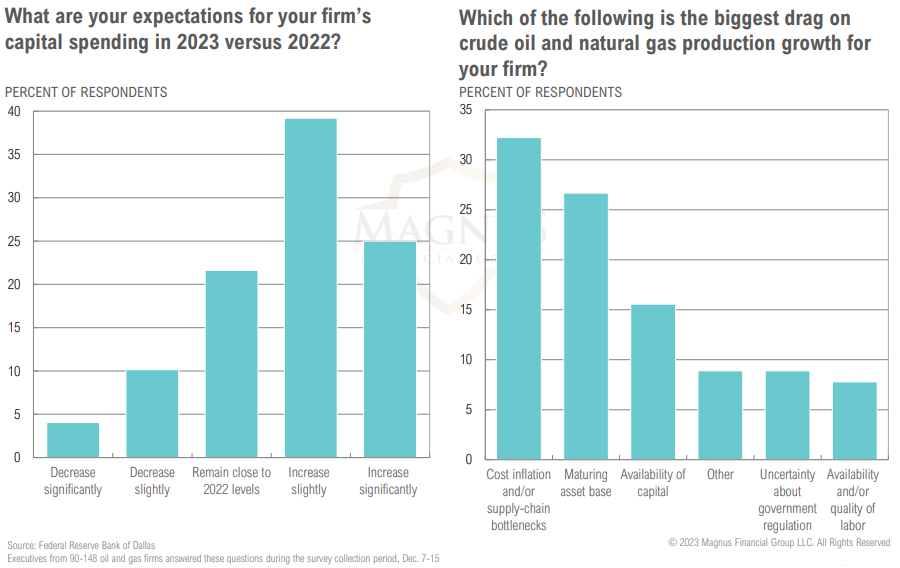
OIL PRODUCTION/CONSUMPTION
Oil executives expect to start ramping up capex in 2023
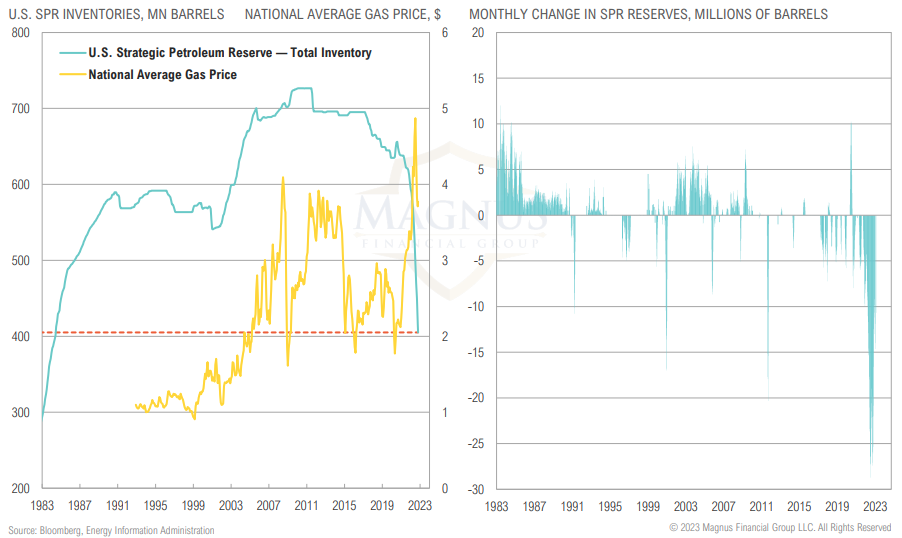
ENERGY PRICES
SPR dump helped ease gas prices & inflation pressures, but is not expected to continue in 2023, eliminating a key headwind for gas prices
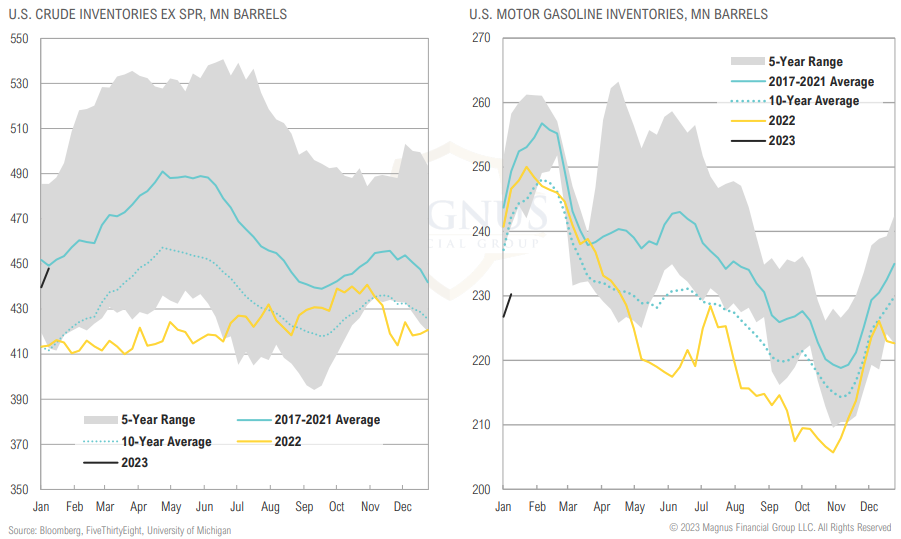
Crude inventories have built to start the year while gasoline inventories remain tight relative to the past five years
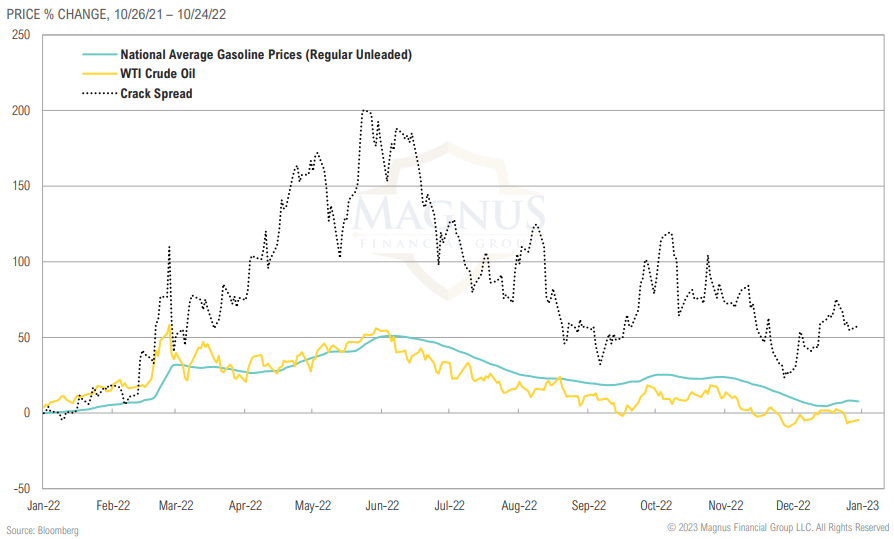
OIL & NATURAL GAS
Crack spreads remain elevated despite the decline in oil prices, signaling continued constrained refinery capacity
YIELDS
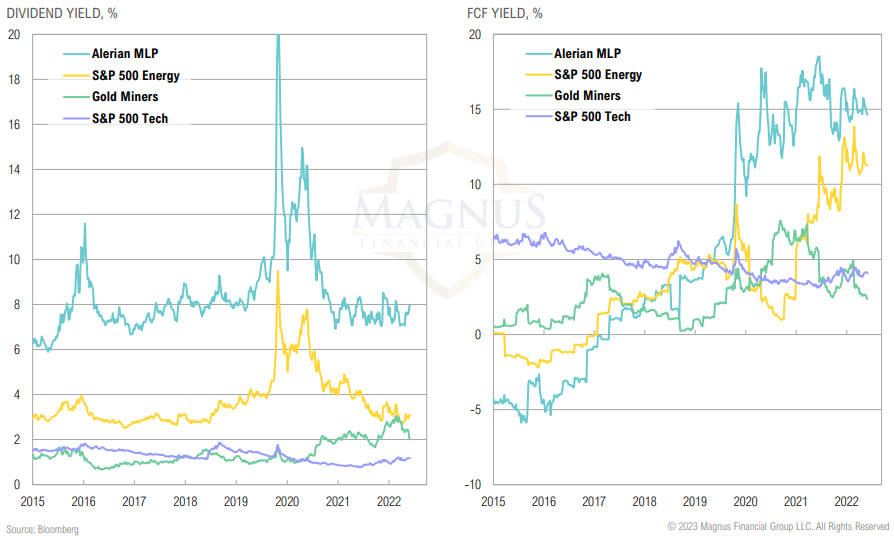
Midstream distribution yields trending lower as sector breaks out to upside but remain relatively attractive, free cash flow yields of energy sector remain attractive
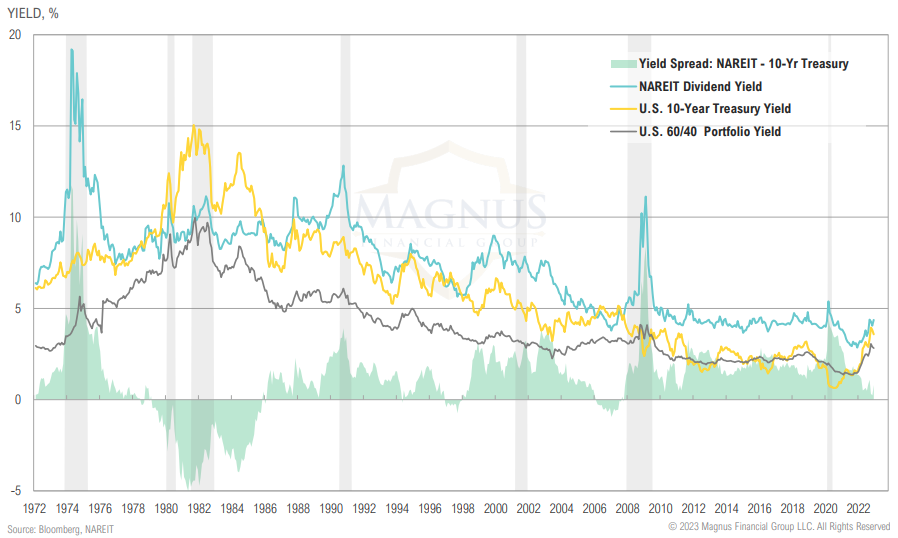
REITS
Even after ending 2022 down 24.5%, REIT yields are wholly unattractive on a relative basis and near lowest levels in history on an absolute basis
PRIVATE MARKETS
Private market interval funds have significantly outperformed their passive investable benchmarks YTD as net asset values have yet to catch down to reality
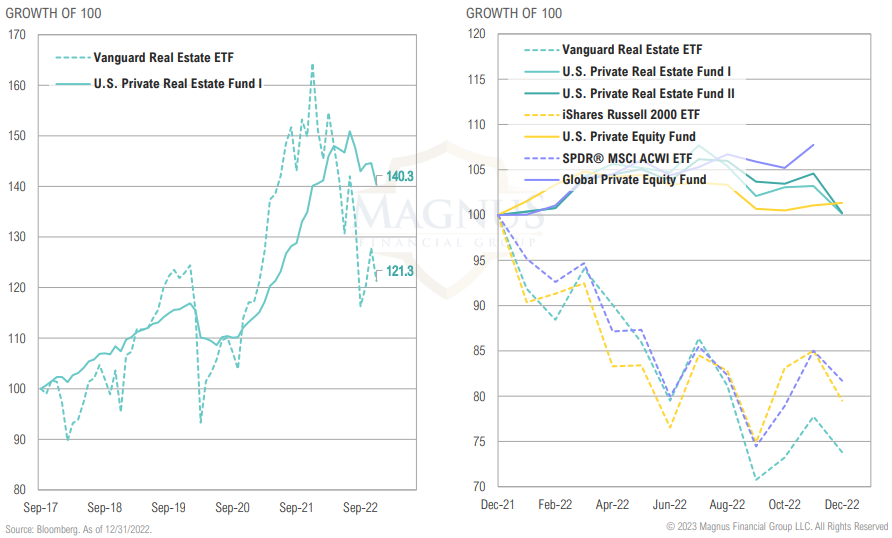
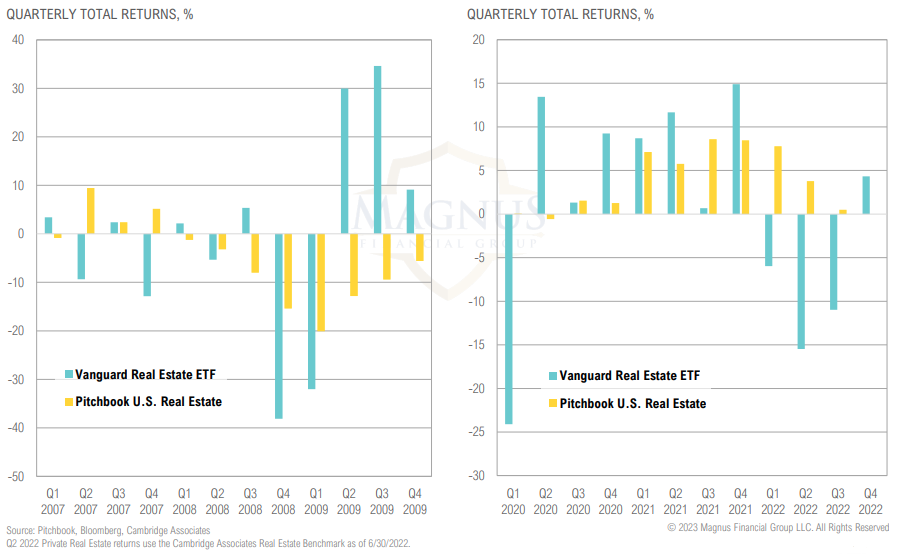
PRIVATE REAL ESTATE
Private real estate funds have not marked down properties like they did in the GFC
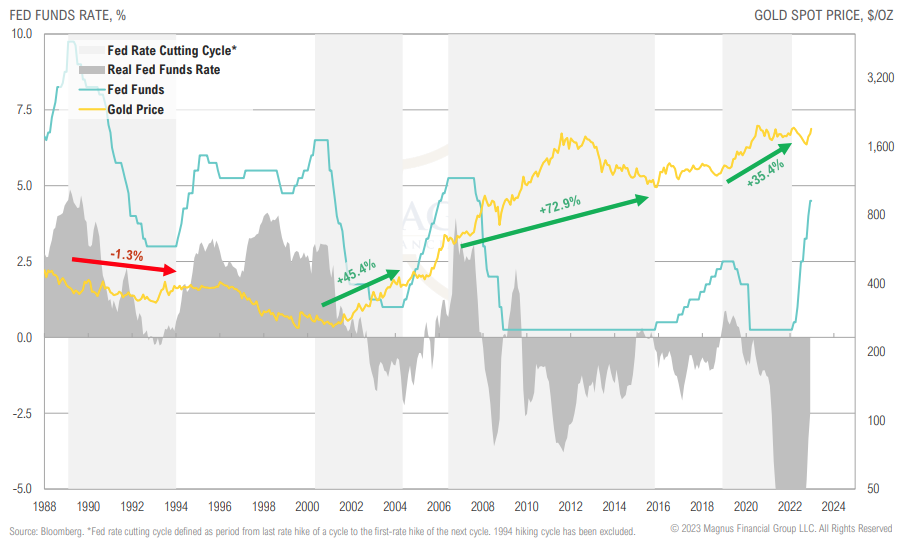
GOLD VS FED FUNDS
Since the turn of the century, the end of hiking cycles have been positive for gold; this may be due to lower opportunity costs (falling real rates)
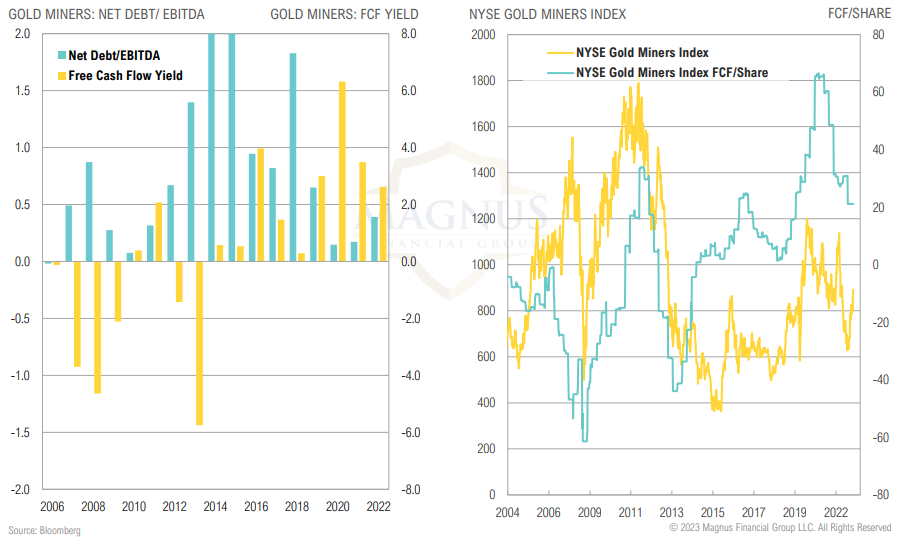
GOLD MINER FUNDAMENTALS
Gold miners have rallied >40% from Sept ‘22 lows, as spot gold prices catch a bid, but the rising of operating costs remains a key risk for miners
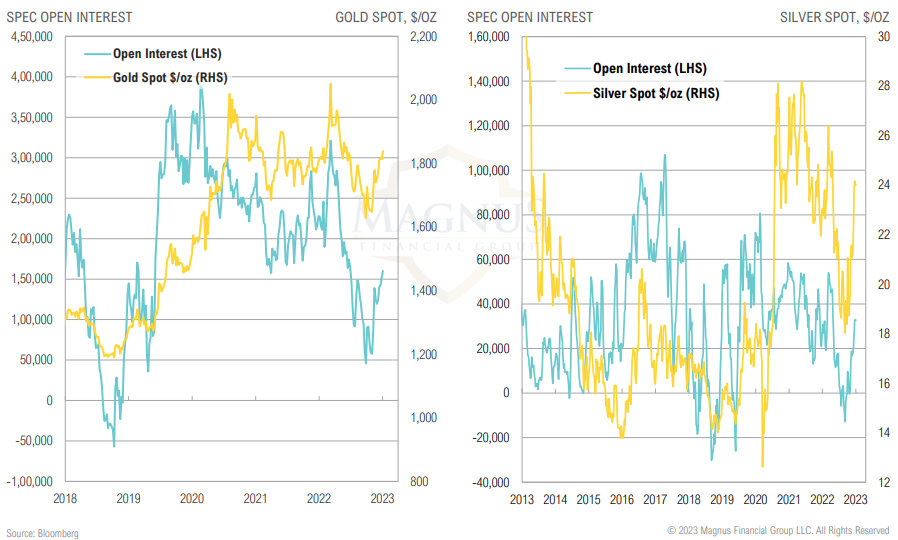
GOLD FUTURES POSITIONING
Spec positioning in gold futures increased modestly over the December, but nowhere near stretched, suggesting recent rally may have legs
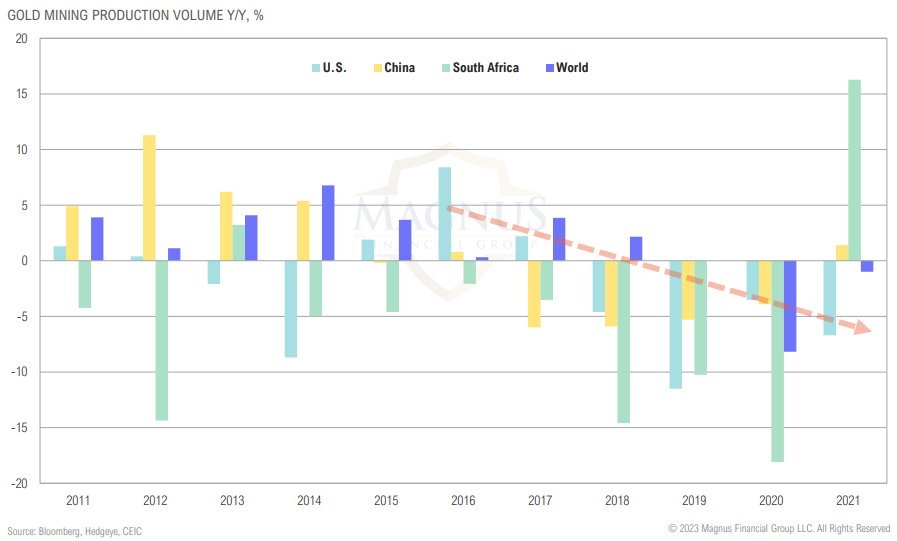
GOLD PRODUCTION
Global gold production volumes have been tracking lower in recent years
OPPORTUNISTIC
We also had the China lockdown situation, which now appears to be resolved. So the China market, it’s a big market, and we expect that to resume growth. And we are going to take a couple quarters, as we said, for the inventory to clear up before we get normal demand.
– Cristiano Amon, Qualcomm CEO
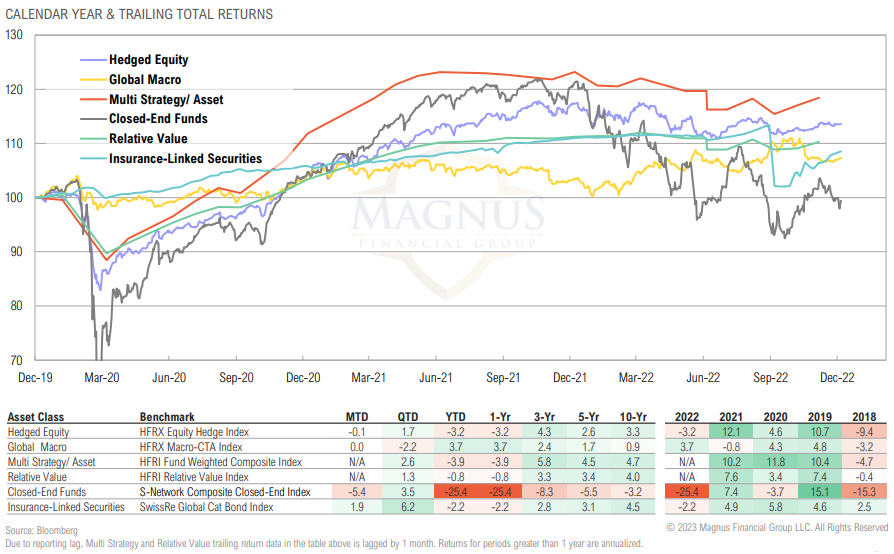
MARKET RETURNS SUMMARY
While global macro was the only opportunistic asset class with negative Q4 returns, contrarily it was also the only strategy to produce positive returns over 2022
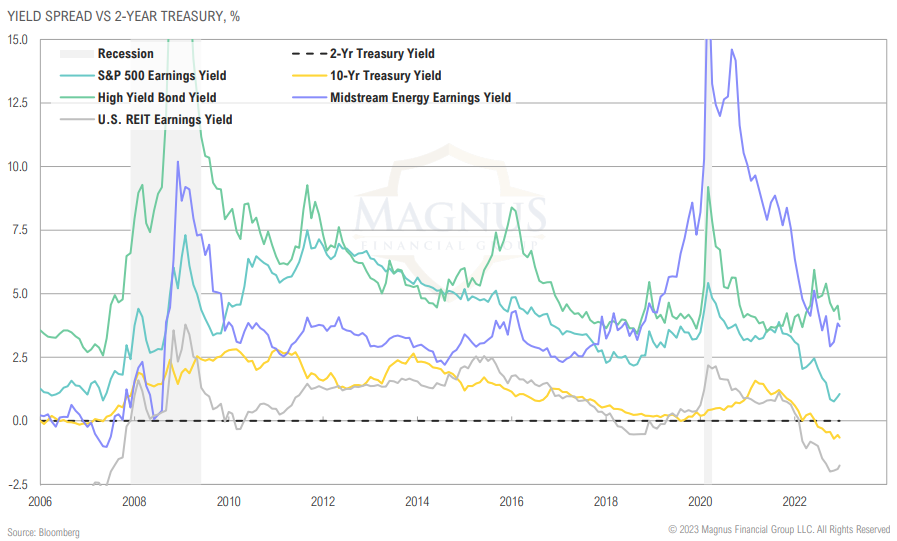
YIELD SPREADS
Most asset classes don’t look attractive relative to the 2-year Treasury yield; spreads have some way to go if past recessions are at all indicative
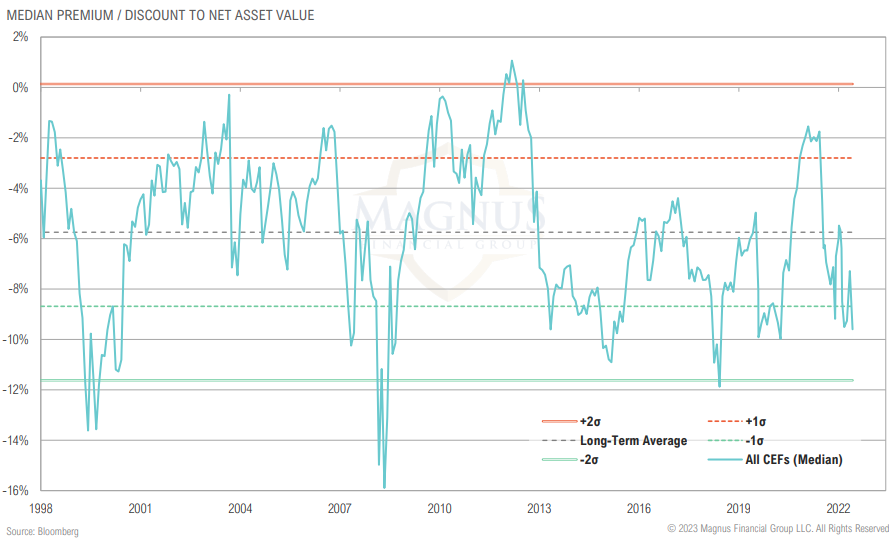
CEF DISCOUNTS
CEF discounts widened to -9.6% in December; U.S. taxable bond discounts widened in December back above 6.0% after narrowing to 3.7% in November
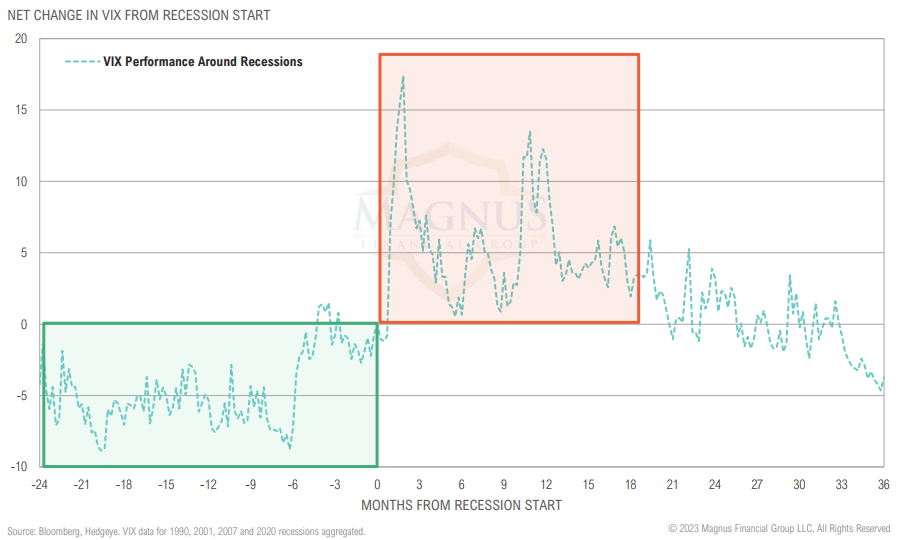
VIX VS RECESSIONS
Historically, the VIX has spiked and remained elevated for extended periods after the start of a recession — but remember, volatility brings opportunity!
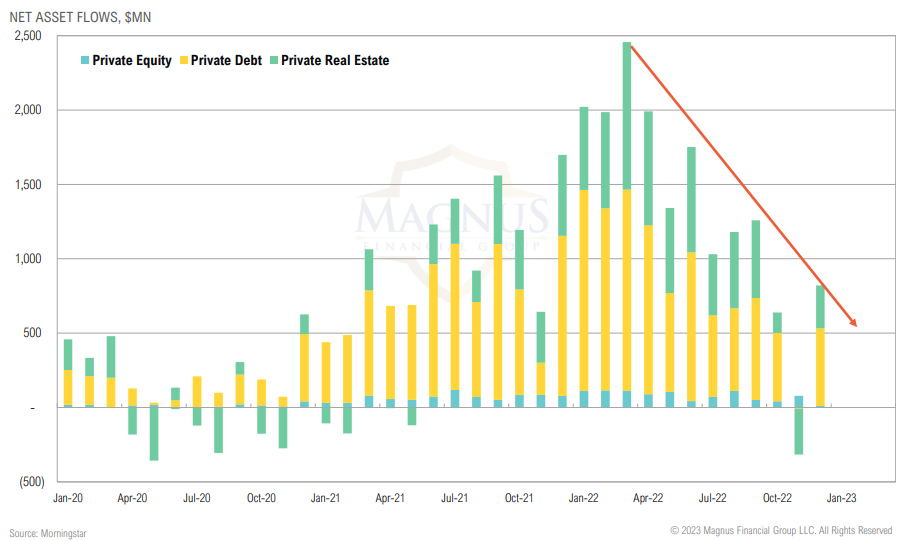
INTERVAL FUND FLOWS
Interval funds saw massive inflows in 2021 and 1H 2022, but these may be starting to reverse
ASSET ALLOCATION
Regardless of industry, as the macro uncertainty has increased, right, they’re being a little bit more cautious. So we’re seeing some delays in decision-making. We see changes in the pace of spending, and we’re seeing some pausing of the smaller deals. And all of this impacts the smaller deals more
– Julie Sweet, Accenture CEO
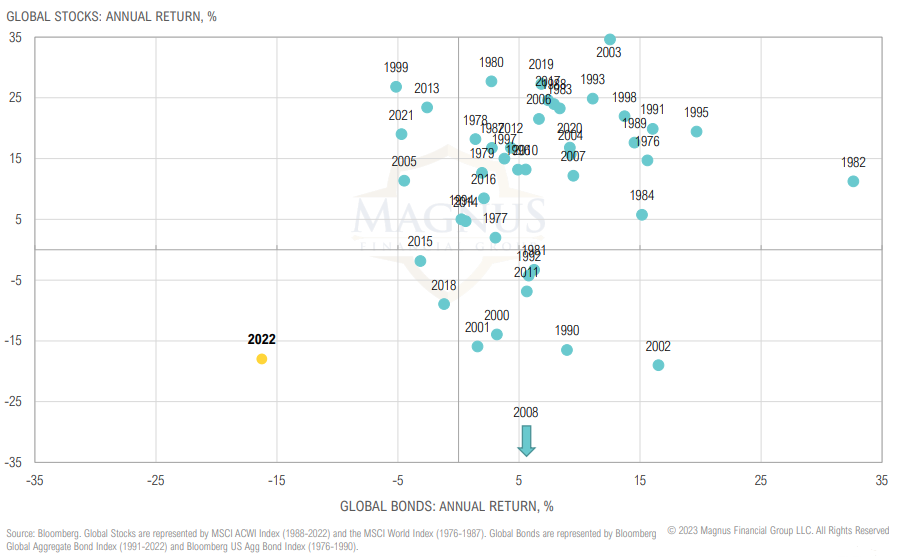
STOCKS & BONDS
2021 was an unusual year for global stocks and bonds, 2022 even more so; again, highlighting the unusual predicament the Fed is in
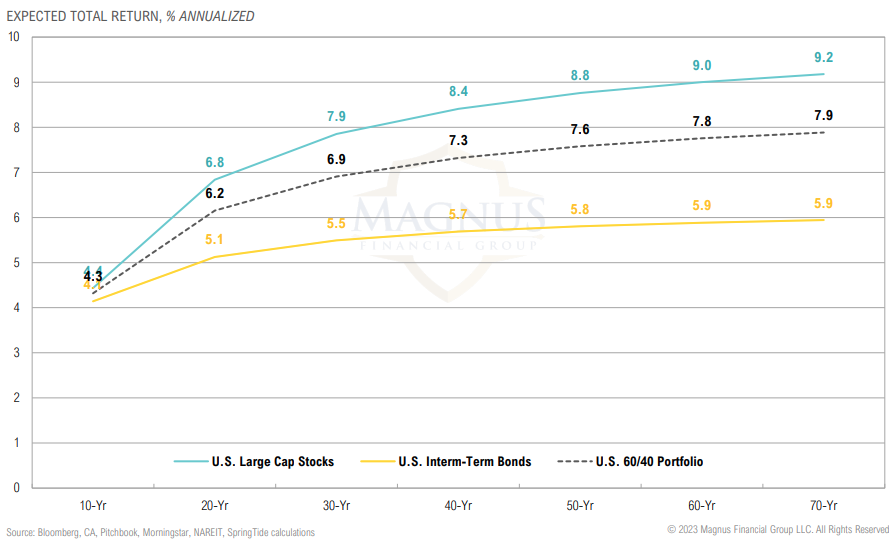
CMEs (AS OF 12/31/2022)
Expected 10-year returns for most assets fell marginally as yields fell and equity valuations rose throughout the quarter
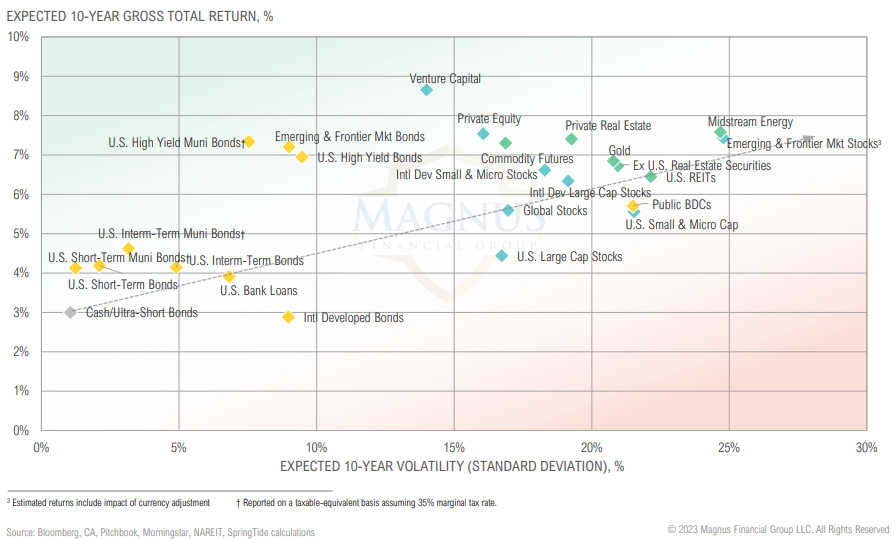
CMEs (AS OF 12/31/2022)
Fixed income returns continue to offer similar returns to U.S. large cap stocks over 10 years (pre-inflation, which is big unknown)
APPENDIX 1
ASSET CLASS DEFINITIONS
ASSET CLASS BENCHMARKS
Asset class performance was measured using the following benchmarks:
U.S. Large Cap Stocks: S&P 500 TR Index
U.S. Small & Micro Cap Stocks: Russell 2000 TR Index
Intl Dev Large Cap Stocks: MSCI EAFE GR Index
Intl Dev Small & Micro Stocks: MSCI EAFE GR Index
Emerging & Frontier Market Stocks: MSCI Emerging Markets GR Index
Global Stocks: MSCI ACWI GR Index
Private Equity: Cambridge Associates U.S. Private Equity
Venture Capital: Cambridge Associates U.S. Venture Capital
U.S. Interm-Term Muni Bonds: Bloomberg Barclays 1-10 (1-12 Yr) Muni Bond TR Index
U.S. High Yield Muni Bonds: Bloomberg Barclays High Yield Muni TR Index
U.S. Interm-Term Bonds: Bloomberg Barclays U.S. Aggregate Bond TR Index
U.S. High Yield Bonds: Bloomberg Barclays U.S. Corporate High Yield TR Index
U.S. Bank Loans: S&P/LSTA U.S. Leveraged Loan Index
Intl Developed Bonds: Bloomberg Barclays Global Aggregate ex-U.S. Index
Emerging & Frontier Market Bonds: JPMorgan EMBI Global Diversified TR Index
Public BDCs: S&P BDC Index
U.S. REITs: MSCI U.S. REIT GR Index
Ex U.S. Real Estate Securities: S&P Global Ex-U.S. Property TR Index
Private Real Estate: Cambridge Associates Real Estate
Commodity Futures: Bloomberg Commodity TR Index
Midstream Energy: Alerian MLP TR Index
Gold: LBMA Gold Price
Long-Short Equity: HFRI Equity Hedge Index
Global Macro: HFRI Macro-CTA Index
Relative Value: HFRI Relative Value Index
Closed-End Funds: S-Network Composite Closed-End TR Index
Insurance-Linked Securities: Swiss Re Global Cat Bond TR Index
Digital Assets: MVIS Crypto Compare Digital Assets 25 Index
Cash & Cash Equivalents: Bloomberg Barclays U.S. T-Bill 1-3 Month TR Index
U.S. Short-Term Muni Bonds: Bloomberg Barclays Municipal 1-3 Yr TR Index
U.S. Short-Term Bonds: Bloomberg Barclays U.S. Agg 1-3 Yr TR Index
U.S. 60/40: 60% S&P 500 TR Index 40% Bloomberg Barclays U.S. Aggregate Bond TR Index
Global 60/40: 60% MSCI ACWI GR Index 40% Bloomberg Barclays Global Aggregate Bond TR Index