“The U.S. economy remained resilient in the quarter. The finalization of tax reform and potential deregulation are positive for the economic outlook; however, significant risks persist—including from tariffs and trade uncertainty, worsening geopolitical conditions, high fiscal deficits & elevated asset prices.”
Jamie Dimon, JPMorgan CEO
Cartoon
Fireworks

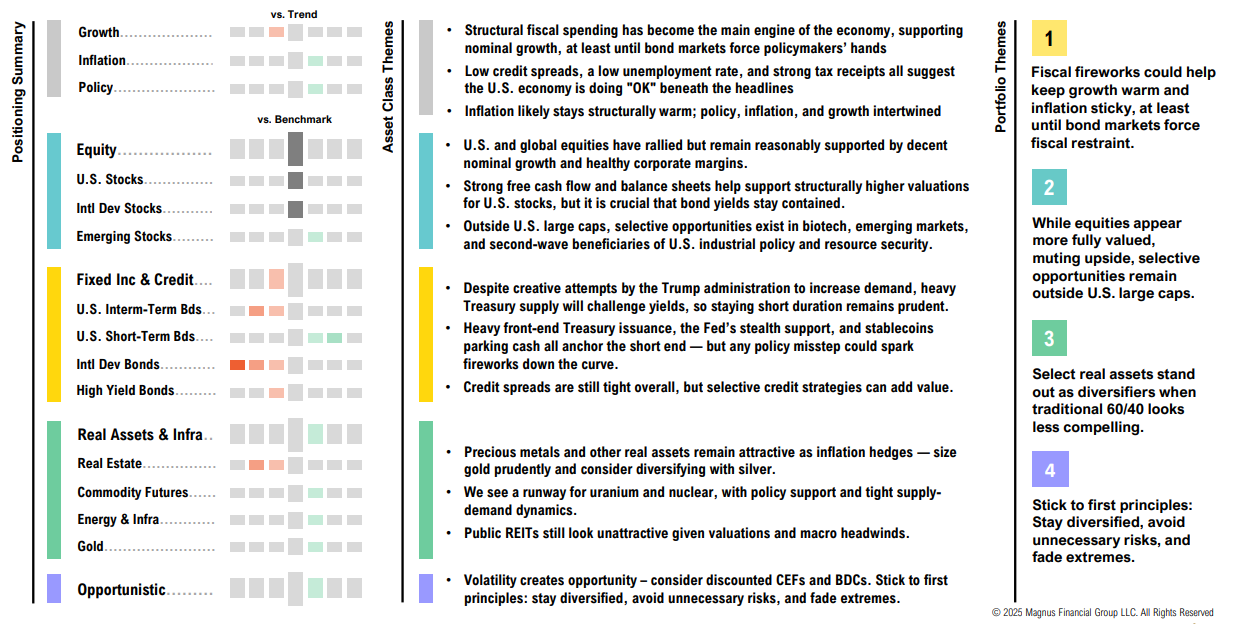
Summary
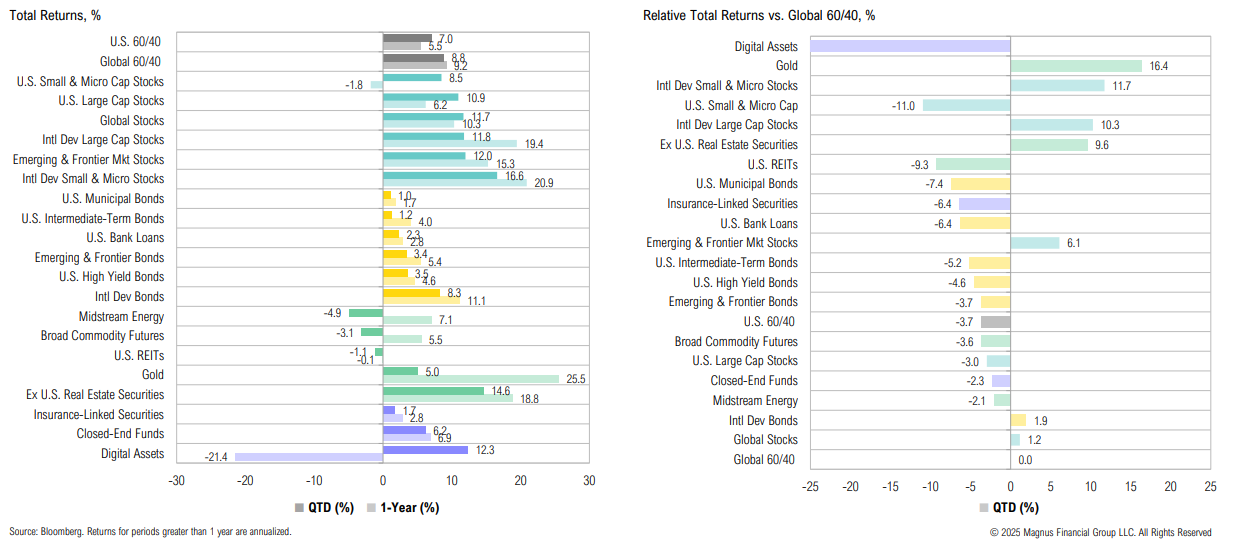
Q2, 2025 Market Review
Major winners over Q2 included intl. dev small & micro-cap stocks (+16.6%) and ex-U.S. real estate (+14.6%) while midstream energy (-4.9%) and broad commodity futures (-3.1%) lagged
Summary
A Guide to the Market Outlook
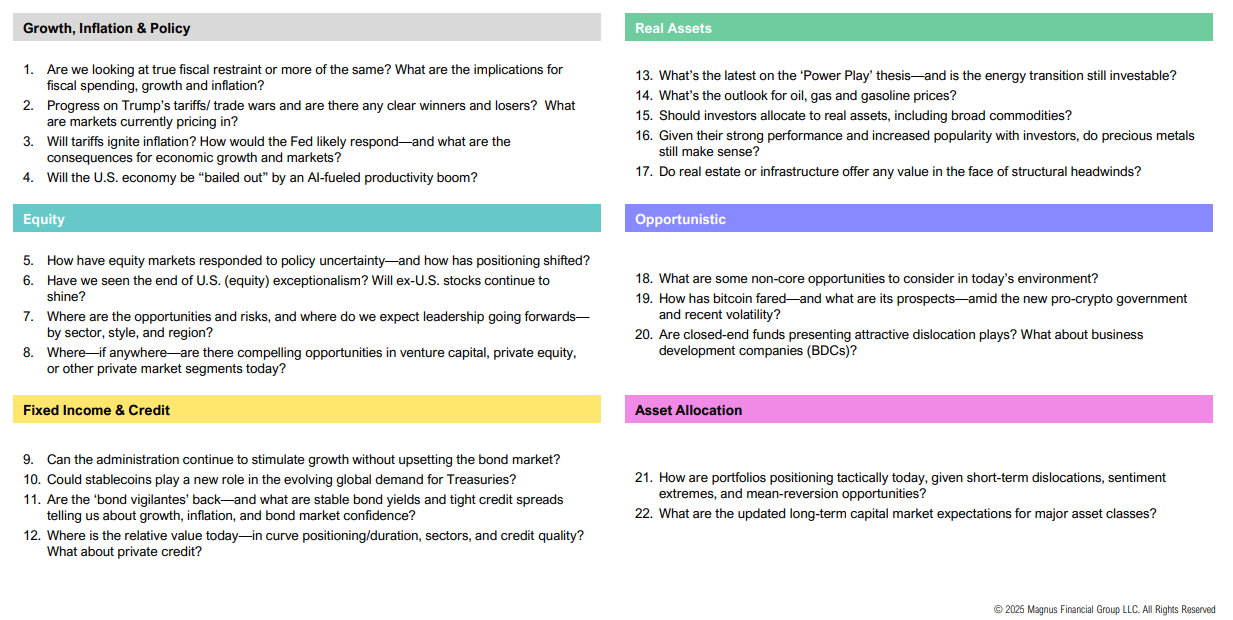
Growth, Inflation & Policy
1. Are we looking at true fiscal restraint or more of the same? What are the implications for fiscal spending, growth and inflation?
2.Progress on Trump’s tariffs/ trade wars and are there any clear winners and losers? What are markets currently pricing in?
3. Will tariffs ignite inflation? How would the Fed likely respond—and what are the consequences for economic growth and markets?
4. Will the U.S. economy be “bailed out” by an AI-fueled productivity boom?
Fiscal Deficit
Fiscal YTD, the deficit is larger than the past two years; the deficit (currently at $1.27tn) is expected to widen to $1.94tn

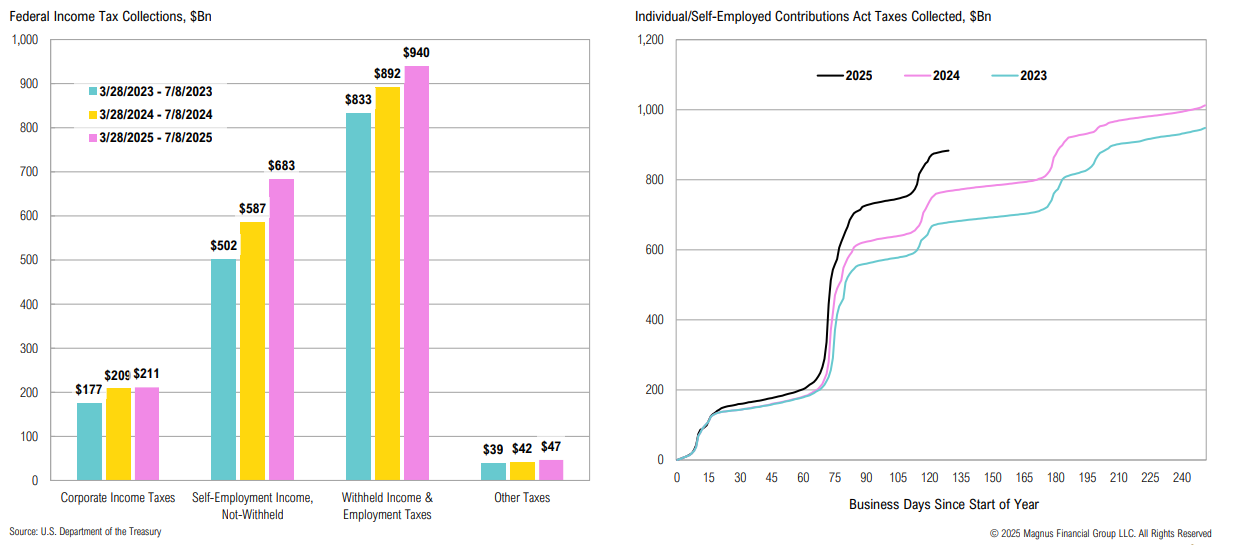
Tax Collections
Relative to recent years, 2025 federal income tax collections have increased; non-withheld individual income tax collection have increased by 15% year-over-year
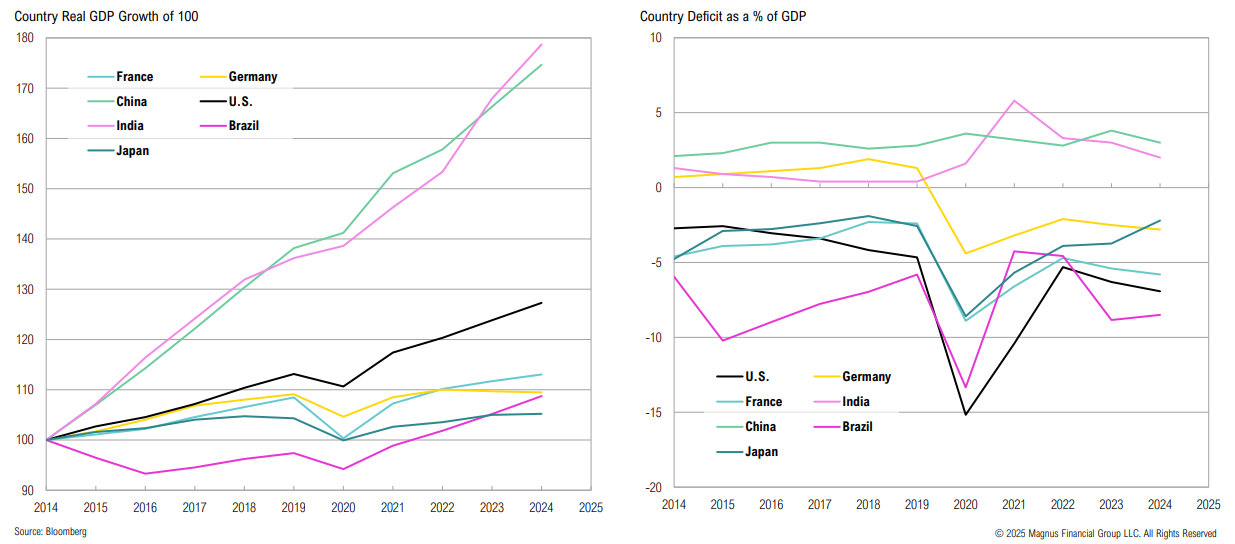
Economic Growth
U.S. economic growth has far outpaced developed market peers over the past decade, but with wider deficits
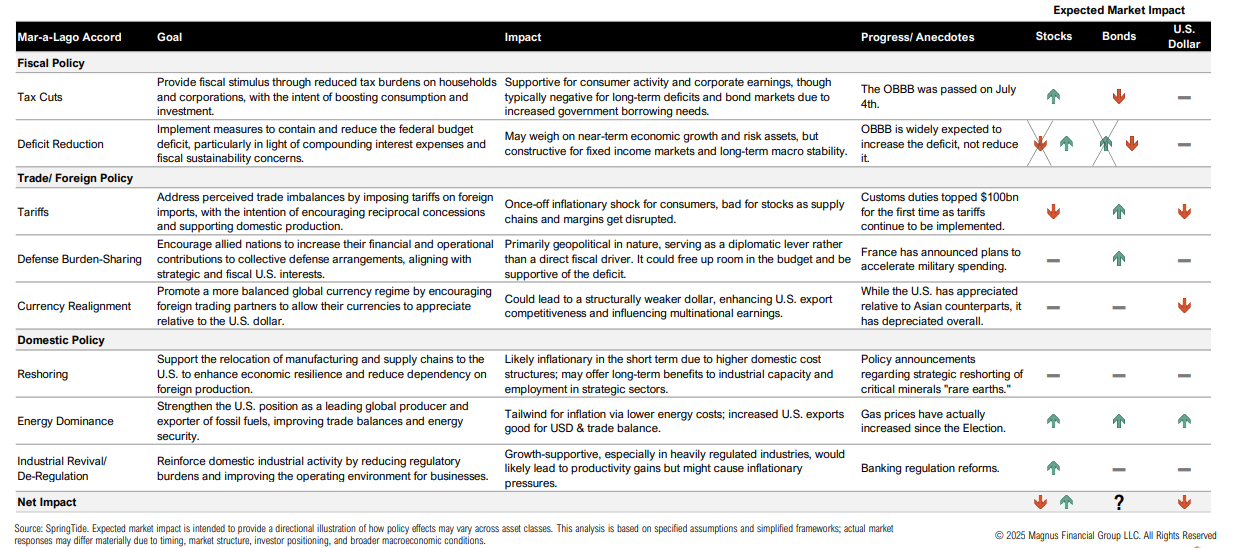
Mar-A-Lago Accord
Policy backdrop is mixed: several have the potential to be net positive for growth and risky assets over time, but almost all come with trade-offs and hinge on bond market ‘consent’
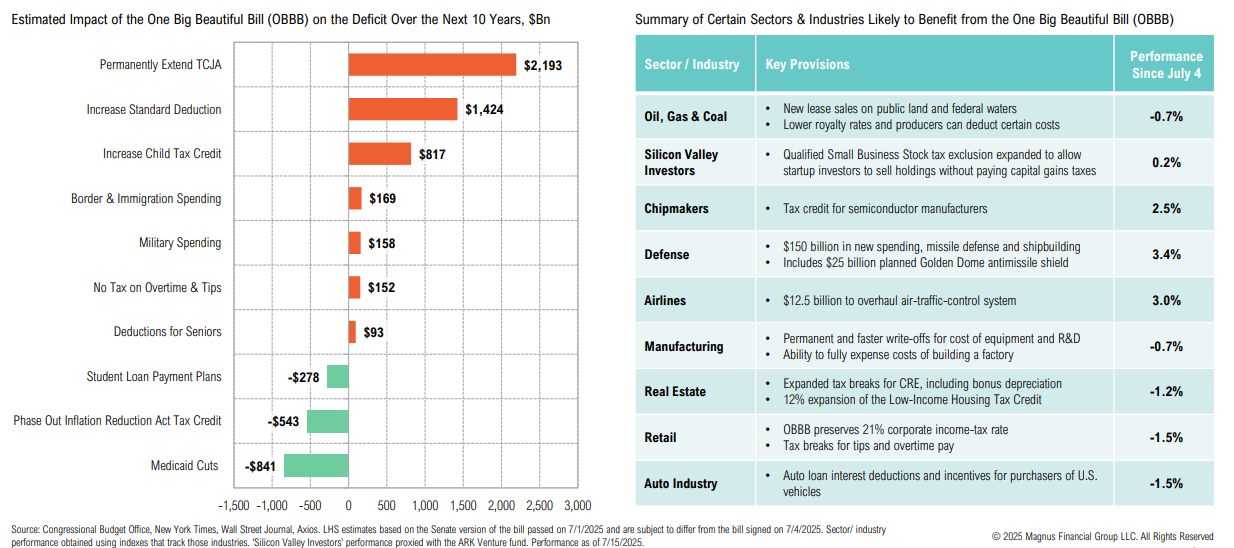
OBBB
Certain One Big Beautiful Bill components may offset some of the increased spending; potential sector beneficiaries of the bill include chipmakers, manufacturers and retail
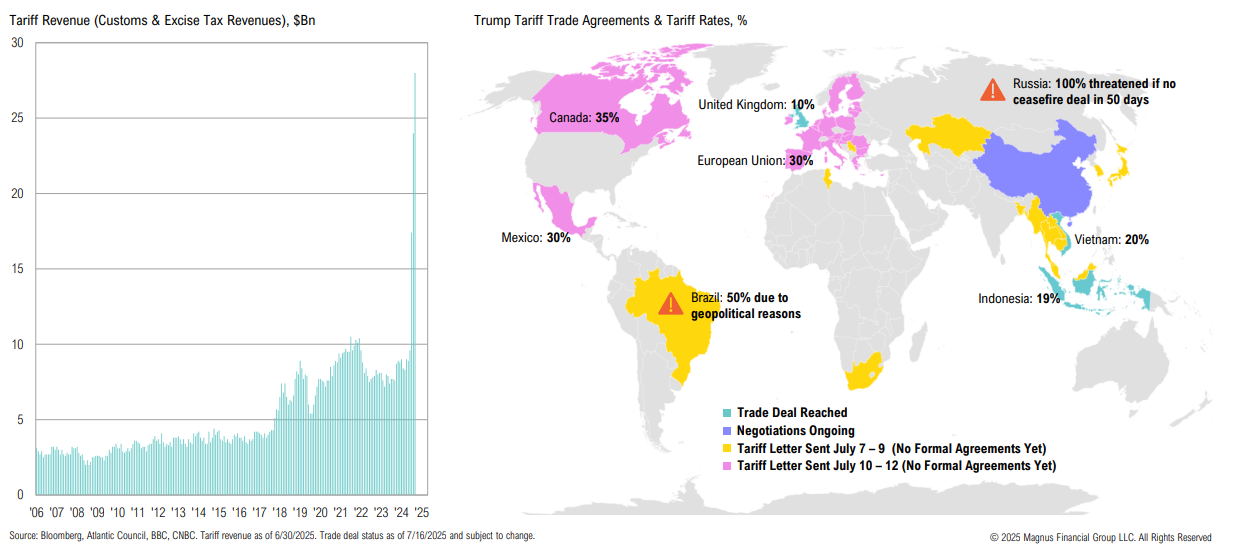
Trade War
Tariff revenues reached a record $28 billion in June; last week, over 20 countries have received tariff letters from Trump with new rates to be imposed on August 1
U.S. Dollar
A weaker dollar is also part of Trump’s policy preference (boost U.S. exports, support domestic manufacturing); the U.S. Dollar Index reached a three-year low on July 2

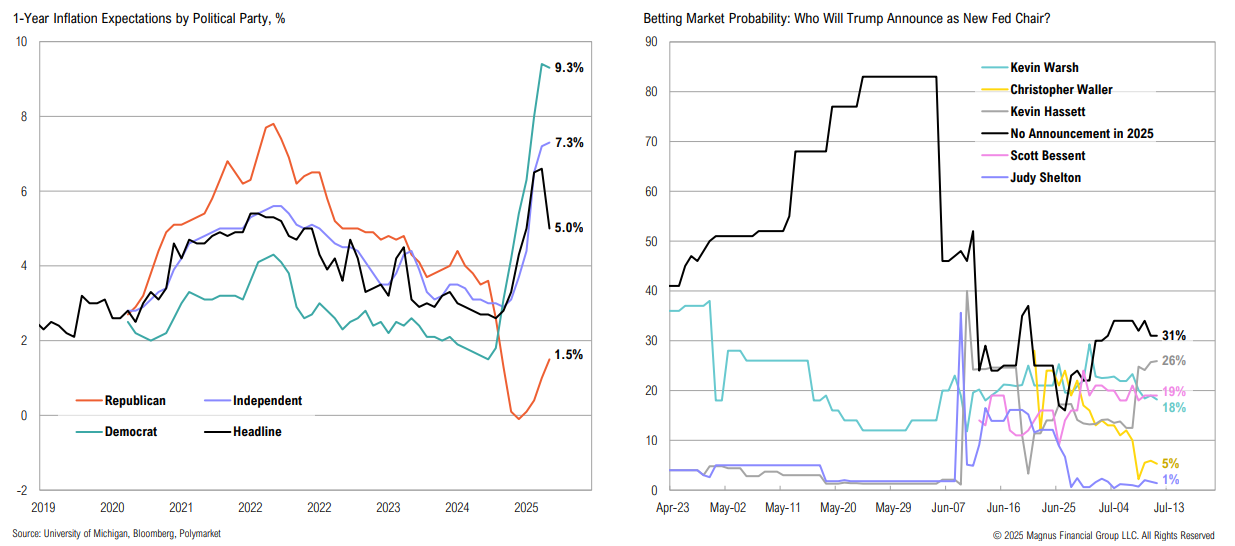
Inflation & the Fed
Inflation expectations have started to moderate; Trump is expected to announce new Fed chair well before Powell’s term ends in May 2026 (frontrunner Hassett favors aggressive cuts)
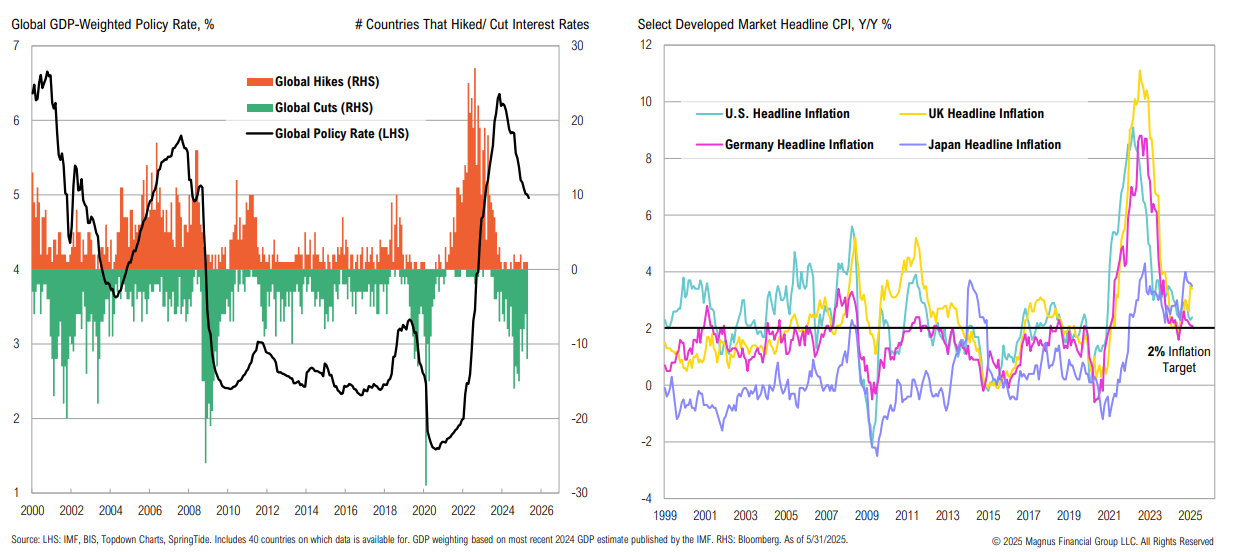
Global Policy
Globally, the unwind of the 2022 – 2023 hiking cycle continues—this is the greatest cutting cycle outside of a major recession or pandemic; DM inflation remains >2%
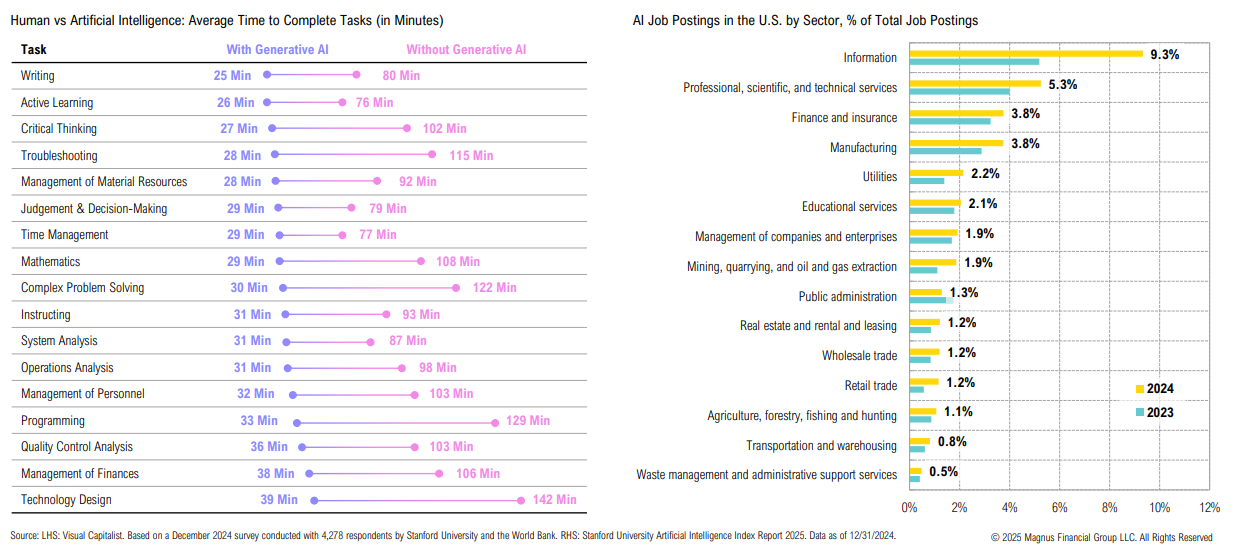
AI
A Stanford University + World Bank study shows how generative AI is increasing efficiency for a number of tasks; AI-related job openings are increasing
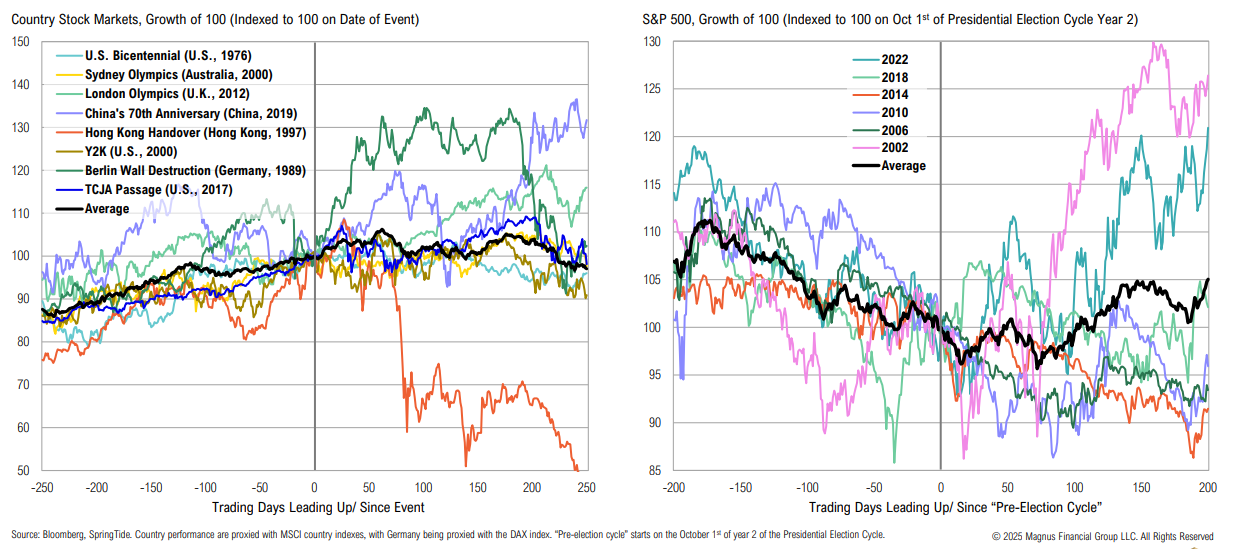
U.S. Anniversary
While the U.S.’s 250th anniversary will be a celebratory milestone, similar historic events have often coincided with market tops; the typical “pre-election cycle” rally is usually preceded by a selloff
Equity:
1. How have equity markets responded to policy uncertainty—and how has positioning shifted?
2. Have we seen the end of U.S. (equity) exceptionalism? Will ex-U.S. stocks continue to shine?
3. Where are the opportunities and risks, and where do we expect leadership going forwards—by sector, style, and region?
4. Where—if anywhere—are there compelling opportunities in venture capital, private equity, or other private market segments today?
U.S. Large Cap Stocks
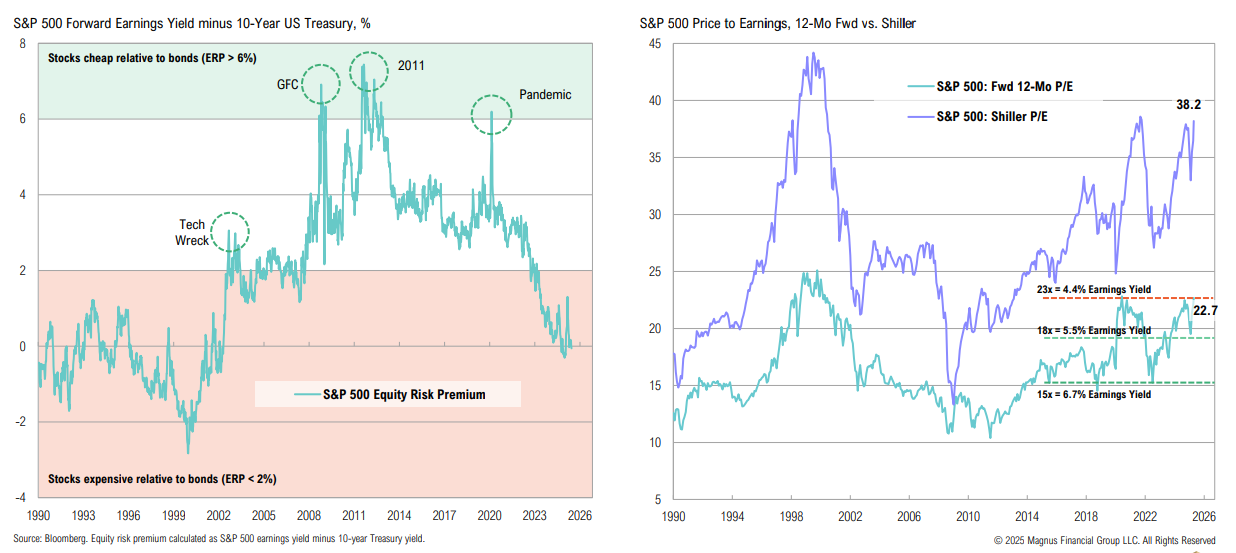
Using a simple yield-to-earnings yield comparison (ERP), U.S. stocks are less attractively priced vis-à-vis bonds than at any point since the 1990s; U.S. large cap valuations are nearing extremes
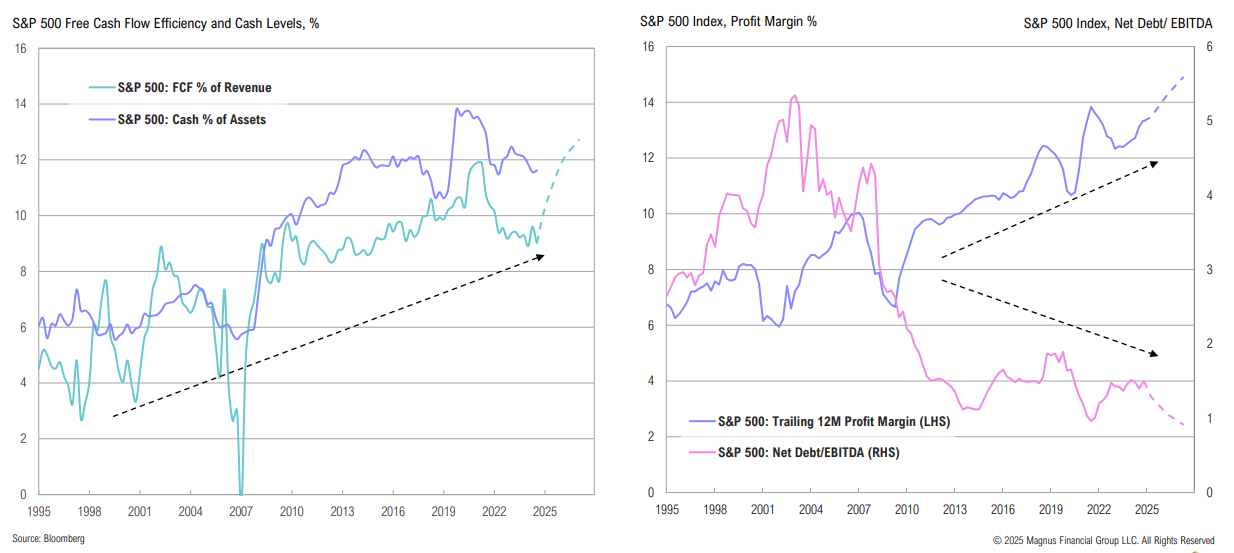
The corporate sector is strong by historical standards: capital expenditures, R&D, and tech investment have boosted scalability and efficiency, enabling improved margins and reducing debt
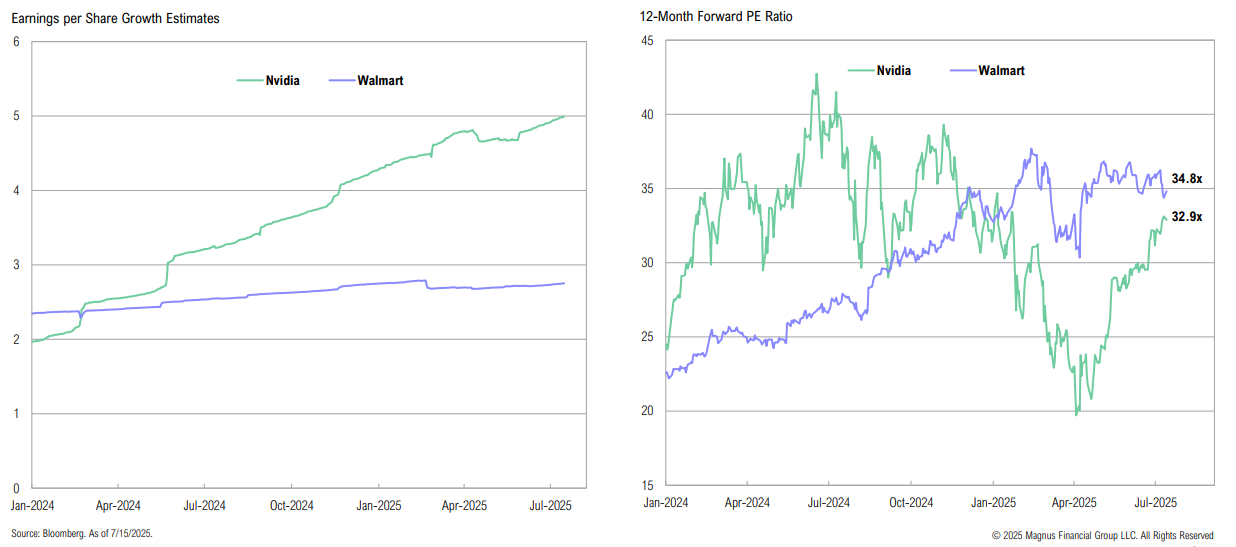
On a forward P/E basis, Nvidia is cheaper than Walmart—despite notably stronger earnings growth expectations
“I’ve been hoping we get a question in regards to this. We had our highest cash sales day for the month of July in a 100-year history yesterday. So, advanced bookings are doing well… I think, at the beginning, when people were fearful, we saw the further out bookings going away. We see those starting to return again and hopefully those trends continue.”
Glen Hauenstein, Delta Air President
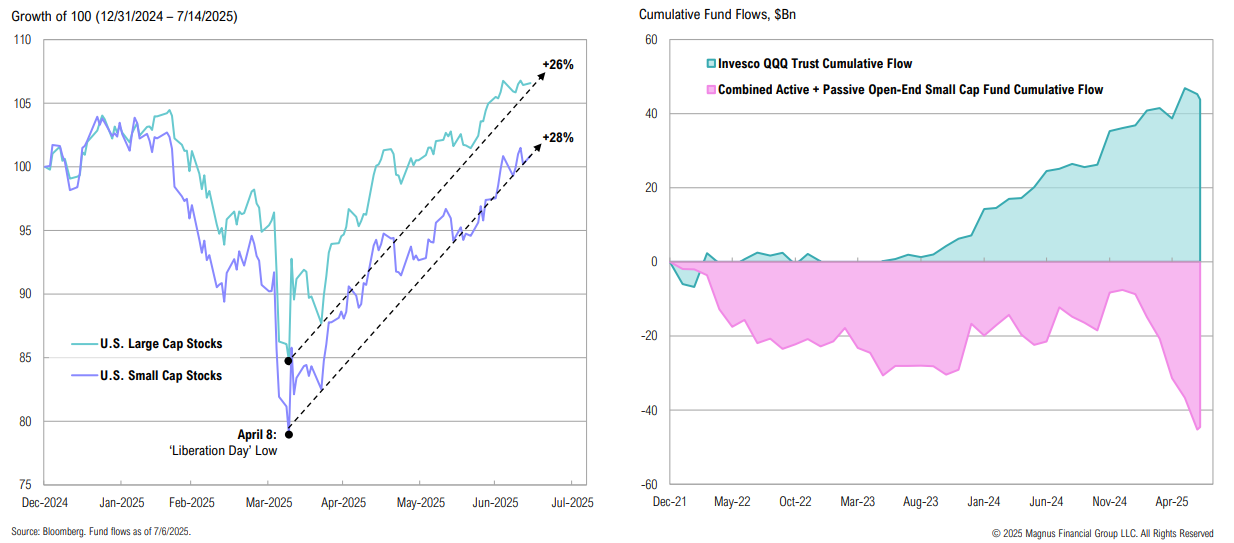
Small cap stocks have outperformed large caps since the April 8 lows (by 2%); YTD, open-end small cap funds have seen $37Bn in outflows—fully offset by inflows into the QQQ ETF alone
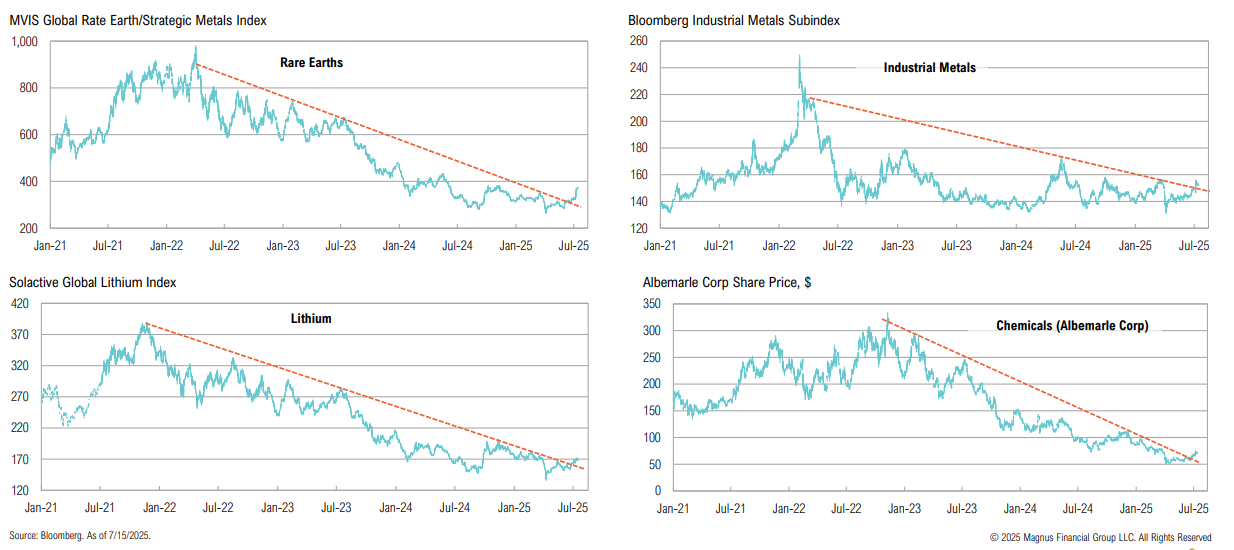
Breakouts
Big Breakout Basket: a shift in policy towards industrialization/ onshoring has caused some smaller sectors to break out from substantial downtrends
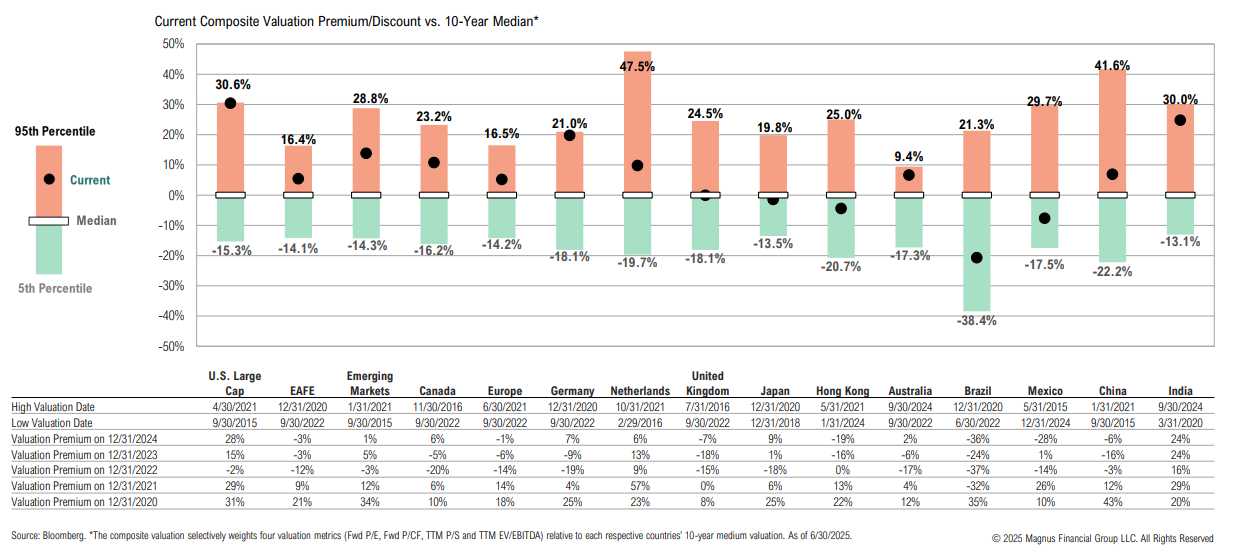
Country Valuations
The U.S. is trading above its 10-year 95th percentile high valuation; Brazil & Mexico are the only countries trading meaningfully below median, with Hong Kong and Japan just below median
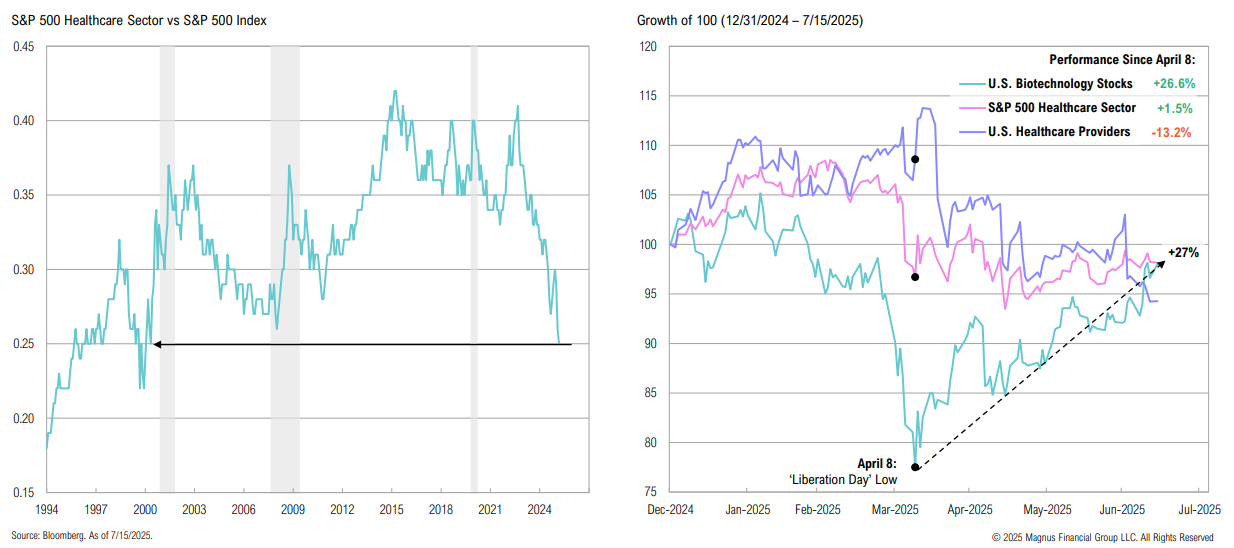
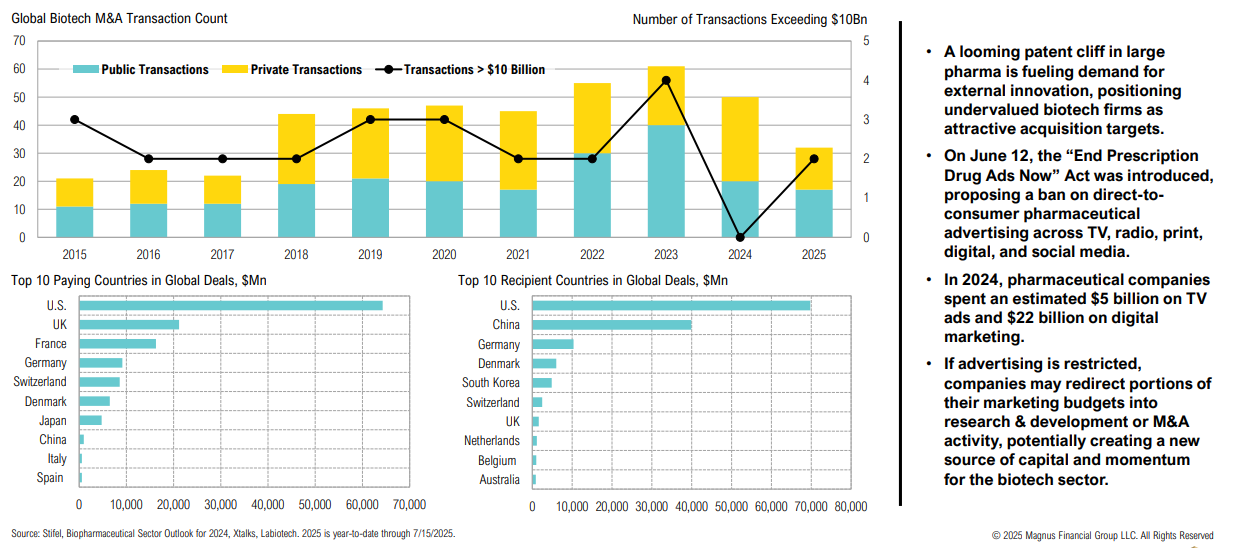
U.S. Healthcare
Relative to the S&P 500, the healthcare sector is at its lowest level since 2000; while the healthcare sector is up 1.5% since the April 8 lows, the biotech sector has gained 27%
Biotech M&A activity has been strong YTD; sector tailwinds including a looming patent cliff in big pharma is driving demand for external innovation, and a bill proposed to ban pharma advertising
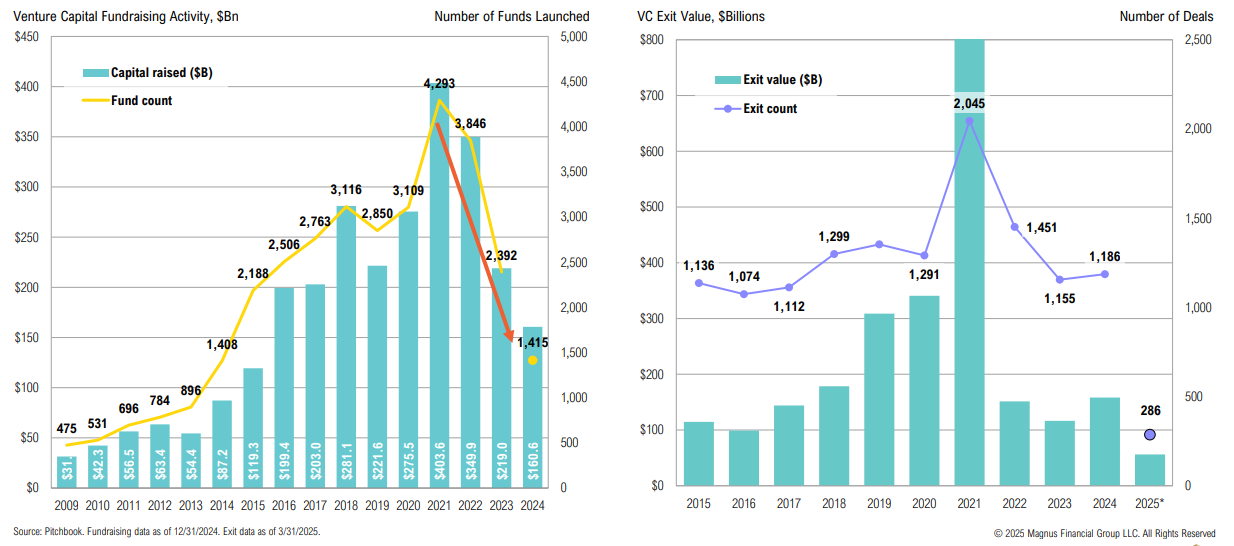
Venture Capital
Unfavorable multiples and market volatility continued to weigh on exits; while LPs are showing urgency for liquidity, GPs are achieving liquidity through secondaries and continuation funds
Fixed Income & Credit:
1. Can the administration continue to stimulate growth without upsetting the bond market?
2. Could stablecoins play a new role in the evolving global demand for Treasuries?
3. Are the ‘bond vigilantes’ back—and what are stable bond yields and tight credit spreads telling us about growth, inflation, and bond market confidence?
4. Where is the relative value today—in curve positioning/duration, sectors, and credit quality? What about private credit?
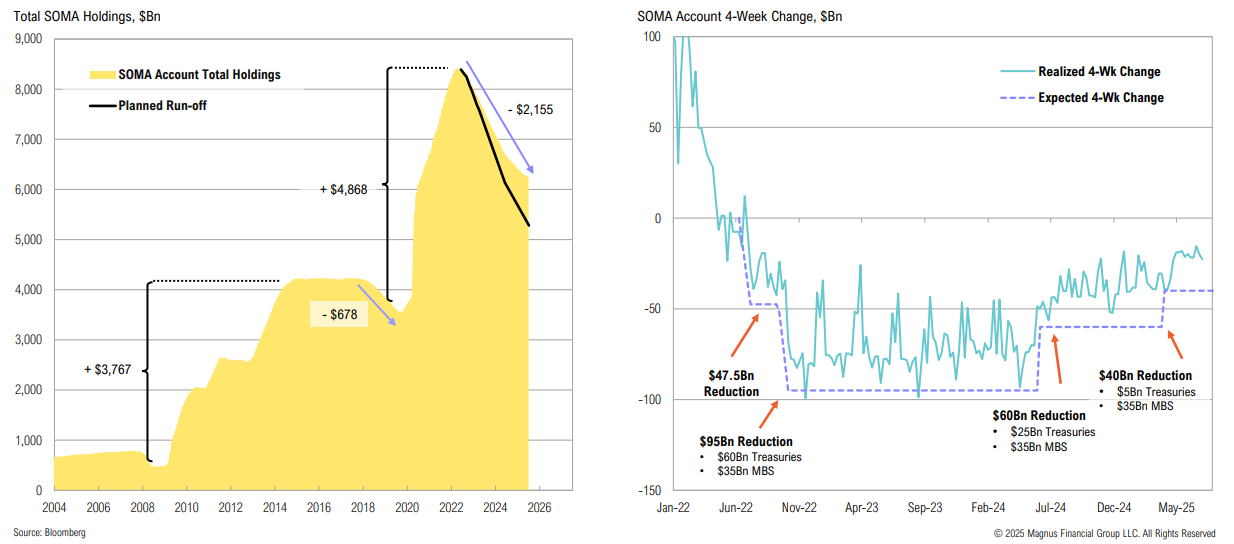
QT
Since April 1, the Fed has slowed QT from $60 billion to $40 billion, with a maximum Treasury runoff of $5 billion per month
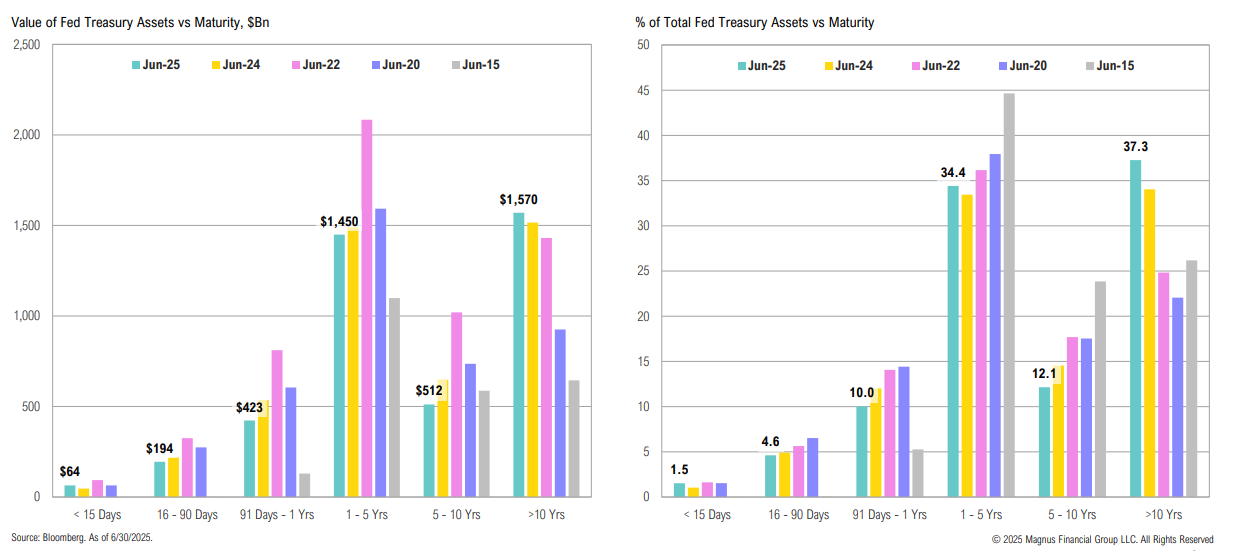
Treasury Assets
~16% ($681bn) of the Fed’s balance sheet assets are maturing within the next year—far more than the $5bn monthly roll-off target; this implies the Fed will purchase >$600bn in debt (with the proceeds of maturing bonds)
Banks & Treasuries
U.S. regulators have proposed easing certain capital rules for large domestic U.S.banks which could allow them to hold more Treasuries (and improve market liquidity)
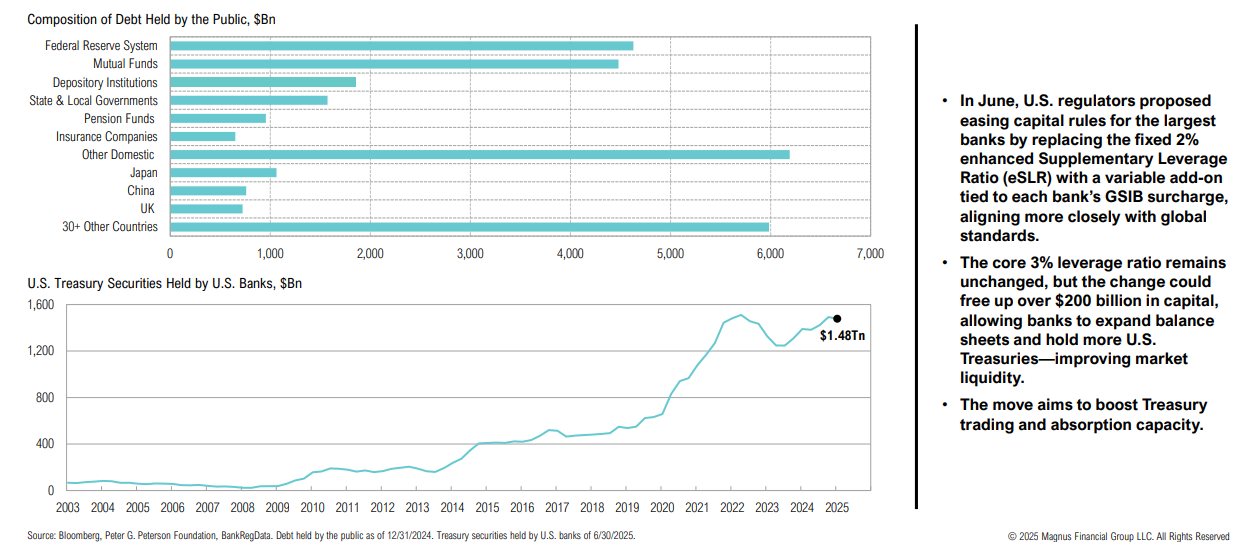
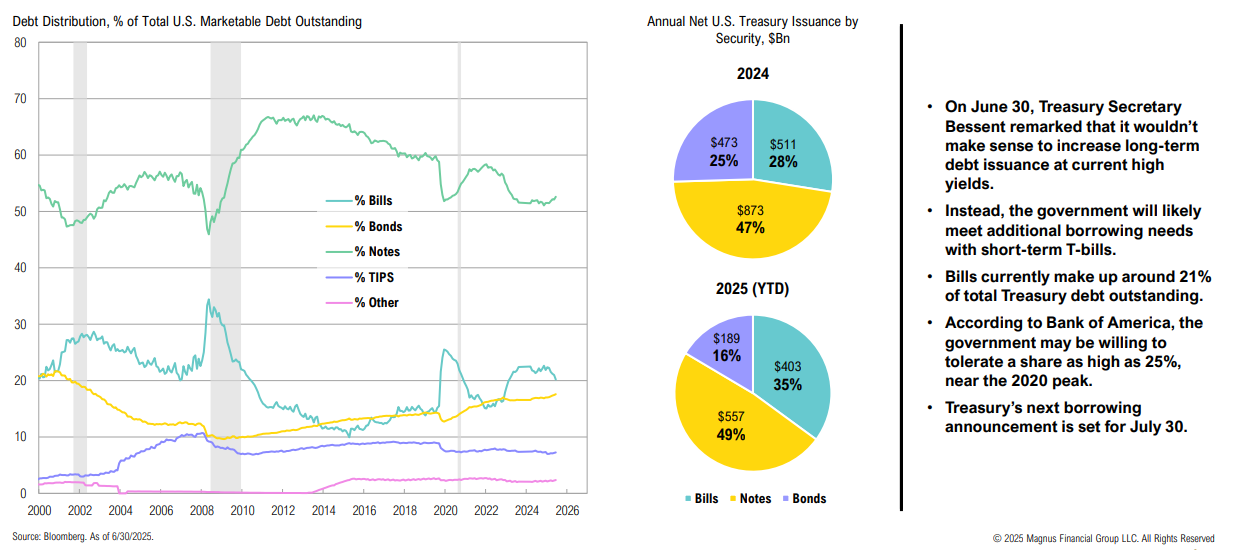
Treasury Assets
Treasury Secretary Bessent has stated that raising long-term debt at current high yields is unlikely; additional borrowing will likely come from short-term T-bills
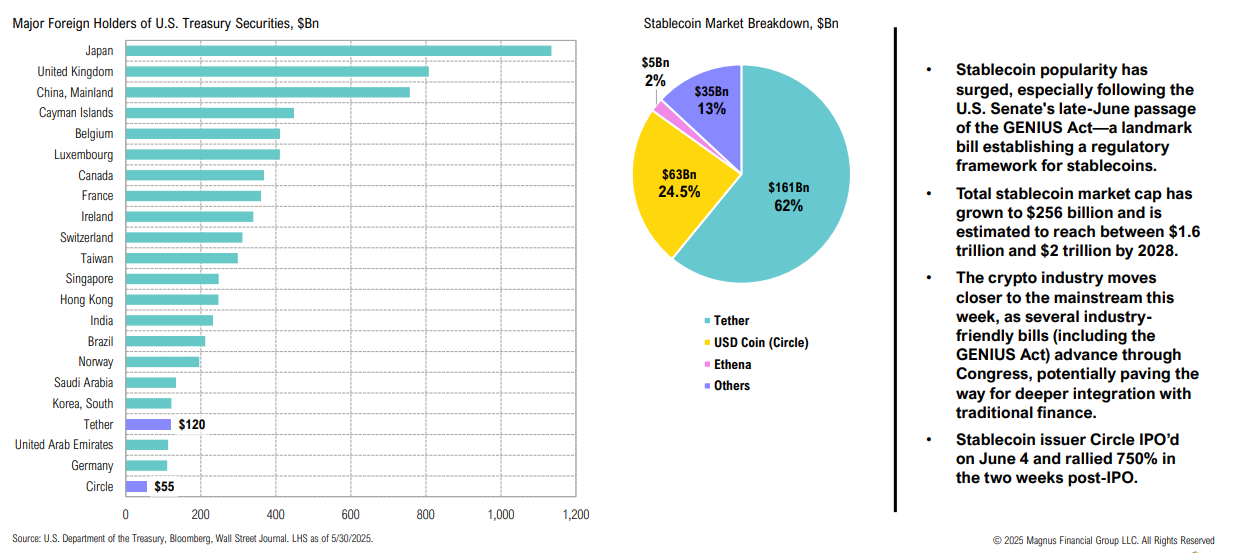
Stablecoins
The top two stablecoins surpass Germany, the UAE, and South Korea in Treasury holdings; popularity is growing, boosted by several crypto-friendly bills set to become law this week
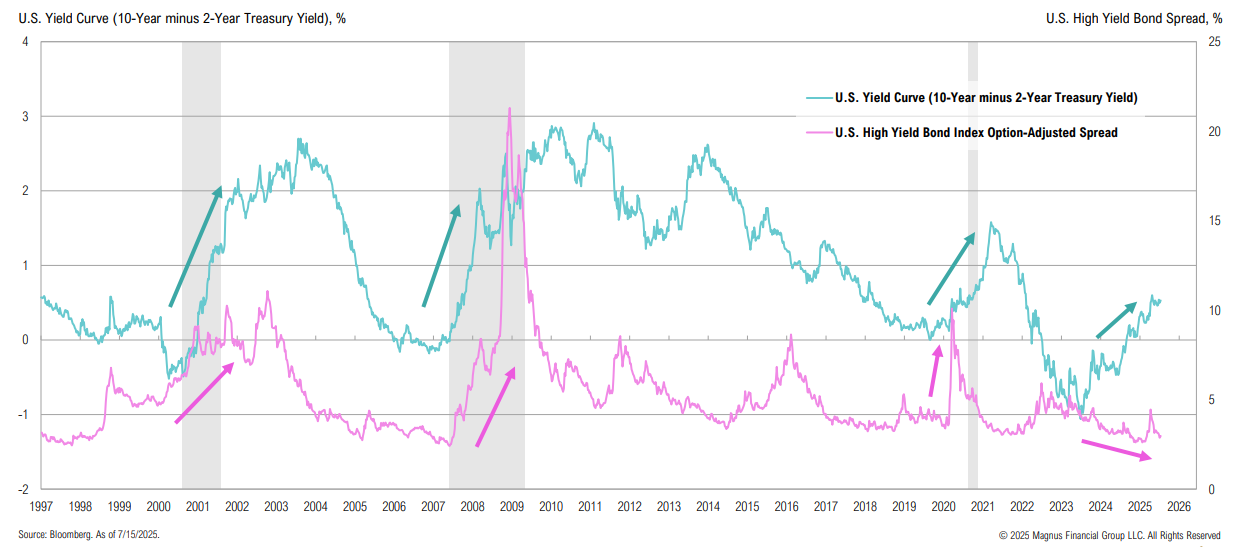
Yield Curve
While the yield curve continues to steepen, credit spreads remain low by any long-term standard
Corporate Yields
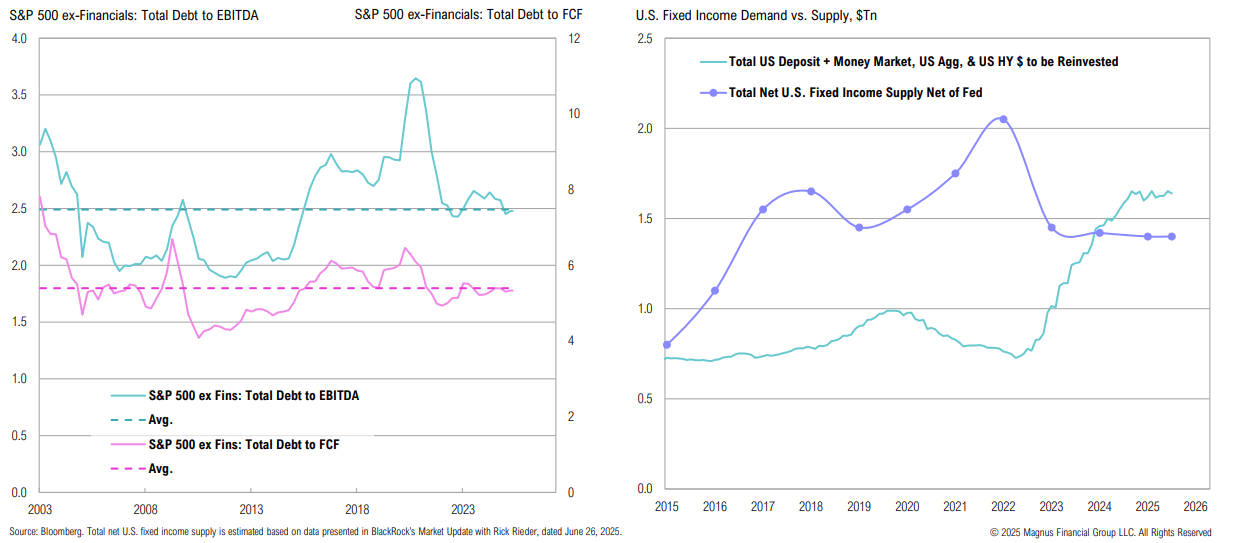
Tight U.S. corporate yields are a result of stable fundamentals, manageable maturities, and strong supply-demand dynamics; the U.S. fixed income market is generating over $1.6tn in annual coupons—more than the total net supply of U.S. fixed income
Private Credit
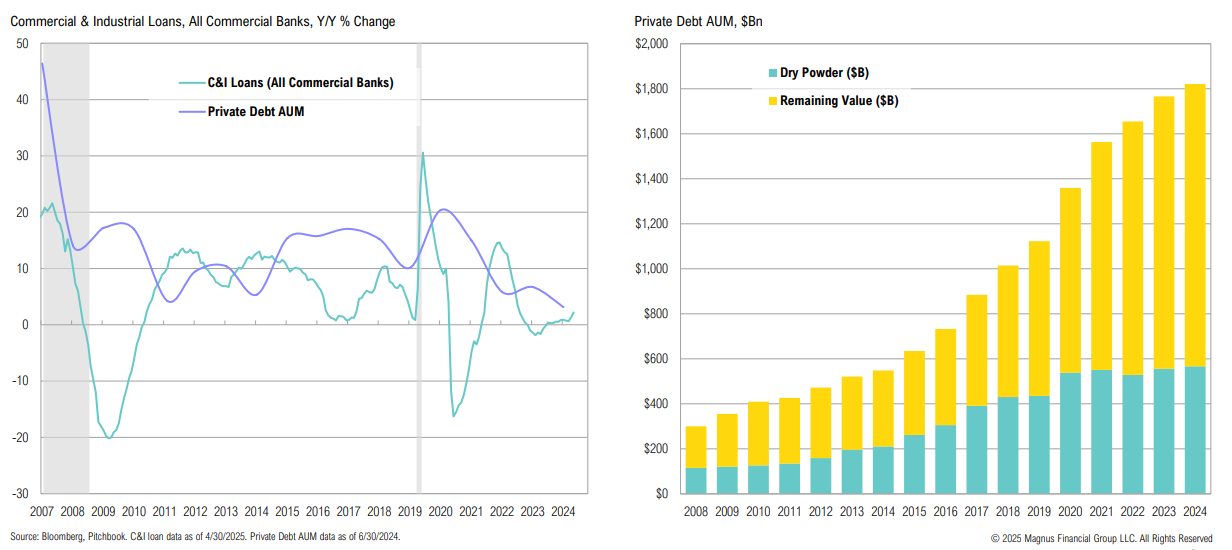
Private credit AUM has increased for the 16th consecutive year, albeit at a slower pace
Real Assets:
1. What’s the latest on the ‘Power Play’ thesis—and is the energy transition still investable?
2. What’s the outlook for oil, gas and gasoline prices?
3. Should investors allocate to real assets, including broad commodities?
4. Given their strong performance and increased popularity with investors, do precious metals still make sense?
5. Do real estate or infrastructure offer any value in the face of structural headwinds?
Real Assets & Infrastructure
Power Play
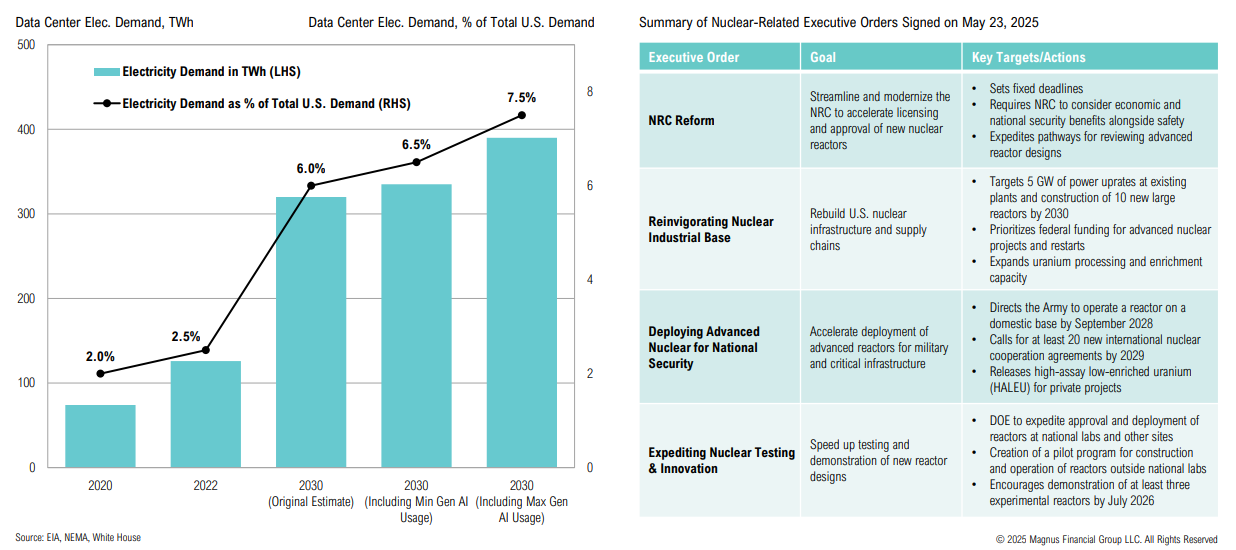
White House nuclear executive orders represent a strategic shift, positioning nuclear power as central to energy reliability (particularly in rising data-center driven demand) and economic growth
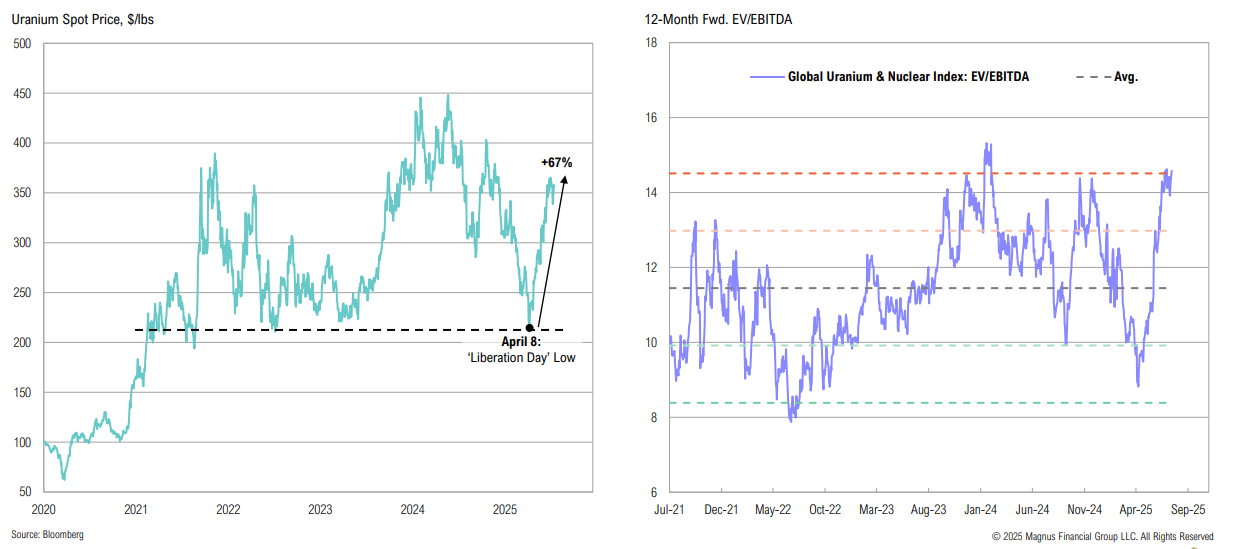
Uranium and nuclear stocks have rebounded on strong sentiment, fundamentals and ongoing policy support; while the long-term thesis remains intact, valuations are stretched
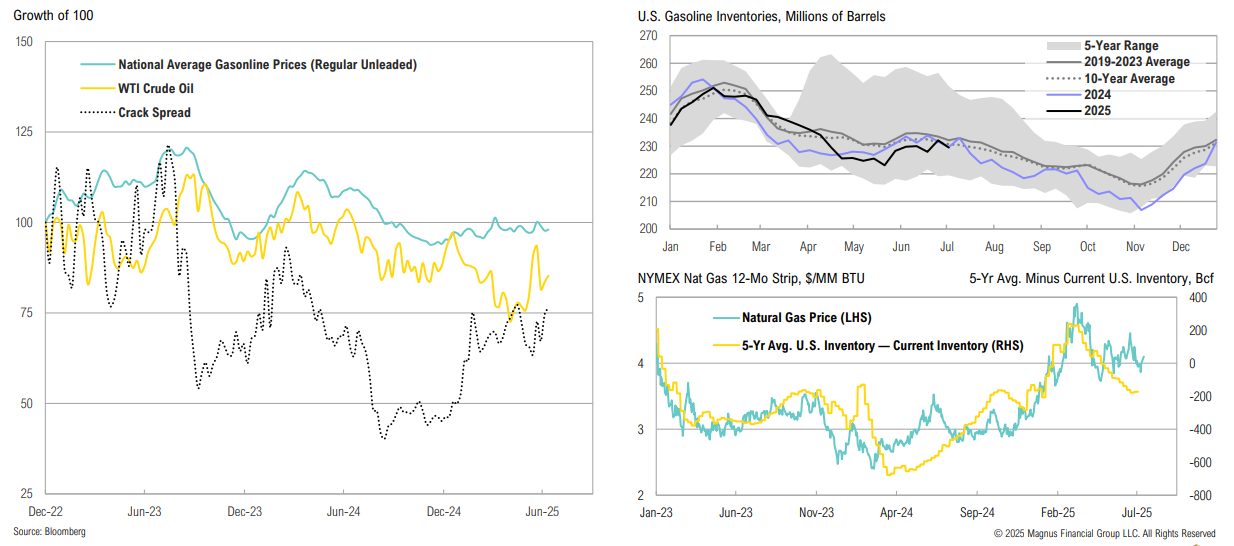
U.S. Energy Markets
Balanced energy markets: due to higher refining costs, lower crude prices ≠ cheaper gasoline; softer natural gas prices amid strong seasonal restocking signal looser market conditions
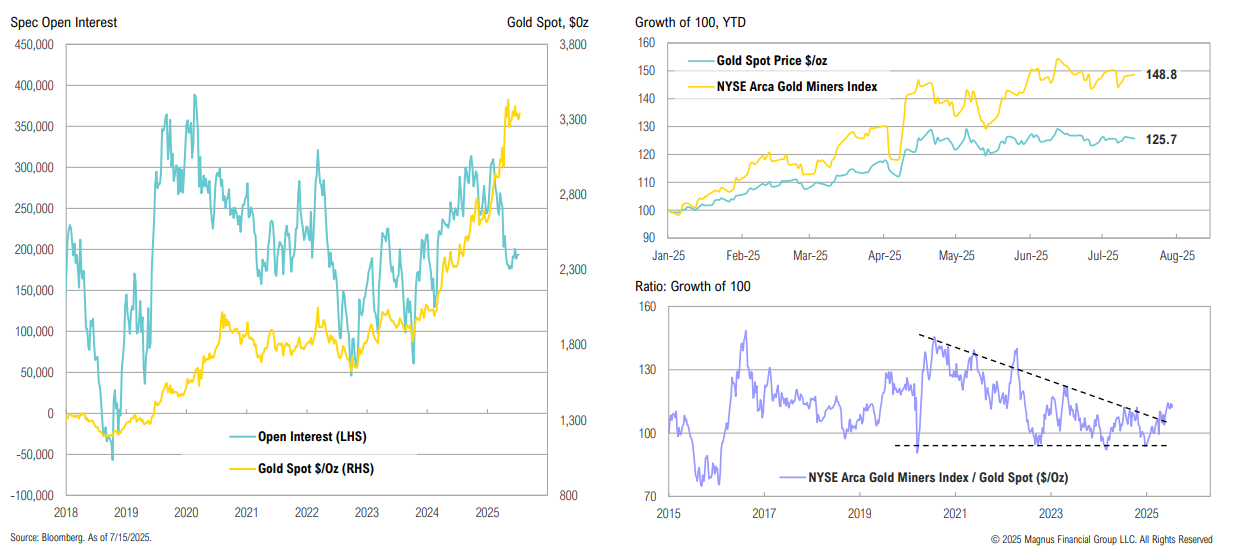
Precious Metals & Gold
Despite only modestly off all-time highs, gold spec positioning has declined; while gold miners have seen strong YTD outperformance, fundamentals remain attractive
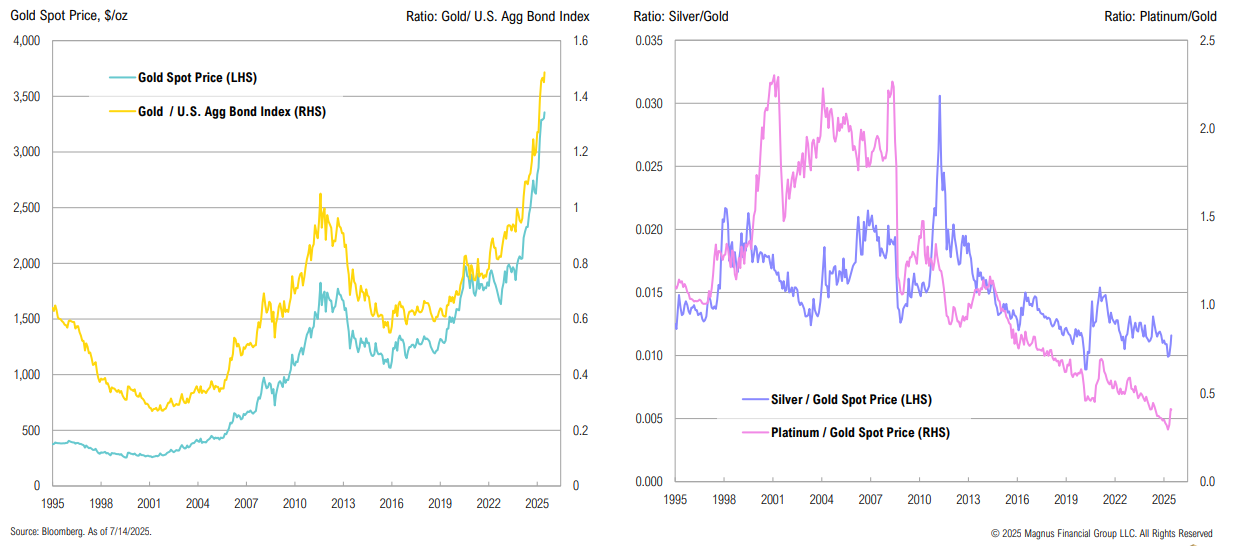
Gold has significantly outperformed bonds long term, despite offering no yield; platinum and silver (which share some of gold’s precious metal attributes) are trading near 30-year lows relative to gold
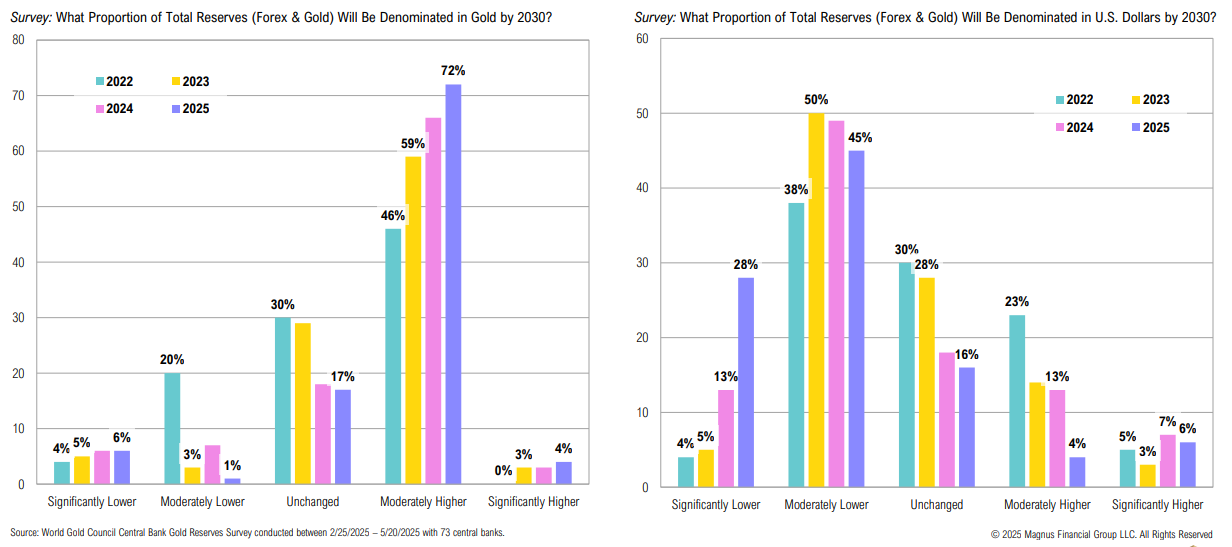
A World Gold Council 2025 survey of 73 central banks indicates sustained demand for gold, as reliance on the U.S. dollar declines
“The expectation is with the growth in standard living around the world with AI, the energy demand in the world will continue to grow through 2050. It’s estimated there will be 15% more energy required despite the efficiencies between now and that time. The world needs reliable, affordable energy. It also needs to reduce emissions. And that’s why we call it an and equation. You have to grow energy supply, you also have to reduce emissions.”
Neil Chapman, Exxon Mobil Senior Vice President
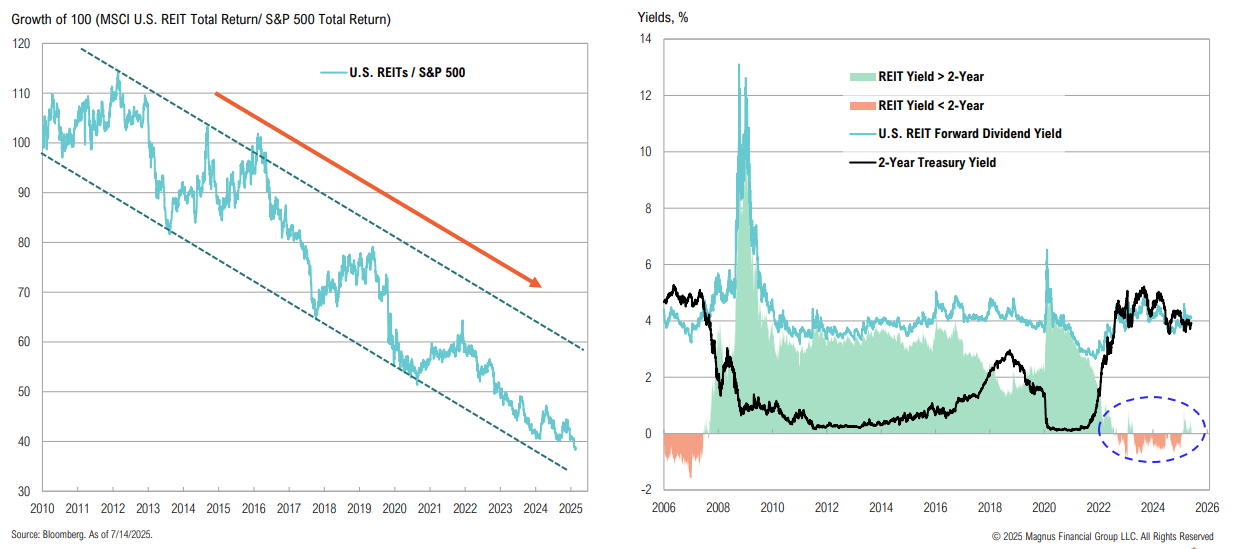
REITs
The stark underperformance of U.S. REITs continues with REITs making new lows relative to the S&P 500; REIT yields remain unattractive relative to Treasury yields
Opportunistic:
1. What are some non-core opportunities to consider in today’s environment?
2. How has bitcoin fared—and what are its prospects—amid the new pro-crypto government and recent volatility?
3. Are closed-end funds presenting attractive dislocation plays? What about business development companies (BDCs)?
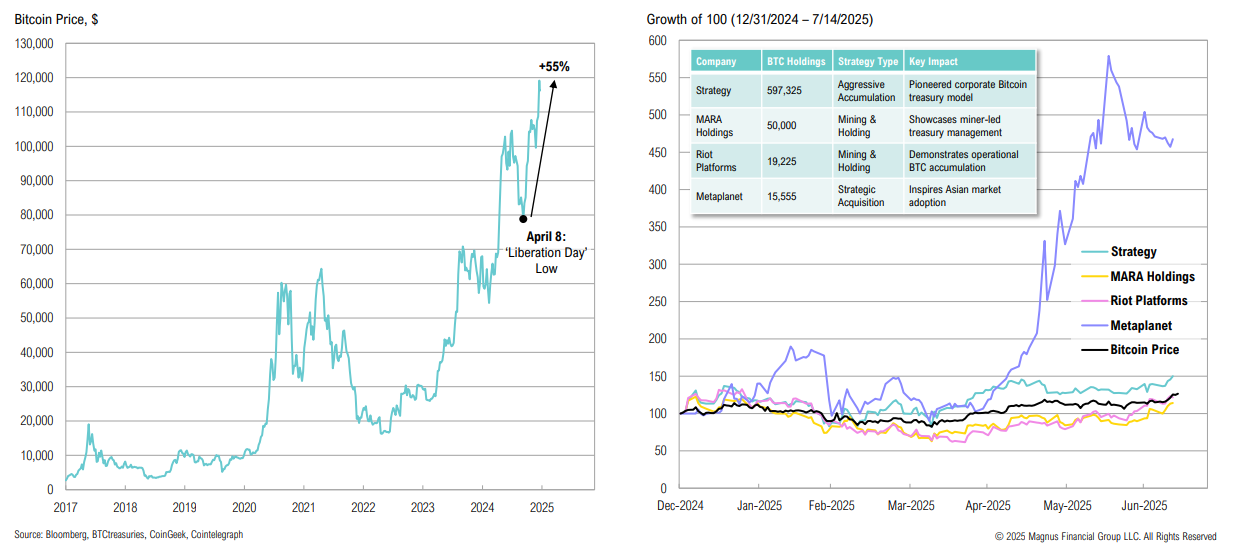
Bitcoin
Bitcoin this week reached $120,000 for the first time; several firms have adopted unique treasury strategies, influencing both the crypto market and corporate treasury practices
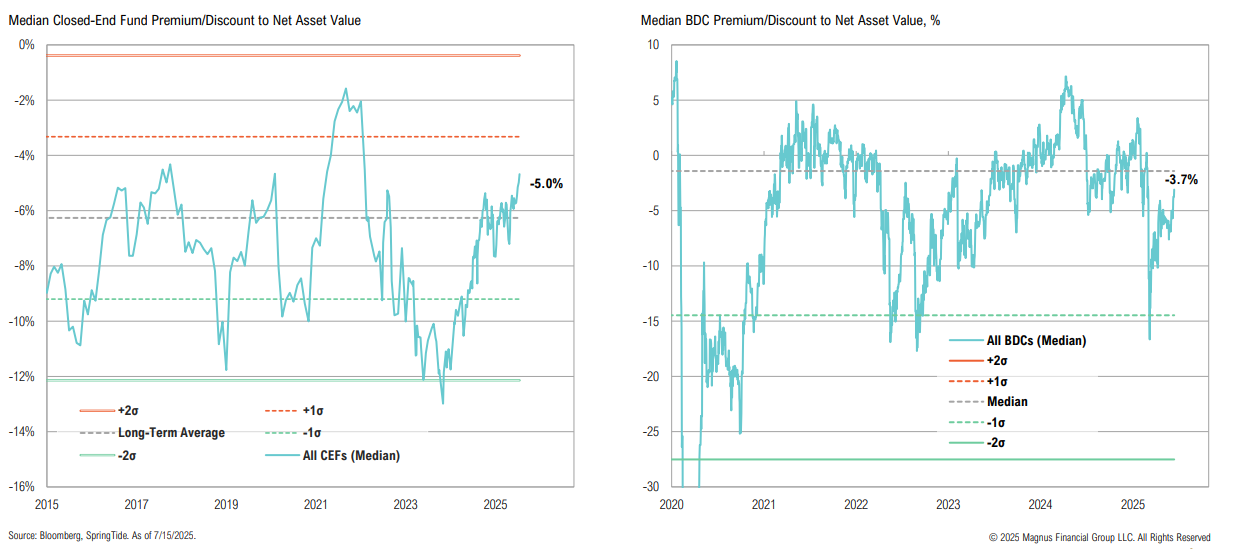
CEFs & BDCs
Although median discounts across both the closed-end fund and BDC universes remain relatively tight, we continue to find compelling pockets of value
Asset Allocation:
1. How are portfolios positioning tactically today, given short-term dislocations, sentiment extremes, and mean-reversion opportunities?
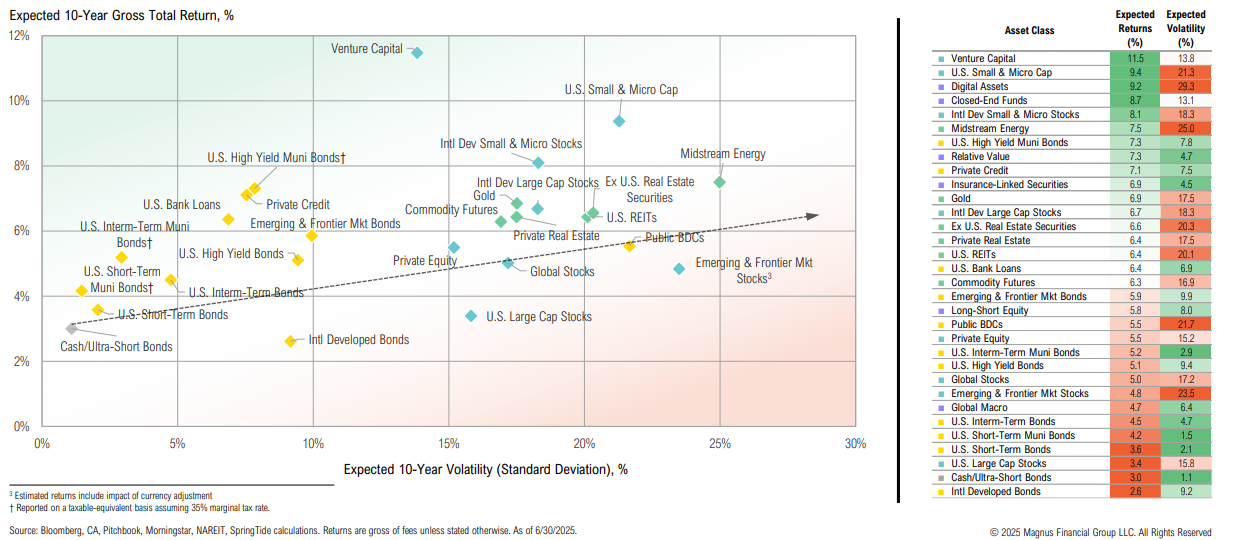
2. What are the updated long-term capital market expectations for major asset classes?
Views
CMEs
Higher equity valuations have resulted in more muted long-term forward returns, with bonds and credit looking relatively more attractive
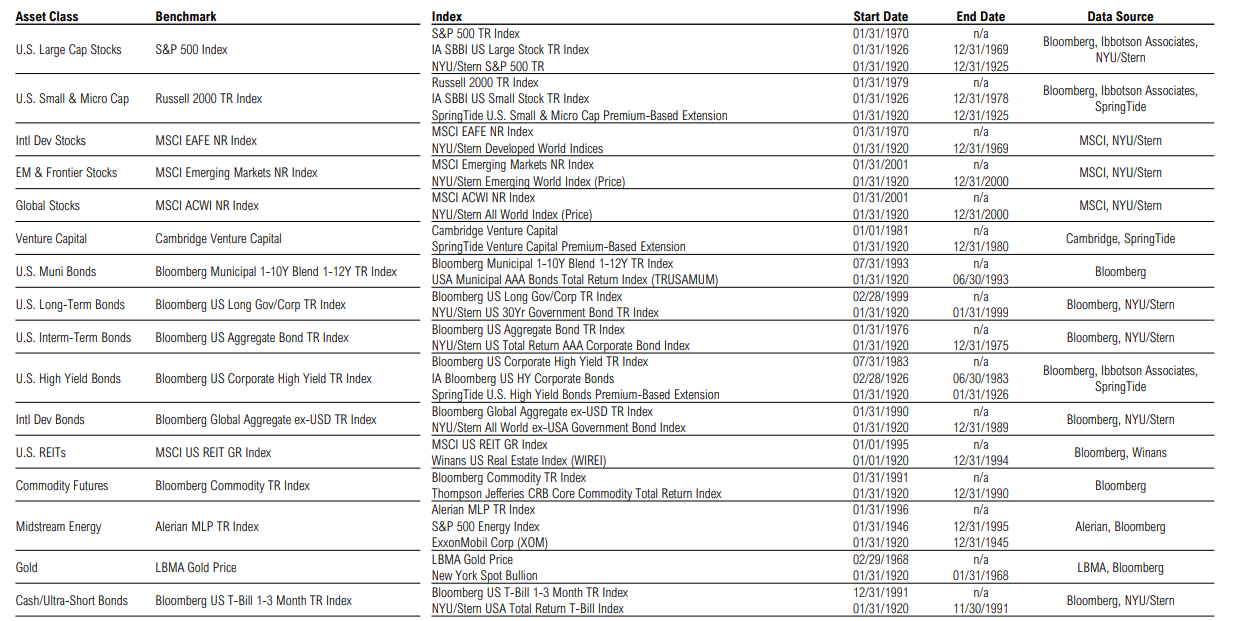
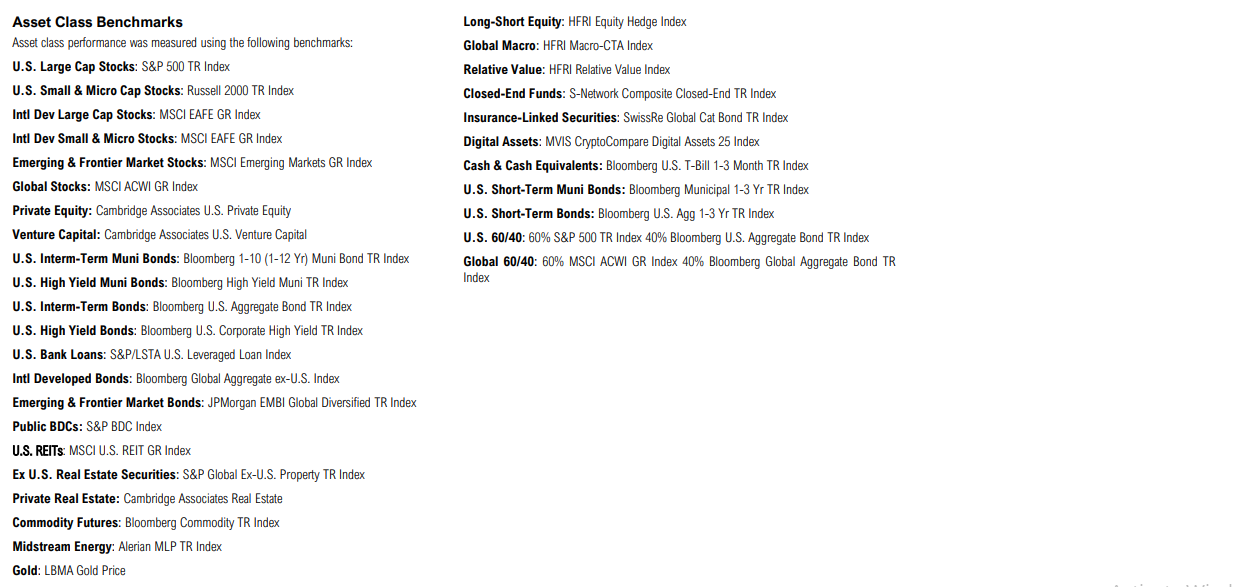
Appendix
Asset Class Definitions