
Dashboard

Economic Calendar

The Speed of the Reflation through 1H21 Increases the Odds that 2H21 Will See Decelerating Growth and Inflation

Deceleration Expected in Y/Y Growth & Inflation
Weekly Asset Class Returns
Global Manufacturing Activity Was Robust in June
54% of U.S. Population Has at Least One Dose (47% Fully Vaccinated)
Industrial Production & Leading Indicators Peak as Base Effects Wane
U.S. Unemployment Claims & Equity Drawdowns
Big Jump in Global Inflation Due to Base Effects
Inflation Picked Up, Following Leading Indicators
Market Implied Inflation Has Rolled Over in Recent Weeks
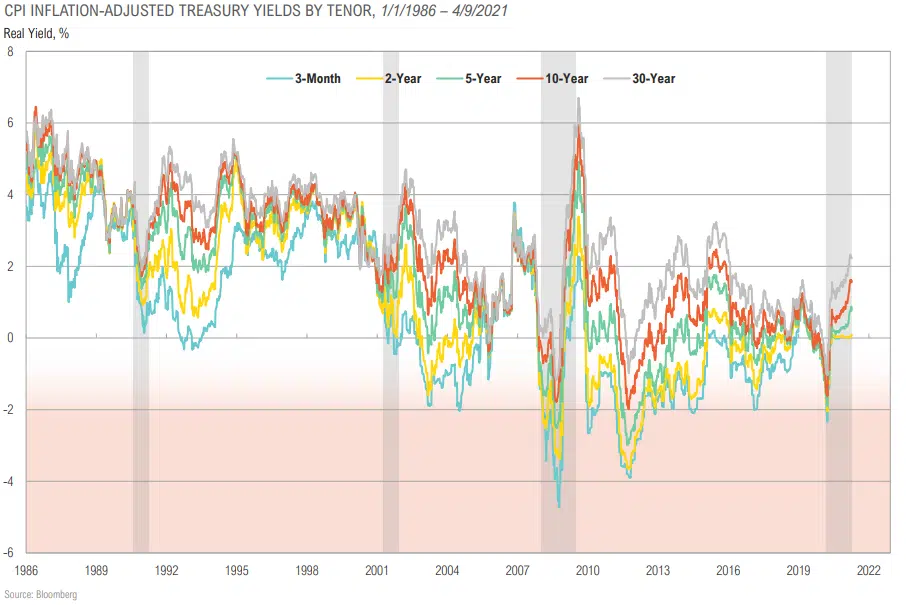
Real Yields Continue to Trend Lower
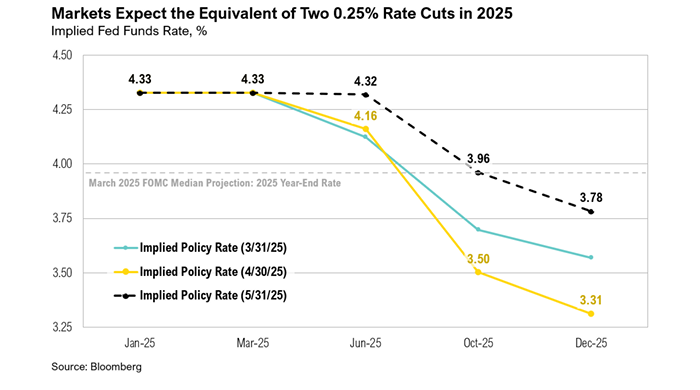
Policymaker vs. Market Rate Expectations
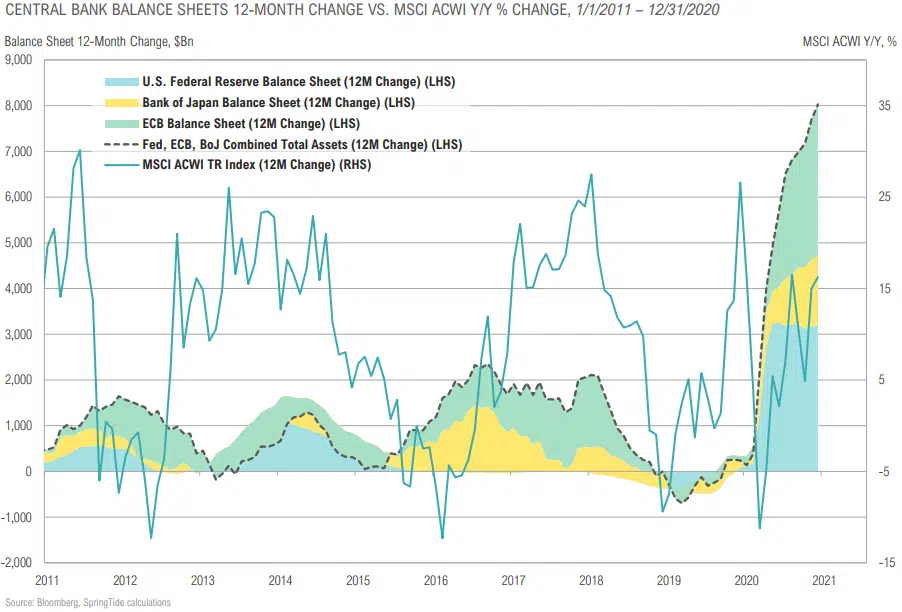
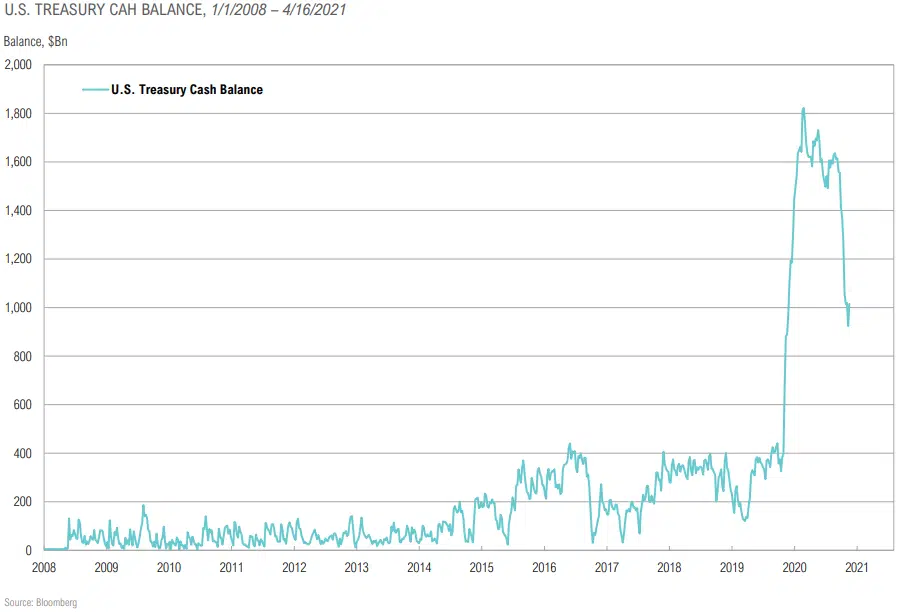
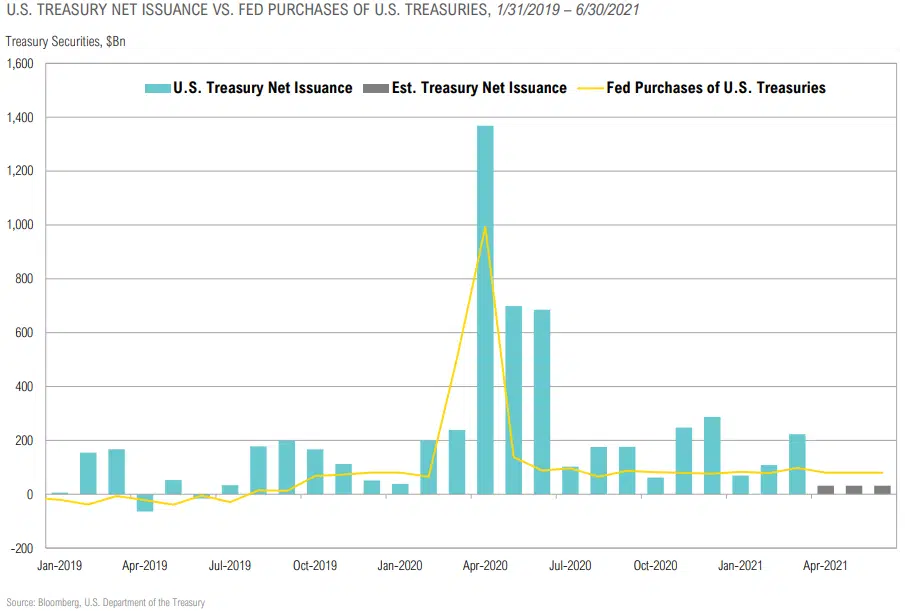
Fed Balance Sheet Expansion: 3-Month Average of +$85 Billion to Over $8 Trillion

Equity Returns
S&P 500 vs. Top 5 Constituents
Global Earnings Calendar
Sales & Earnings Growth to Decelerate Against Tougher Comps in 2H
S&P 500 & Implied Volatility
Volatility is a Feature of the Stock Market, Not a Bug
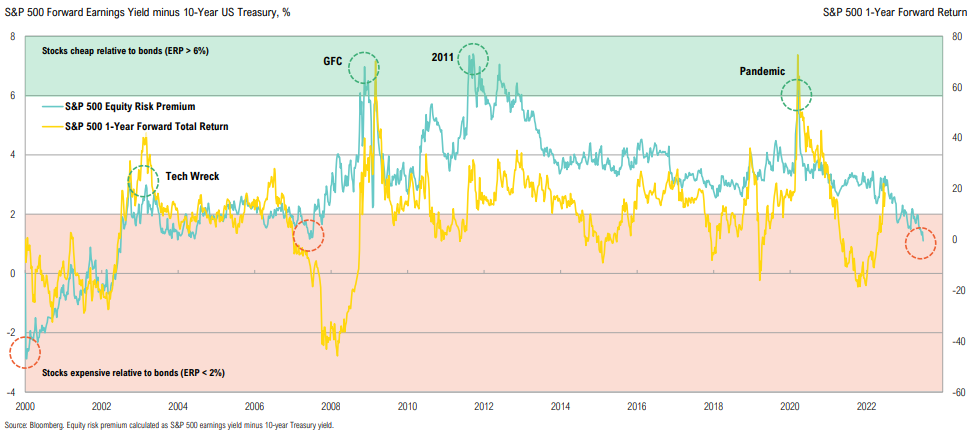
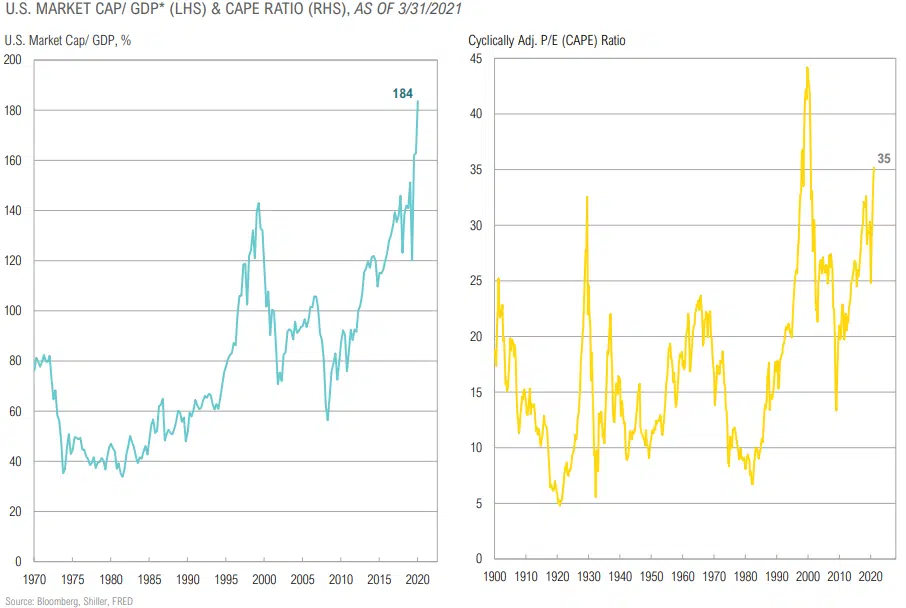
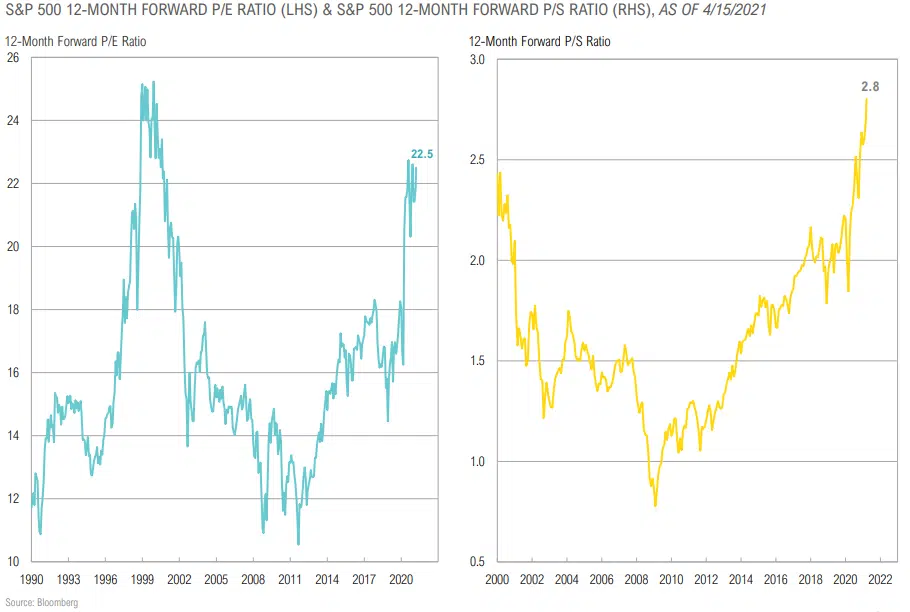
U.S. Equity Valuations Remain Very Stretched
Cyclically-Adjusted P/E (CAPE) Multiples by Country
Sentiment Fell in June but Remains Elevated
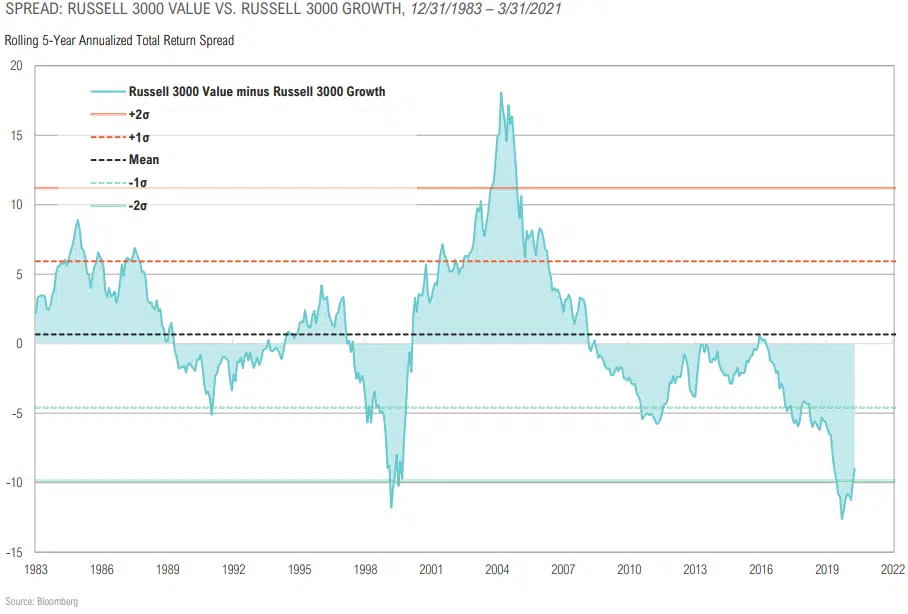
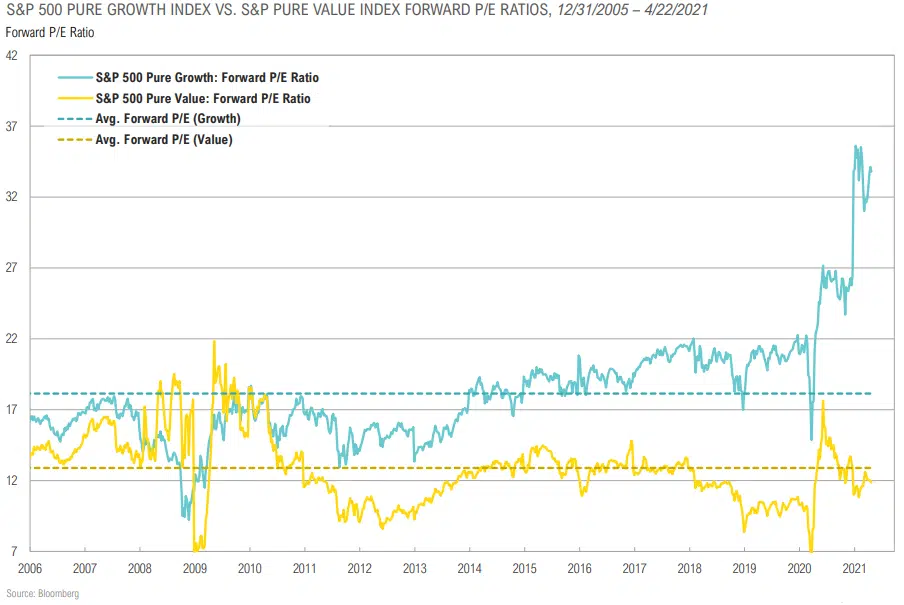
Value Has Outperformed Growth Since the Vaccine Announcement; Growth’s Recent Outperformance May be A Sign of the Trend Reversing

Growth Valuations Have Come Down, Still Significantly More Expensive than Value
EM Equities Remain Relatively Cheap vs. Developed Markets
The Weight of Growth Sectors in the S&P 500 Ticked Higher in June
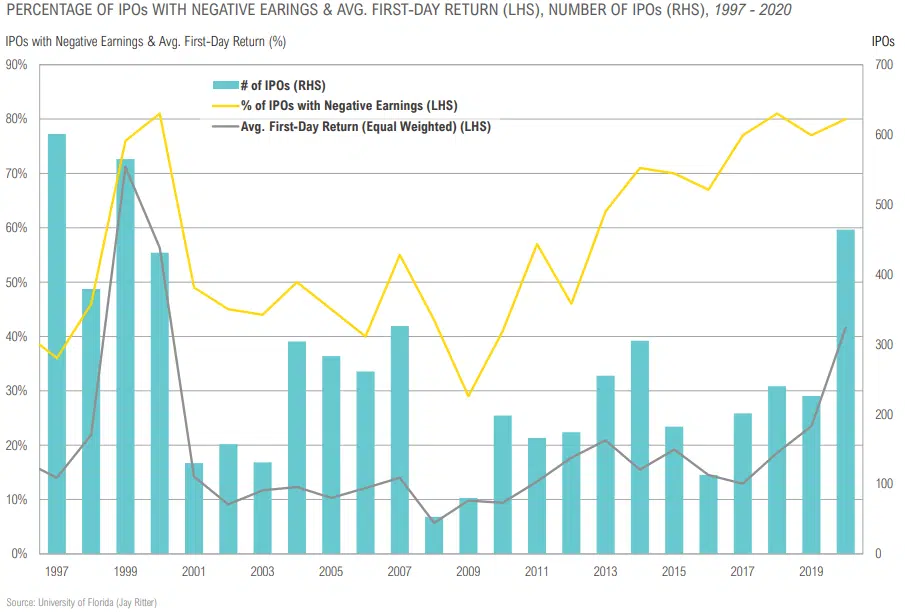
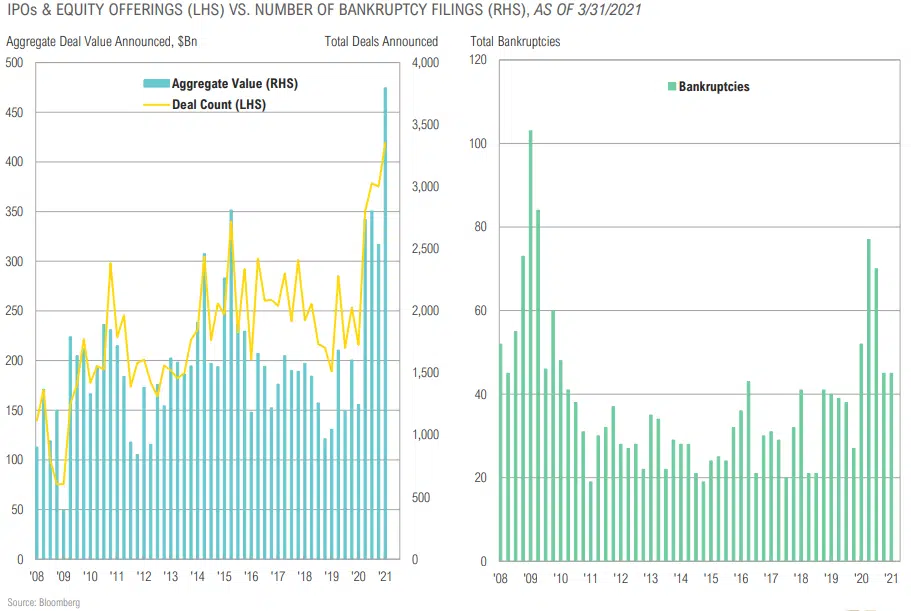
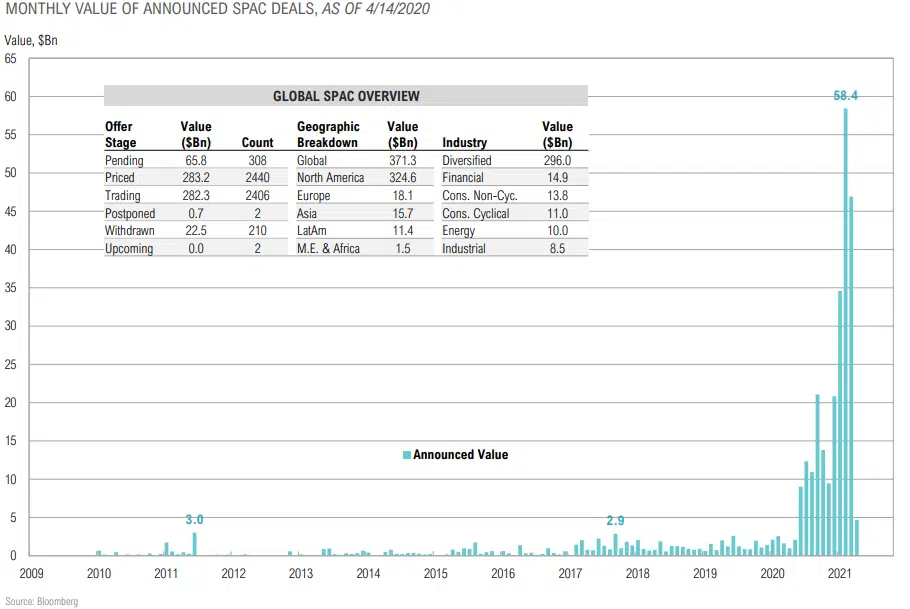
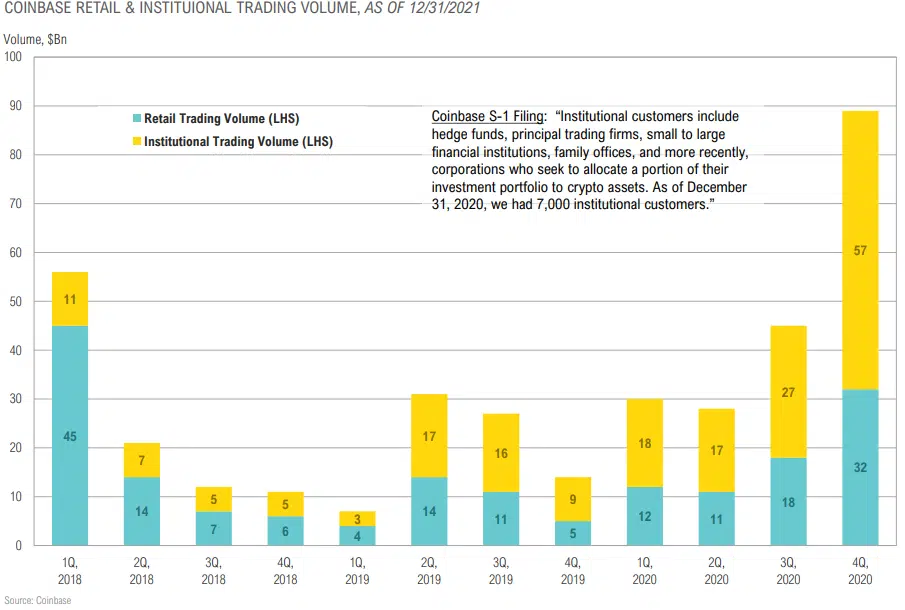
IPO Index Down 13% from High, S&P 500 Near ATH
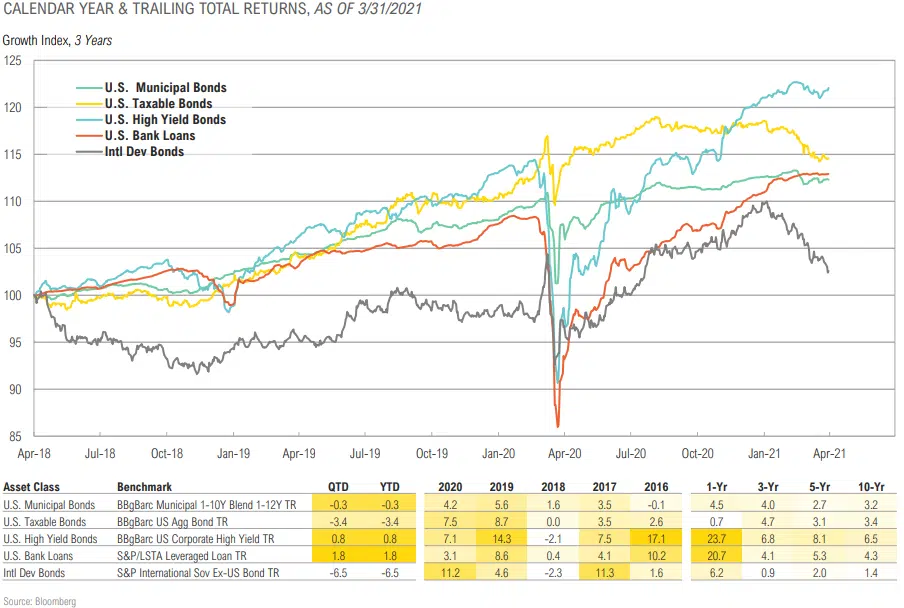
Fixed Income & Credit Returns
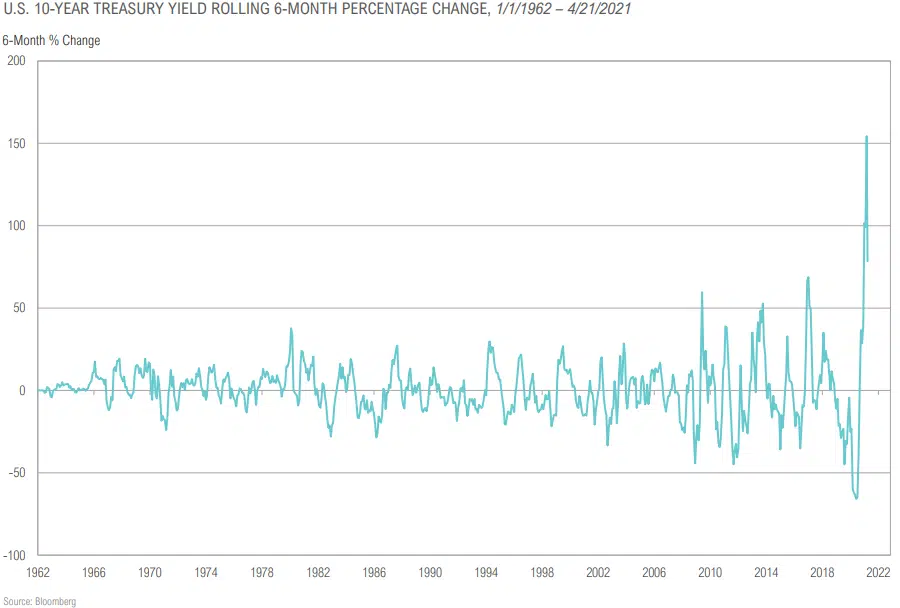
Intermediate & LT Treasury Yields Trending Lower from March High
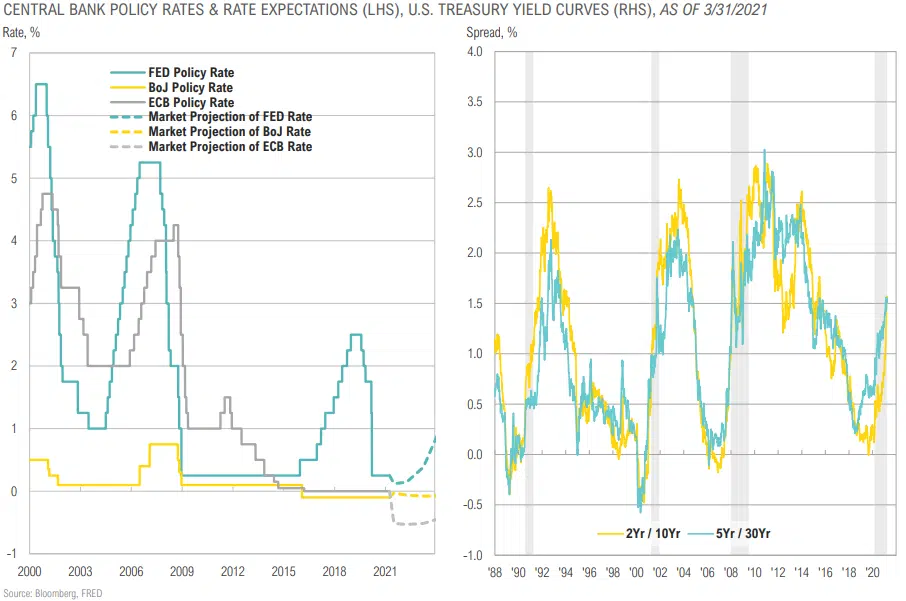
Treasury Yield Curve Continues to Steepen
Treasury Spreads Have Tightened Possibly Suggesting LT Inflation Concerns Have Subsided
Muni-Treasury Ratio: Short-Term Muni Yields Look Attractive Relative to Treasuries
Mortgage Rate Spread vs. 10-Yr Treasury Widened in June
Credit Spreads Below Median Across Sectors
Credit Spreads Have Continued Tightening
High Yield to IG Muni Spreads Continue to Tighten
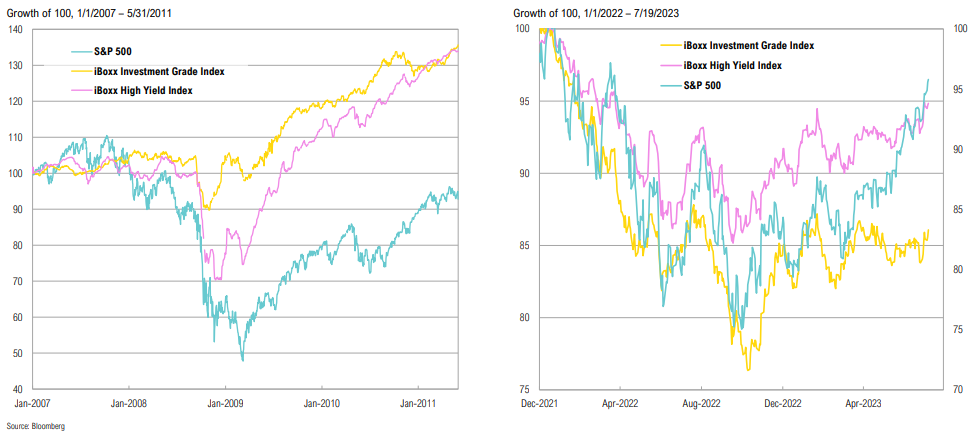
High Yield Spreads Through the COVID-19 Crisis
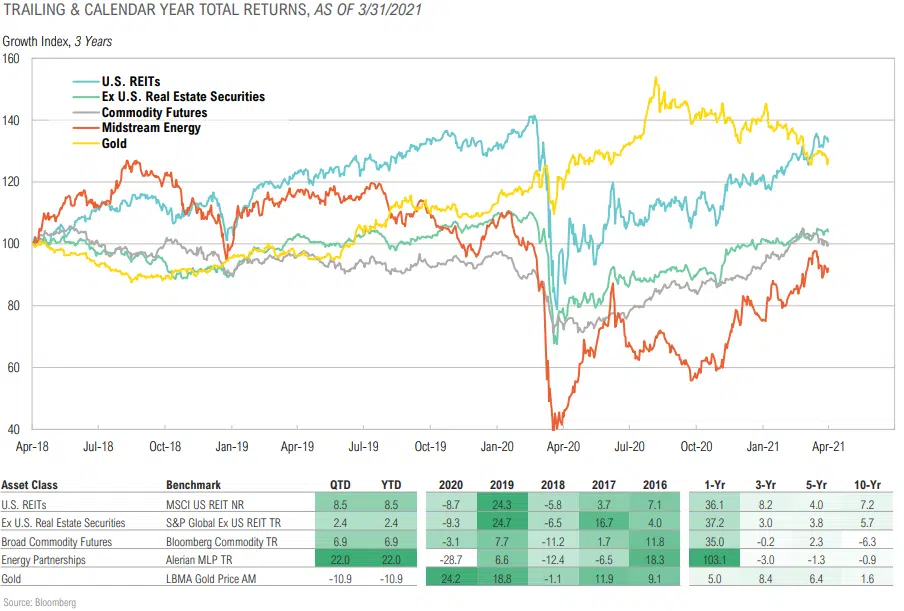
Real Assets Returns
Crude Inventories Trending Lower, Gas Inventories Near 5- Year Average
The Snapback in Energy Consumption is Outpacing Production
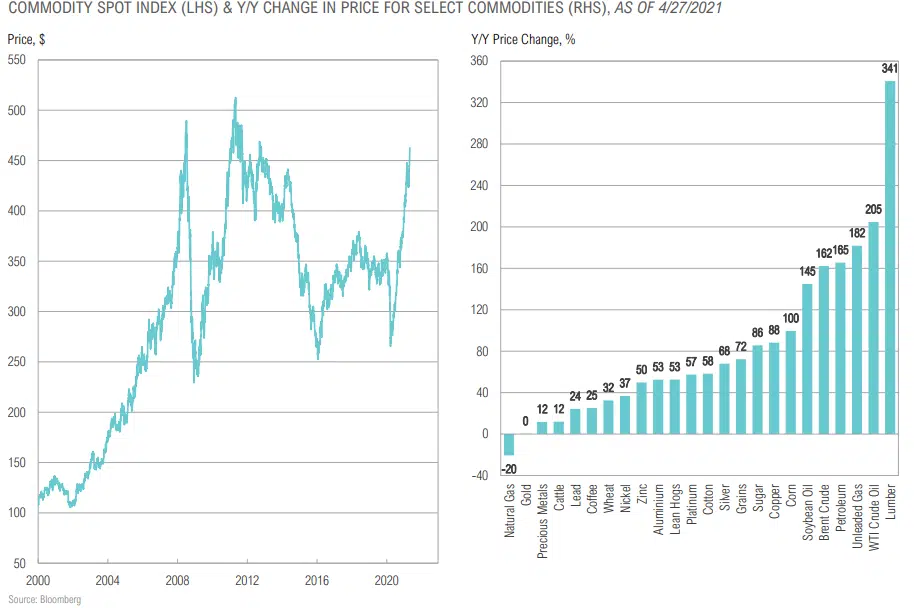
Putting the Rally in Broad Commodities in Context
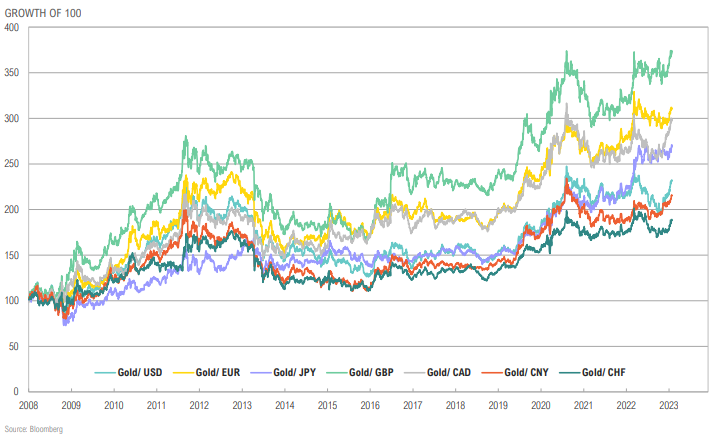
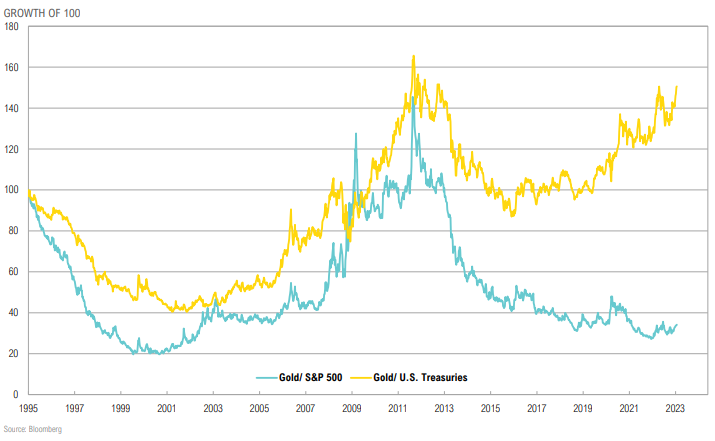
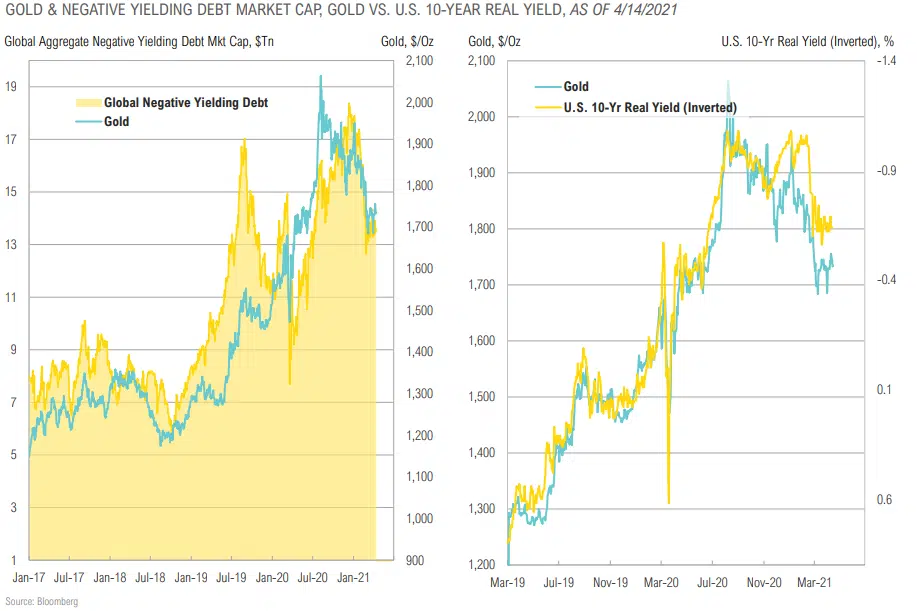
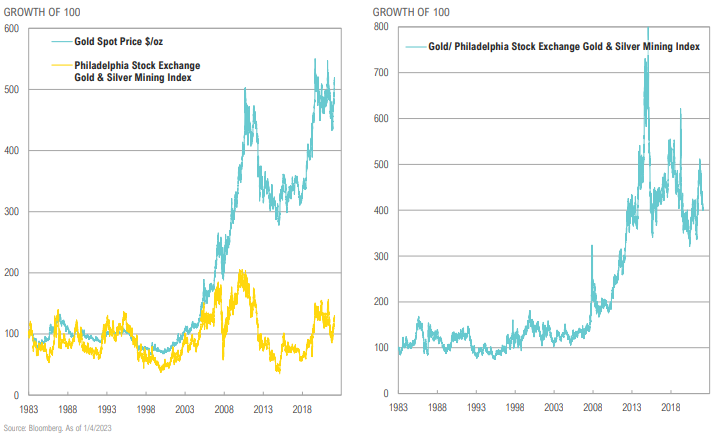
Real Yields and Gold Diverged As Real Yields Dropped in Late June
Opportunistic Returns
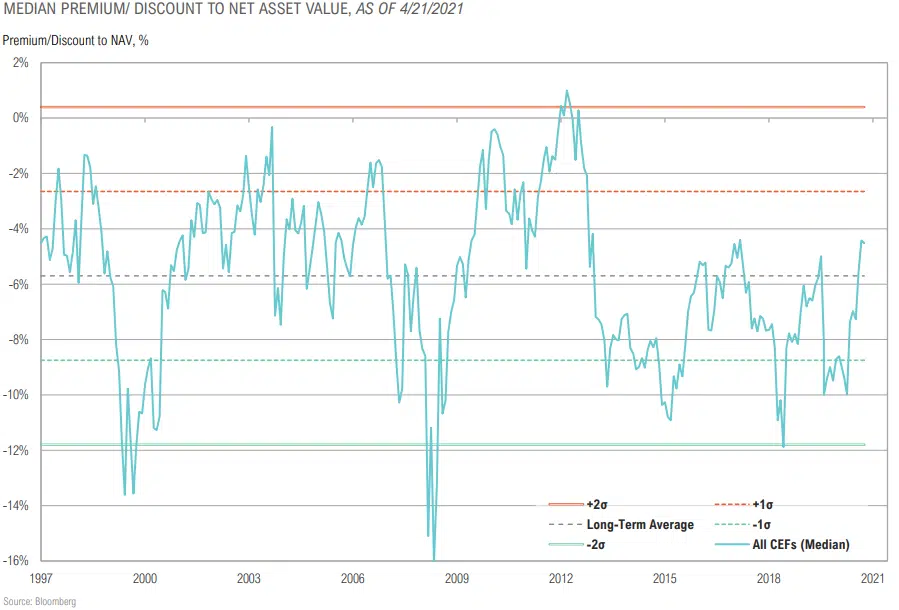
CEF Discounts Have Continued to Narrow, Now >1σ Above Average
CEF Discounts Closing, Taxable Bond CEFs Now Trading at Premium
U.S. Dollar Index
Growing Twin Deficit Remains a Major Headwind for USD
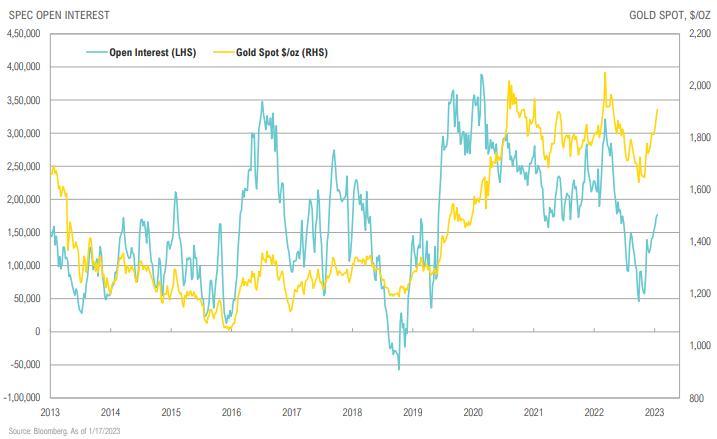
Futures Spec Positioning
Copper/Gold Ratio Corroborated the Local High in Treasury Yields
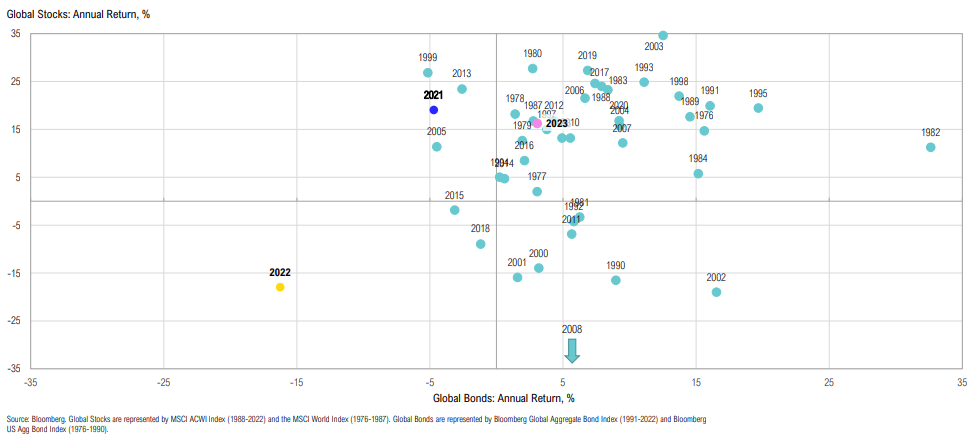
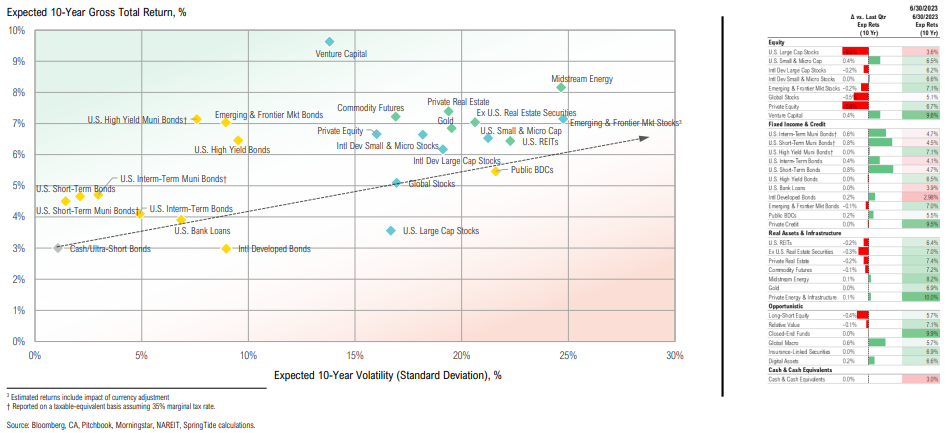
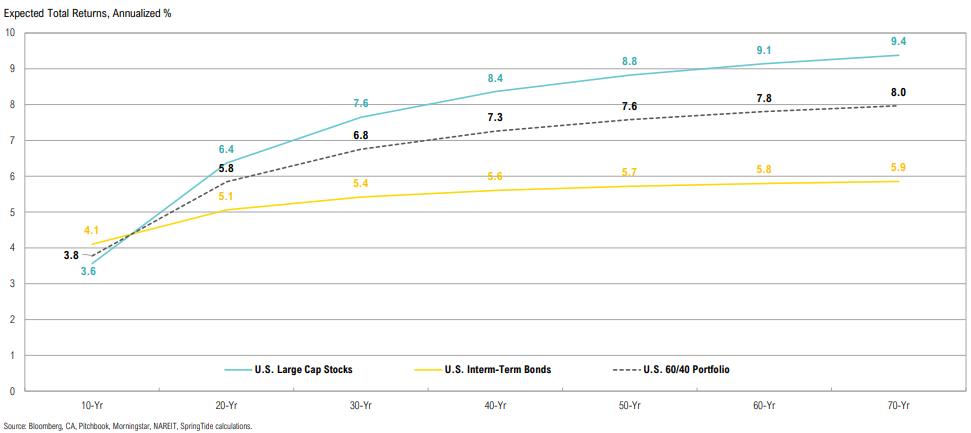
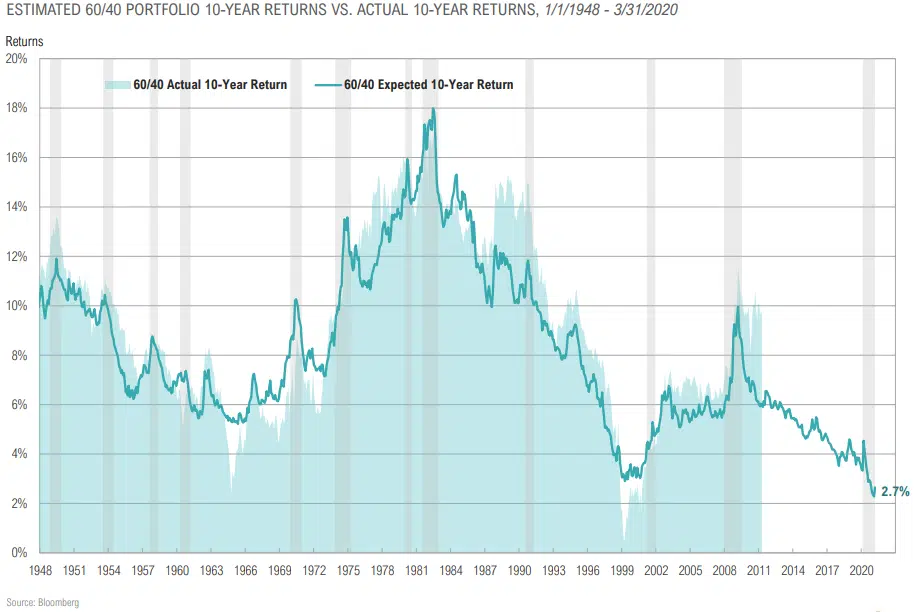
Expected Returns for Passive “60/40” Portfolio at All-Time Low
The Case for a Structural Change to Strategic 60/40 Allocations
Index Definitions
S&P 500 Index: Widely regarded as the best single gauge of the U.S. equities market. The index includes a representative sample of 500 leading companies in leading industries of the U.S. economy. The S&P 500 Index focuses on the large-cap segment of the market; however, since it includes a significant portion of the total value of the market, it also represents the market.
MSCI ACWI: (ACWI: All Country World Index) a free float-adjusted market capitalization weighted index that is designed to measure the equity market performance of developed and emerging markets.
MSCI EAFE Index: (EAFE: Europe, Australasia, Far East) a free float-adjusted market capitalization index that is designed to measure the equity market performance of developed markets, excluding the US & Canada.
MSCI EAFE Small Cap Index: (EAFE: Europe, Australasia, Far East) a free float-adjusted market capitalization index that is designed to measure the small cap equity market performance of developed markets, excluding the US & Canada.
MSCI EM Index: A free float-adjusted market capitalization index that is designed to measure equity market performance in the global emerging markets
Russell 1000 Index: Measures the performance of the 1,000 largest companies in the Russell 3000.
Russell 2000 Index: Measures the performance of the 2,000 smallest companies in the Russell 3000 Index.
Russell 3000 Index: Measures the performance of the 3,000 largest U.S. companies based on total market capitalization.
Cambridge Associates U.S. Global Buyout and Growth: Based on data compiled from 1,768 global (U.S. & ex – U.S.) buyout and growth equity funds, including fully liquidated partnerships, formed between 1986 and 2013.
Index: Based on data compiled from 1,768 global (U.S. & ex –U.S.) buyout and growth equity funds, including fully liquidated partnerships, formed between 1986 and 2013
Cambridge Associates Private Equity Index: Based on data compiled from 1,468 U.S. private equity funds (buyout, growth equity, private equity energy and subordinated capital funds), including fully liquidated partnerships, formed between 1986 and 2017.
Cambridge Associates Venture Capital Index: Based on data compiled from 1,807 US venture capital funds (1,161 early stage, 210 late & expansion stage, and 436 multi-stage funds), including fully liquidated partnerships, formed between 1981 and 2018
Bloomberg Barclays U.S. Aggregate Bond Index: A broad-based flagship benchmark that measures the investment grade, US dollar-denominated, fixed-rate taxable bond market. The index includes Treasuries, government-related and corporate securities, MBS (agency fixed-rate pass-throughs), ABS and CMBS (agency and non-agency).
Bloomberg Barclays Global Aggregate Index: A multi-currency measure of global investment grade debt from twenty-four local currency markets. This benchmark includes treasury, government-related, corporate and securitized fixed-rate bonds from both developed and emerging markets issuers.
Bloomberg Barclays Global Aggregate ex-USD Index: A multi-currency measure of investment grade debt from 24 local currency markets. This benchmark includes treasury, government-related, corporate and securitized fixed-rate bonds from both developed and emerging markets issuers. Bonds issued in USD are excluded.
Bloomberg Barclays Municipal Index: Consists of a broad selection of investment-grade general obligation and revenue bonds of maturities ranging from one year to 30 years. It is an unmanaged index representative of the tax-exempt bond market.
Bloomberg Barclays US High Yield Index: Covers the universe of fixed rate, non-investment grade debt. Eurobonds and debt issues from countries designated as emerging markets (sovereign rating of Baa1/BBB+/BBB+ and below using the middle of Moody’s, S&P, and Fitch) are excluded, but Canadian and global bonds (SEC registered) of issuers in non-EMG countries are included. funds), including fully liquidated partnerships, formed between 1986 and 2017.
S&P Global Infrastructure Index: Designed to track 75 companies from around the world chosen to represent the listed infrastructure industry while maintaining liquidity and tradability. To create diversified exposure, the index includes three distinct infrastructure clusters: energy, transportation, and utilities.
LBMA Gold Price Index: The global benchmark prices for unallocated gold and silver delivered in London. ICE Benchmark Administration Limited (IBA) operates electronic auctions for spot, unallocated London gold and silver, providing a market-based platform for buyers and sellers to trade. The auctions are run at 10:30am and 3:00pm London time for gold and at 12:00pm London time for silver. The final auction prices are published to the market as the LBMA Gold Price AM, the LBMA Gold Price PM and the LBMA Silver Price benchmarks, respectively. The price formation for each auction is in US Dollars.
HFRI Indices: Equally weighted performance indexes, utilized by numerous hedge fund managers as a benchmark for their own hedge funds. The HFRI are broken down into 4 main strategies, each with multiple sub strategies. All single-manager HFRI Index constituents are included in the HFRI Fund Weighted Composite, which accounts for over 2200 funds listed on the internal HFR Database.
HFRI Equity Hedge Index: Investment Managers who maintain positions both long and short in primarily equity and equity derivative securities. EH managers would typically maintain at least 50% exposure to, and may in some cases be entirely invested in, equities, both long and short.
HFRI Event Driven Index: Investment Managers who maintain positions in companies currently or prospectively involved in corporate transactions of a wide variety including but not limited to mergers, restructurings, financial distress, tender offers, shareholder buybacks, debt exchanges, security issuance or other capital structure adjustments.
HFRI Relative Value Index: Investment Managers who maintain positions in which the investment thesis is predicated on realization of a valuation discrepancy in the relationship between multiple securities.
HFRI Credit Index: A composite index of strategies trading primarily in credit markets. It is an aggregation of following 7 HFRI sub-strategy indices. HFRI ED: Credit Arbitrage Index, HFRI ED: Distressed/Restructuring Index, HFRI ED: Multi-Strategy Index, HFRI RV: Fixed Income-Asset Backed Index, HFRI RV: Fixed Income-Convertible Arbitrage Index, HFRI RV: Fixed Income-Corporate Index, and HFRI RV: Multi-Strategy Index.
HFRX Indices: Equally weighted index across all substrategy and regional indices. Hedge Fund Research, Inc. (HFR) utilizes a UCITSIII compliant methodology to construct the HFRX Hedge Fund Indices. The methodology is based on defined and predetermined rules and objective criteria to select and rebalance components to maximize representation of the Hedge Fund Universe.
HFRX Short Bias Index: Short-Biased strategies employ analytical techniques in which the investment thesis is predicated on assessment of the valuation characteristics on the underlying companies with the goal of identifying over-valued companies. Short Biased strategies may vary the investment level or the level of short exposure over market cycles, but the primary distinguishing characteristic is that the manager maintains consistent short exposure and expects to outperform traditional equity managers in declining equity markets.
HFRX Macro/CTA Index: Macro strategy managers trade a broad range of strategies in which the investment process is predicated on movements in underlying economic variables and the impact these have on equity, fixed income, hard currency and commodity markets. Managers employ a variety of techniques, both discretionary and systematic analysis, combinations of top down and bottom up theses, quantitative and fundamental approaches and long and short-term holding periods.
HFRX Equity Hedge Index: Equity Hedge strategies maintain positions both long and short in primarily equity and equity derivative securities. A wide variety of strategies can range broadly in terms of levels of net exposure, leverage employed, holding period, concentrations of market capitalizations and valuation ranges of typical portfolios. Equity Hedge managers would typically maintain a least 50% and may in some cases be substantially entirely invested in equities, both long and short.
ASSET CLASS DEFINITIONS
Asset class performance was measured using the following benchmarks unless stated otherwise:
U.S. Large Cap Stocks: S&P 500 TR Index
U.S. Small & Micro Cap Stocks: Russell 2000 TR Index
Intl Dev Large Cap Stocks: MSCI EAFE GR Index
Emerging & Frontier Market Stocks: MSCI Emerging Markets GR Index
U.S. Interm-Term Muni Bonds: Bloomberg Barclays 1-10 (1-12 Yr) Muni Bond TR Index
U.S. Interm-Term Bonds: Bloomberg Barclays U.S. Aggregate Bond TR Index
U.S. High Yield Bonds: Bloomberg Barclays U.S. Corporate High Yield TR Index
U.S. Bank Loans: S&P/LSTA U.S. Leveraged Loan Index
Intl Developed Bonds: Bloomberg Barclays Global Aggregate ex-U.S. Index
Emerging & Frontier Market Bonds: JPMorgan EMBI Global Diversified TR Index
U.S. REITs: MSCI U.S. REIT GR Index
Ex U.S. Real Estate Securities: S&P Global Ex-U.S. Property TR Index
Commodity Futures: Bloomberg Commodity TR Index
Midstream Energy: Alerian MLP TR Index
Gold: LBMA Gold Price
U.S. 60/40: 60% S&P 500 TR Index 40% Bloomberg Barclays U.S. Aggregate Bond TR Index
Global 60/40: 60% MSCI ACWI GR Index 40% Bloomberg Barclays Global Aggregate Bond TR Index
Data Definitions
Alpha: The excess return generated by an active manager or fund relative to its benchmark.
Bear Market: A bear market is a condition in which securities prices fall and widespread pessimism causes the stock market’s downward spiral to be self sustaining. Although figures vary, a downturn of 20 percent or more from a peak in multiple broad market indexes, such as the Dow Jones Industrial Average (DJIA) or Standard & Poor’s 500 Index (S&P 500), over a two-month period is considered an entry into a bear market.
Bull Market: A bull market is the condition of a financial market of a group of securities in which prices are rising or are expected to rise. The term “bull market” is most often used to refer to the stock market but can be applied to anything that is traded, such as bonds, real estate, currencies and commodities. Because prices of securities rise and fall essentially continuously during trading, the term “bull market” is typically reserved for extended periods in which a large portion of security prices are
rising.
Credit Spread: A credit spread is the difference in yield between a US Treasury bond and a debt security with the same maturity but of lesser quality.
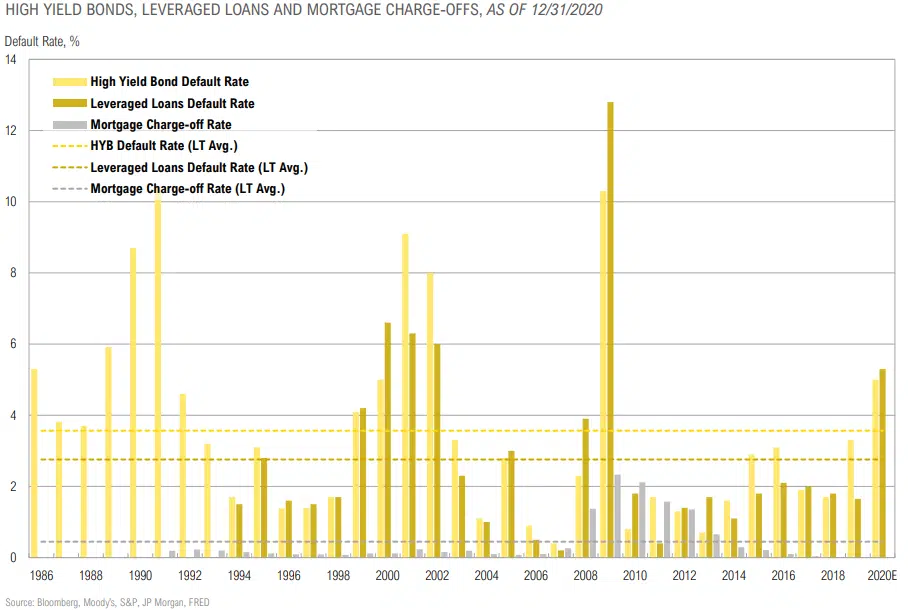
Default Rate: The default rate is most commonly referred to as the percentage of loans that have been charged off after a prolonged period of missed payments.
Excess Returns: A security’s return minus the return from another security in the same time period.
Full Employment: The condition in which virtually all who are able and willing to work are employed.
Implied Volatility: The estimated volatility of a security’s price. In general, implied volatility increases when the market is bearish and decreases when the market is bullish. This is due to the common belief that bearish markets are more risky than bullish markets.
Large Cap: Sometimes “big cap”, refers to a company with a market capitalization value of more than $10 billion. Large cap is a shortened version of the term “large market capitalization.” Market capitalization is calculated by multiplying the number of a company’s shares outstanding by its stock price per share.
Long/Short Equity: Long-short portfolios hold sizeable stakes in both long and short positions in equities and related derivatives. Some funds that fall into this category will shift their exposure to long and short positions depending on their macro outlook or the opportunities they uncover through bottom-up research. Some funds may simply hedge long stock positions through exchange traded funds or derivatives. At least 75% of the assetsare in equity securities or derivatives.
Price-to-Earnings (P/E) Ratio: The price-earnings ratio (P/E Ratio) is the ratio for valuing a company that measures its current share price relative to its per-share earnings. The price-earnings ratio can be calculated as: Market Value per Share/Earnings per Share.
Price-to-Book (P/B) Ratio: The price-to-book ratio (P/B Ratio) is a ratio used to compare a stock’s market value to its book value. It is calculated by dividing the current closing price of the stock by the latest quarter’s book value per share. Also known as the “price-equity ratio.
Sharpe Ratio: The ratio is the average return earned in excess of the risk-free rate per unit of volatility or total risk. It also known as the Reward-to-volatility Ratio.
Shiller P/E: Valuation measure that takes into consideration the price and cyclically adjusted earnings of a security, adjusted for inflation.
Small Cap: Small cap stocks are generally defined as the stock of publicly traded companies that have a market capitalization ranging from $300 million to about $2 billion. Small cap stock companies often have a high stock price. It’s the number of available shares that make them “small.”
Spread Changes: Changes in the spread between Treasury securities and non Treasury securities that are identical in all respects except for quality rating.
Standard Deviation: Measures the historical dispersion of a security, fund or index around an average. Investors use standard deviation to measure expected risk or volatility, and a higher standard deviation means the security has tended to show higher volatility or price swings in the past.
Yield: The income produced by an investment, typically calculated as the interest received annually divided by the investment’s price.
Yield-to-Duration: A ratio used in fixed income investing to compare the amount of return (yield to maturity) an investor is receiving per unit of duration or interest rate risk.
Z-score: A Z-score is a numerical measurement of a value’s relationship to the mean in a group of values. A Z-score of 0 represents the score as identical to the mean score. Positive and negative scores reflect the number of standard deviations that the score is either above or below the mean, respectively.