The S&P 500 Index had its best month of the year in October, rising 7% and bouncing back significantly from September’s 4.7% loss, its worst month since March 2020. The large cap index ended October at an all-time high, adding to an impressive run of 59 new daily closing highs in 2021, the third-highest annual total since the Great Depression.1 While valuations are unquestionably high,2 the recent rally has been supported by higherthan-expected earnings and profitability. As of the end of the month, the blended thirdquarter earnings growth rate for the S&P 500 is 39.1% on a year-over-year basis, the third-highest growth rate since 20103. Further, operating margins are 13.3%, substantially higher than the 8.1% average since 1993.1 Equity markets also responded favorably to a dovish interpretation of the Federal Reserve’s mid-October interest rate decision, as well as decreasing COVID-19 cases and hospitalizations in the United States.4
Despite the good news, investors remain fixated on the government’s unprecedented monetary policy support. The S&P 500 was up just 1% month-to-date through October 12. On October 13, the Fed announced that it would continue with the status quo of purchasing $120 billion Treasury and mortgage-backed securities per month. However, it hinted that at the November meeting, if the decision were made to begin slowing purchases, the tapering cycle could be completed around mid-2022.5 (As suggested, the Fed did indeed decide in early November to start tapering asset purchases in late November.)6
International developed market and emerging market stocks lagged behind U.S. equities despite posting absolute returns of 2.5% and 1.0%, respectively. As a result, emerging market stocks have bounced back to flat for 2021.

Market Commentary
Market Commentary – October, 2021
Heating Up
Equity markets responded favorably to a dovish interpretation of the Federal Reserve’s mid-October interest rate decision and decreasing COVID-19 cases in the United States, but remain fixated on the government's unprecedented monetary policy support.
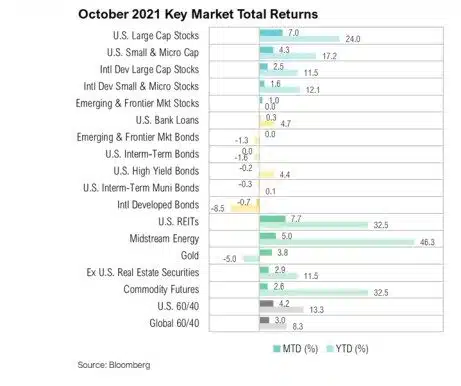
Markets
The S&P 500 Index had its best month of the year in October, rising 7% and bouncing back significantly from September’s 4.7% loss, its worst month since March 2020. The large cap index ended October at an all-time high, adding to an impressive run of 59 new daily closing highs in 2021, the third-highest annual total since the Great Depression.1 While valuations are unquestionably high,2 the recent rally has been supported by higherthan-expected earnings and profitability. As of the end of the month, the blended thirdquarter earnings growth rate for the S&P 500 is 39.1% on a year-over-year basis, the third-highest growth rate since 20103. Further, operating margins are 13.3%, substantially higher than the 8.1% average since 1993.1 Equity markets also responded favorably to a dovish interpretation of the Federal Reserve’s mid-October interest rate decision, as well as decreasing COVID-19 cases and hospitalizations in the United States.4
Despite the good news, investors remain fixated on the government’s unprecedented monetary policy support. The S&P 500 was up just 1% month-to-date through October 12. On October 13, the Fed announced that it would continue with the status quo of purchasing $120 billion Treasury and mortgage-backed securities per month. However, it hinted that at the November meeting, if the decision were made to begin slowing purchases, the tapering cycle could be completed around mid-2022.5 (As suggested, the Fed did indeed decide in early November to start tapering asset purchases in late November.)6
International developed market and emerging market stocks lagged behind U.S. equities despite posting absolute returns of 2.5% and 1.0%, respectively. As a result, emerging market stocks have bounced back to flat for 2021.
Multi-decade high inflation pushed interest rates higher throughout the month, resulting in poor performance for longer duration bonds and strong returns for real assets.
Within fixed income markets, longer duration bonds underperformed as interest rates rosedue to inflation concerns. Five-year market-implied inflation, as proxied by the yield spread between Treasuries and Treasury Inflation-Protected Securities (TIPS), finished October at a multi-decade high of 2.9%. Real assets, often viewed as a hedge against the declining purchasing power inflation causes, posted impressive gains. U.S. REITs led the way, up 7.7% for the month. The price of crude oil jumped higher by over 20%, reaching $85/barrel for the first time since 2014. The demand for energy continues to climb; total world petroleum consumption was estimated to be 98.9 million barrels per day in the third quarter, a post-pandemic high.7
U.S. President Joe Biden’s net approval rating has declined since his inauguration. Some attribute the slide to the delta variant COVID-19 surge and delays surrounding key agenda items such as the "Build Back Better" legislation featuring the $1 trillion infrastructure bill and multitrillion social spending package.
Biden's Approval Slide
As with his two predecessors, U.S. President Joe Biden’s net approval rating has declined since his inauguration, dropping steadily from +17% at the start of his presidency to -8.2% by the end of October.8 This represents the second-worst net approval rating by any president 285 days into their first term since World War II.8 Some blame the delta variant COVID-19 surge, while others point to delays surrounding key agenda items, like the bipartisan infrastructure bill and a multi-trillion-dollar social spending package focused on health care, education, and climate change policies.9
Biden and his cabinet have their work cut out for them if they hope to turn public perception around. One big ticket item, the aforementioned $1 trillion bipartisan infrastructure bill, was nearing a conclusion at the end of October (and finally passed and signed into law in early November).10
As the clock wound down on the U.S. defaulting on its debt, the House voted to increase the debt ceiling by $480 billion, an amount expected to allow the U.S. to pay its bills through December 3.
As Congress debates how to pay for this legislation, the United States government once again finds itself up against its debt limit.11 The prior extension of the limit to $28.4 trillion, agreed upon in 2019, was reached at the end of July, which means the Treasury can no longer issue additional debt to fund obligations until a new limit is set.11 Since then, the Treasury used its cash surplus to fund its day-to-day operations, but this was scheduled to run out by the end of October.11 As the clock wound down, the House voted to increase the debt ceiling by $480 billion, an amount expected to allow the U.S. to pay its bills through December 3.12 Since then, the debt debate has mostly taken a backseat to the “Build Back Better” legislation. At the end of the month, Janet Yellen brought the debate to the forefront once again by saying Democratic Congressional leaders could push through the debt ceiling bill on their own via the reconciliation process:
Bond markets in particular will remain attentive to how Congress will deal with the federal debt ceiling and how this issue will affect Treasury issuance (supply) for the coming quarters. From an economic and market perspective, interest rates must remain contained.
Heading into the winter months in the northern hemisphere, natural gas prices are particularly concerning outside the U.S. as spot prices have more than quadrupled and hit record levels in Europe and Asia.
Energy Price Strike
Energy prices shot higher in October. Crude oil, natural gas, and coal prices increased 13%, 30% and 6%, respectively. Year-to-date increases have been even more surprising—crude oil is up 54%, natural gas up 125%, and coal up 178%. Heading into the winter months in the northern hemisphere, natural gas prices are particularly concerning outside the U.S., as spot prices have more than quadrupled and hit record levels in Europe and Asia.14 The price of natural gas typically reflects seasonal and localized factors, but we could be experiencing the beginning of an unprecedented global price shock.14
Despite higher prices, demand for natural gas remains strong. This year, 36% of electricity generation is expected to come from natural gas—only a small dip from last year’s 39%.15 Coal will likely benefit the most from this 3% decline. It is projected to generate 18% more electricity this year than in 2020, hitting its highest level since 2001.15 Its price is also soaring. However, constraints on coal supply and low coal reserves are limiting consumption, compared to previous periods of natural gas price increases.15 Oil also seems unlikely to provide an alternative heating and power source due to high prices and the October announcement from OPEC+ that its production targets will remain unchanged.16 The International Monetary Fund (IMF), which promotes global economic growth and financial stability, has warned that global growth may soon be impacted if energy prices remain elevated.14
Due to labor shortages, maintenance backlogs, longer lead times for new projects, and investors’ lackluster interest in fossil fuels, companies were slow to increase supply when demand suddenly jumped, and as a result, energy prices shot upward.
This macro environment stands in stark contrast to conditions 18 months ago when May 2020 WTI oil futures contracts plummeted to -$37.63/barrel due to a massive supply glut following global lockdowns.17 As a result, energy producers cut production and slashed their investments. However, consumption rebounded faster than anticipated, led by the industrial sector. Yet due to labor shortages, maintenance backlogs, longer lead times for new projects, and investors’ lackluster interest in fossil fuels, companies were slow to increase supply when demand suddenly jumped, and as a result, energy prices shot upward. At the end of October, natural gas production in the U.S. still remains below precrisis levels.14
With winter rapidly approaching and markets struggling to correct themselves, a bipartisan group of senators from New England sent a letter on October 28 to the White House urging “targeted actions” to provide relief “given the current state of energy markets.”18 The letter goes on to suggest “releasing inventory from the Strategic Petroleum Reserve and the Northeast Home Heating Oil Reserve and limiting natural gas exports to lessen the effect of potential residential energy price increases.” 18 It’s worth noting that both the IMF and the U.S. Energy Information Administration expect prices tonormalize by sometime next year, but both agencies predict volatile conditions in the near term.14,15
Looking Forward
Across the globe, communities continue to recover from the effects of the COVID-19 pandemic and lockdowns, but challenges persist. Although record levels of stimulus were initially welcome and likely necessary, continued stimulus – exacerbated by a multitude of supply issues – is leading to overheating in some sectors, most notably in
energy.
As we explained in our September commentary, we expect market participants—and bond vigilantes—to start paying more attention to price shifts in the energy complex. At the end of October, a barrel of WTI crude oil traded for a little over $83, a price not exceeded since 2014. Similarly, the national average gas price is now well over $3 per gallon, a seven-year high.19 Finally, natural gas prices are at 13-year highs. If bond vigilantes stay quiet, unsustainable policy accommodation can likely continue. If they do not, investors should expect elevated volatility—at least relative to what has been an extraordinarily good year for asset prices. Another scenario is that the economic pain of higher energy prices could become so acute that a new breed of vigilantes may emerge—the energy vigilantes—who could force policymakers’ hands.
Performance Disclosures
All market pricing and performance data from Bloomberg, unless otherwise cited. Asset class and sector performance are gross of fees unless otherwise indicated.
Citations
Share it :
Disclaimer
Magnus Financial Group LLC (“Magnus”) did not produce and bears no responsibility for any part of this report whatsoever, including but not limited to any microeconomic views, inaccuracies or any errors or omissions. Research and data used in the presentation have come from third-party sources that Magnus has not independently verified presentation and the opinions expressed are not by Magnus or its employees and are current only as of the time made and are subject to change without notice.
This report may include estimates, projections or other forward-looking statements, however, due to numerous factors, actual events may differ substantially from those presented. The graphs and tables making up this report have been based on unaudited, third-party data and performance information provided to us by one or more commercial databases. Except for the historical information contained in this report, certain matters are forward looking statements or projections that are dependent upon risks and uncertainties, including but not limited to factors and considerations such as general market volatility, global economic risk, geopolitical risk, currency risk and other country-specific factors, fiscal and monetary policy, the level of interest rates, security-specific risks, and historical market segment or sector performance relationships as they relate to the business and economic cycle.
Additionally, please be aware that past performance is not a guide to the future performance of any manager or strategy, and that the performance results and historical information provided displayed herein may have been adversely or favorably impacted by events and economic conditions that will not prevail in the future. Therefore, it should not be inferred that these results are indicative of the future performance of any strategy, index, fund, manager or group of managers. Index benchmarks contained in this report are provided so that performance can be compared with the performance of well-known and widely recognized indices. Index results assume the re-investment of all dividends and interest and do not reflect any management fees, transaction costs or expenses.
The information provided is not intended to be, and should not be construed as, investment, legal or tax advice nor should such information contained herein be construed as a recommendation or advice to purchase or sell any security, investment, or portfolio allocation. An investor should consult with their financial advisor to determine the appropriate investment strategies and investment vehicles. Investment decisions should be made based on the investor’s specific financial needs and objectives, goals, time horizon and risk tolerance. This presentation makes no implied or express recommendations concerning the way any client’s accounts should or would be handled, as appropriate investment decisions depend upon the client’s specific investment objectives.
Investment advisory services offered through Magnus; securities offered through third party custodial relationships. More information about Magnus can be found on its Form ADV at www.adviserinfo.sec.gov.
Terms of Use
Definitions
Asset class performance was measured using the following benchmarks: U.S. Large Cap Stocks: S&P 500 TR Index; U.S. Small & Micro Cap: Russell 2000 TR Index; Intl Dev Large Cap Stocks: MSCI EAFE GR Index; Emerging & Frontier Market Stocks: MSCI Emerging Markets GR Index; U.S. Intermediate-Term Muni Bonds: Bloomberg Barclays 1-10 (1-12 Yr) Muni Bond TR Index; U.S. Intermediate-Term Bonds: Bloomberg Barclays U.S. Aggregate Bond TR Index; U.S. High Yield Bonds: Bloomberg Barclays U.S. Corporate High Yield TR Index; U.S. Bank Loans: S&P/LSTA U.S. Leveraged Loan Index; Intl Developed Bonds: Bloomberg Barclays Global Aggregate ex-U.S. Index; Emerging & Frontier Market Bonds: JPMorgan EMBI Global Diversified TR Index; U.S. REITs: MSCI U.S. REIT GR Index, Ex U.S. Real Estate Securities: S&P Global Ex-U.S. Property TR Index; Commodity Futures: Bloomberg Commodity TR Index; Midstream Energy: Alerian MLP TR Index; Gold: LBMA Gold Price, U.S. 60/40: 60% S&P 500 TR Index; 40% Bloomberg Barclays U.S. Aggregate Bond TR Index; Global 60/40: 60% MSCI ACWI GR Index; 40% Bloomberg Barclays Global Aggregate Bond TR Index.