Following its best month of the year in October, the S&P 500 Index cooled off in November, falling 0.7%. The shift in performance was concentrated at the end of the month. The index fell 2.6% from November 24 to November 30 as news of the Omicron COVID variant swept the globe1. Even though the World Health Organization (WHO) indicated it was too early to determine the impact of the new variant, markets were roiled nonetheless by reports of rapid spread and “heavily mutated characteristics”2. Insult was added to injury at the end of the month as Federal Reserve Chairman Jerome “Jay” Powell acknowledged inflation was becoming a more “persistent” risk and suggested an earlier-than-expected end to the extraordinarily loose monetary policy that investors have become accustomed to.3
Despite less-than-stellar absolute performance, U.S. large cap stocks held up better than international stocks. The MSCI EAFE index dropped 4.6% over the month. Europe’s COVID case count has risen dramatically over the past several weeks, hitting an all-time high in 7-day average new cases per capita—more than double the per capita amount in the United States.4 This most recent spike has resulted in increased restrictions across the continent, including partial or full lockdowns issued in the Netherlands and Austria.5
The increased likelihood of global government-imposed restrictions did not bode well for the energy sector. After starting the month at $83/barrel, WTI Crude closed the month at $66/barrel, a 20% decline.6 Natural gas and gasoline prices also tumbled, both falling 18% over the month.7,8 Midstream energy companies, which are usually more correlated to overall energy consumption than traditional energy producers, dropped 7.5%. Finally, despite a volatile month, gold finished up 0.1%.
On November 22, the White House announced President Biden’s intent to nominate Fed Chair Powell for a second term. The release praised Powell, citing his “steady leadership during an unprecedently challenging period.”9 Lael Brainard was appointed as Vice Chair and will report directly to Powell.9 As the only Democratic governor on the board today, she is viewed as the heir apparent to the next Democratic Fed nomination.10

Market Commentary
Market Commentary – November, 2021
Coming to Grips with Persistent Inflation
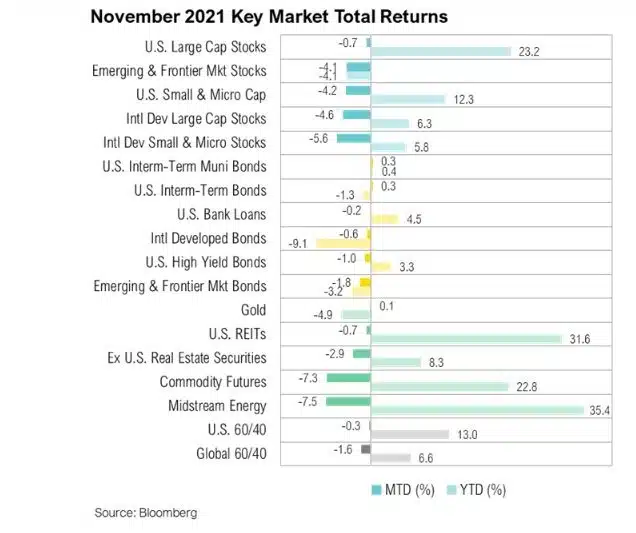
Equity markets sold off in response to the new Omicron COVID variant. Energy was particularly hit hard, with WTI crude, natural gas and gasoline prices all down around 20%.
Markets
Following its best month of the year in October, the S&P 500 Index cooled off in November, falling 0.7%. The shift in performance was concentrated at the end of the month. The index fell 2.6% from November 24 to November 30 as news of the Omicron COVID variant swept the globe1. Even though the World Health Organization (WHO) indicated it was too early to determine the impact of the new variant, markets were roiled nonetheless by reports of rapid spread and “heavily mutated characteristics”2. Insult was added to injury at the end of the month as Federal Reserve Chairman Jerome “Jay” Powell acknowledged inflation was becoming a more “persistent” risk and suggested an earlier-than-expected end to the extraordinarily loose monetary policy that investors have become accustomed to.3
Despite less-than-stellar absolute performance, U.S. large cap stocks held up better than international stocks. The MSCI EAFE index dropped 4.6% over the month. Europe’s COVID case count has risen dramatically over the past several weeks, hitting an all-time high in 7-day average new cases per capita—more than double the per capita amount in the United States.4 This most recent spike has resulted in increased restrictions across the continent, including partial or full lockdowns issued in the Netherlands and Austria.5
The increased likelihood of global government-imposed restrictions did not bode well for the energy sector. After starting the month at $83/barrel, WTI Crude closed the month at $66/barrel, a 20% decline.6 Natural gas and gasoline prices also tumbled, both falling 18% over the month.7,8 Midstream energy companies, which are usually more correlated to overall energy consumption than traditional energy producers, dropped 7.5%. Finally, despite a volatile month, gold finished up 0.1%.
On November 22, the White House announced President Biden’s intent to nominate Fed Chair Powell for a second term. The release praised Powell, citing his “steady leadership during an unprecedently challenging period.”9 Lael Brainard was appointed as Vice Chair and will report directly to Powell.9 As the only Democratic governor on the board today, she is viewed as the heir apparent to the next Democratic Fed nomination.10
Following nomination by President Biden for a second term, Powell hinted that he would consider winding down the taper of the Fed’s asset purchases sooner than previously communicated.
On November 30, a newly renewed Powell appeared before a Senate committee and hinted that he would consider “wrapping up the taper of our asset purchases…perhaps a few months sooner.”11 When asked if “transitory” was still an appropriate word to describe the nature of the current inflationary episode, he conceded “it’s probably a good time to retire that word.”11 Federal Funds futures contracts, a market-based proxy for the expected future path of interest rates, quickly priced in the first rate hike in June 2022, and a second hike is now expected to occur before the end of 2022.
Within fixed income markets, the U.S. treasury curve, a revered gauge of expected economic growth, flattened as long-term interest rates fell and short-term rates rose over the month. The 10-year treasury rate slid from 155 to 143 basis points, and the 2-year rate increased from 48 to 52 basis points, bringing the spread between them to just 91 basis points, the lowest since January 2021.12
Although little is known for sure about Omicron’s transmissibility and severity, policymakers around the world responded to the potential threat with swift travel restrictions focused on southern Africa.
Omnicron Variant
The Omicron coronavirus variant was first identified in South Africa on November 24 from samples collected nearly two weeks prior.13 Since its identification, it has been detected in multiple European countries, the United States, Australia, Brazil, Canada, Hong Kong, Israel, Japan, Nigeria, Norway, South Korea, Sweden, and the United Kingdom.13 Although little is known for sure about its transmissibility and severity, policymakers around the world responded to the potential threat with swift travel restrictions focused on southern Africa.14 The COVID-19 Stringency Index for the U.S., which had been steadily declining, began to increase once more, a reflection that restrictions were on the rise. This composite measure, created by the University of Oxford, tracks various response indicators including school closures and travel bans, using a range from 0 (no restrictions) to 100 (maximum restrictions). It reached a peak of 75 in November 2000 and hit a low of 45 in mid-November 2021. By the end of the month, however, it had increased 11% to 50. Similar moves were echoed around the world.15
Excess savings, online spending, early holiday demand, and inflation all contributed to a spending frenzy as retail sales rose by a seasonally adjusted 1.9% in October, bringing the cumulative total to its highest on record.
Retail Sales
On November 16, the U.S. Census Bureau reported that retail sales rose by a seasonally adjusted 1.9% in the prior month to over $565 billion, as consumers bested the previous monthly spending record set in April 2021.16 This stands in stark contrast to the height of the pandemic when monthly retail sales dipped to under $380 billion in April 2020, their lowest since February 2014.16 Since then, a flood of both monetary and fiscal stimulus has helped households accrue an estimated $2 trillion in excess savings over the course of the pandemic.17 The resulting spending frenzy has been more than enough to ward off any threat of a retail recession, and retail expenditures are now 23% above their pre-pandemic levels.16 Among the biggest monthly increases were online retailers (+4.0%) and electronics (+3.8%) as consumers continued to feed the post-COVID e-commerce explosion.18Online spending is up nearly 40% from pre-pandemic levels, and it now accounts for 16.2% of all consumer purchases. Gas stations also saw a sizable increase (+3.9%) from the month before, although much of that can be attributed to rising gasoline prices during October. Higher inflation is undoubtedly eroding a portion of the increased sales, but sales are still rising faster than prices. After adjusting for inflation, retail sales were up a healthy 0.7% in October from the previous month and up 9.5% from a year earlier.19
Supply-chain bottlenecks—stemming from COVID-related inventory and labor shortages—have contributed to higher prices and resulted in longer-than-expected delivery times on retail orders.20 With the holiday season fast approaching, economists have warned that the bump in retail activity may be the result of consumers trying to get ahead of potential delivery issues by ordering their presents early.19
Despite strong retail spending, consumers are increasingly pessimistic about the economy. In early November, the University of Michigan consumer sentiment survey fell to its lowest reading in a decade.21 In the monthly report, the most popular response explaining the drop in sentiment was “higher prices,” indicating that consumers were worried about persistent inflation, which hit its highest monthly rate (+6.2% on a year-over-year basis) in over three decades in October.22
Looking Forward
Across the globe, communities continue to recover from the effects of the COVID-19 pandemic and lockdowns, but challenges persist. While we know little about the Omicron variant, recent waves of travel bans and other government-imposed restrictions serve as a reminder that significant and unpredictable policy responses will likely continue.Although record levels of stimulus were initially welcome and likely necessary, continued stimulus—exacerbated by a multitude of supply chain issues—has led to overheating and significant inflation in parts of the economy. Attempts by the Fed to talk down inflation and the renewed travel bans may temporarily tamp down prices, but they will have offsetting impacts on already strained global supply chains. Further, the recent release of 50 million barrels of oil from the Strategic Petroleum Reserve in an attempt to “lower prices [of gasoline] for Americans” suggests market vigilantes—whether they represent bond, oil, or other markets—will have their work cut out for them.23 For now, at least, the Fed’s actions speak louder than words, and we believe that is what investors should focus on.
Consistent with last year, we are taking a patient stance, holding all views with an “open hand,” so to speak. Incoming economic data and the policy developments they help shape are fluid and highly uncertain. By implication, fixed views as to where markets will end 2023 are somewhere between silly and hazardous. While we wait for clarity on these topics, we can earn 4% to 5%—returns last experienced more than 15 years ago—on short-term government bonds. We are balancing elevated levels of portfolio liquidity with a diversified portfolio of assets that emphasizes quality and cash flow as much as we believe is prudent.
Performance Disclosures
All market pricing and performance data from Bloomberg, unless otherwise cited. Asset class and sector performance are gross of fees unless otherwise indicated.
Citations
Share it :
Disclaimer
Magnus Financial Group LLC (“Magnus”) did not produce and bears no responsibility for any part of this report whatsoever, including but not limited to any microeconomic views, inaccuracies or any errors or omissions. Research and data used in the presentation have come from third-party sources that Magnus has not independently verified presentation and the opinions expressed are not by Magnus or its employees and are current only as of the time made and are subject to change without notice.
This report may include estimates, projections or other forward-looking statements, however, due to numerous factors, actual events may differ substantially from those presented. The graphs and tables making up this report have been based on unaudited, third-party data and performance information provided to us by one or more commercial databases. Except for the historical information contained in this report, certain matters are forward looking statements or projections that are dependent upon risks and uncertainties, including but not limited to factors and considerations such as general market volatility, global economic risk, geopolitical risk, currency risk and other country-specific factors, fiscal and monetary policy, the level of interest rates, security-specific risks, and historical market segment or sector performance relationships as they relate to the business and economic cycle.
Additionally, please be aware that past performance is not a guide to the future performance of any manager or strategy, and that the performance results and historical information provided displayed herein may have been adversely or favorably impacted by events and economic conditions that will not prevail in the future. Therefore, it should not be inferred that these results are indicative of the future performance of any strategy, index, fund, manager or group of managers. Index benchmarks contained in this report are provided so that performance can be compared with the performance of well-known and widely recognized indices. Index results assume the re-investment of all dividends and interest and do not reflect any management fees, transaction costs or expenses.
The information provided is not intended to be, and should not be construed as, investment, legal or tax advice nor should such information contained herein be construed as a recommendation or advice to purchase or sell any security, investment, or portfolio allocation. An investor should consult with their financial advisor to determine the appropriate investment strategies and investment vehicles. Investment decisions should be made based on the investor’s specific financial needs and objectives, goals, time horizon and risk tolerance. This presentation makes no implied or express recommendations concerning the way any client’s accounts should or would be handled, as appropriate investment decisions depend upon the client’s specific investment objectives.
Investment advisory services offered through Magnus; securities offered through third party custodial relationships. More information about Magnus can be found on its Form ADV at www.adviserinfo.sec.gov.
Terms of Use
Definitions
Asset class performance was measured using the following benchmarks: U.S. Large Cap Stocks: S&P 500 TR Index; U.S. Small & Micro Cap: Russell 2000 TR Index; Intl Dev Large Cap Stocks: MSCI EAFE GR Index; Emerging & Frontier Market Stocks: MSCI Emerging Markets GR Index; U.S. Intermediate-Term Muni Bonds: Bloomberg Barclays 1-10 (1-12 Yr) Muni Bond TR Index; U.S. Intermediate-Term Bonds: Bloomberg Barclays U.S. Aggregate Bond TR Index; U.S. High Yield Bonds: Bloomberg Barclays U.S. Corporate High Yield TR Index; U.S. Bank Loans: S&P/LSTA U.S. Leveraged Loan Index; Intl Developed Bonds: Bloomberg Barclays Global Aggregate ex-U.S. Index; Emerging & Frontier Market Bonds: JPMorgan EMBI Global Diversified TR Index; U.S. REITs: MSCI U.S. REIT GR Index, Ex U.S. Real Estate Securities: S&P Global Ex-U.S. Property TR Index; Commodity Futures: Bloomberg Commodity TR Index; Midstream Energy: Alerian MLP TR Index; Gold: LBMA Gold Price, U.S. 60/40: 60% S&P 500 TR Index; 40% Bloomberg Barclays U.S. Aggregate Bond TR Index; Global 60/40: 60% MSCI ACWI GR Index; 40% Bloomberg Barclays Global Aggregate Bond TR Index.