The U.S. unemployment rate dropped to 5.8% in May.9 This is a pivotal improvement from the 14.8% level hit in April 2020, but it remains a far cry from the 3.5% level of February 2020.10 Under the surface, however, this improvement hides a perplexing and potentially unhealthy cross-current that is creating a disconnect between millions of out-of-work Americans and millions of “help wanted” signs.
At the end of April, Federal Reserve chairman Jerome Powell referred to this disconnect as a “labor shortage,” caused by skills mismatches, geographical disconnects, and still closed schools forcing parents to stay home to care for their children. The phrase “labor shortage” hit the mark. In May, those words saw a seven-fold increase in Google search activity relative to the long-term average.11
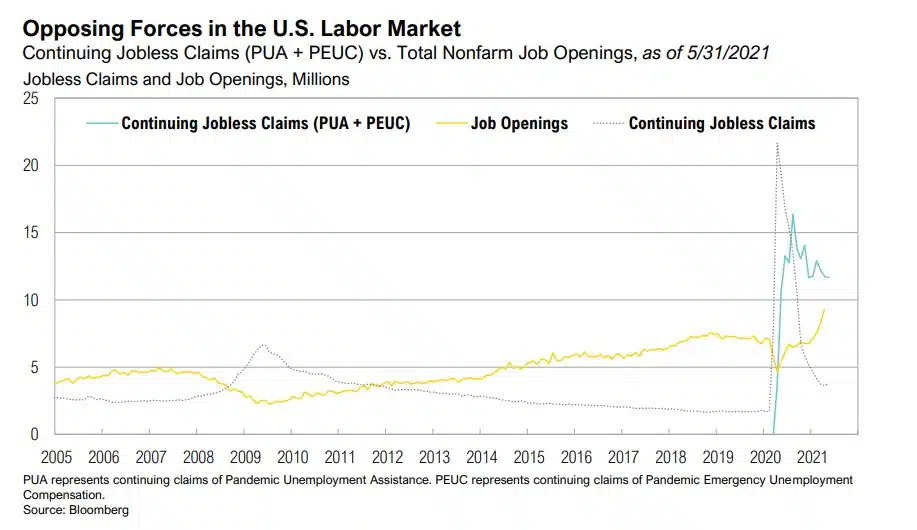
But there is more to the disconnect than closed schools and skills mismatches. Indeed, the acceleration of the economy and need for workers caught employers flat-footed, with many scaling down during the pandemic only to have to reverse course this year. This is evidenced by the 9.3 million job openings reported by the Labor Department in the May jobs report (shown below), by far the highest number ever recorded for this series.12
The pandemic also changed workers’ conditions, too. The shifting sands of the post COVID global economy, new remote work possibilities, and a range of powerful macroeconomic trends have changed people’s habits, mindsets, and plans for the future. According to the Bureau of Labor Statistics, the number of Americans who quit their jobs rose 11% to almost 4 million in April, also the highest number ever recorded for this series.12 According to a 2021 survey by Prudential Financial, slightly more than one in four U.S. workers plan to switch jobs in the wake of the pandemic.13 The trend is global. According to Microsoft’s Work Trend Index report released in March – which was based on interviews with 30,000 people across 31 countries and trillions of emails, messages, Teams meetings, and other activity across Microsoft 365 – 40% of the global workforce hopes to change jobs this year.14

Market Commentary
Market Commentary – May, 2021
Help Wanted
Real assets were the top performers for the month of May due to the continued reopening of the U.S. economy and historic levels of stimulus from Washington.
Markets
Real assets were the top performers for the month of May due to the continuation of the U.S. economic reopening and historic levels of stimulus flowing from Washington. Commodity futures and midstream energy assets rose 2.7% and 7.6%, respectively, as crude oil hit a 52-week high in May. Gold rallied 7% during the month, helped by a stabilization in longer term Treasury rates and rising inflation. The 10-year Treasury note ended the month at 1.58%, slightly lower than the 1.63% level at the end of April. Among equity bourses, foreign stocks outperformed their U.S. peers as the U.S. dollar declined 1.4%.
The 27% drop in May for the MVIS CryptoCompare Digital Assets 25 Index, a modified market cap weighted index which tracks the performance of the 25 largest and most liquid digital assets, came on the heels of news out of China that miners would face increased regulatory pressure.
One area that did experience substantial losses in an otherwise benign market environment was cryptocurrencies. While many of these digital assets remain up for the year, bitcoin, the largest cryptocurrency by market capitalization, declined a nervewracking 36% in May. At the same time, ethereum dropped 12%, and the MVIS Crypto Compare Digital Assets 25 Index, a broad proxy for some of the largest cryptocurrencies, dropped 27%. The decline came on the heels of news out of China that miners would face increased regulatory pressure, including a ban on financial firms and payment institutions from engaging in transactions denominated in cryptocurrencies.1 News out of a prominent bitcoin bull, Tesla CEO Elon Musk, didn’t help, either. On May 12, Musk tweeted that Tesla had “suspended vehicle purchasing using bitcoin,” citing concerns about “rapidly increasing use of fossil fuels for bitcoin mining and transactions, especially coal, which has the worst emissions of any fuel.” Bitcoin closed the month of May at $36,691, after hitting an all-time high of $64,870 on April 14.
The U.S. ISM Manufacturing PMI showed a 12th consecutive month of expansion in May. ISM U.S. Services PMI also demonstrated strong growth (64%) and a similarly impressive string of monthly increases
Vaccine Rollout & Growth
According to the Organization for Economic Cooperation and Development (OECD), global economic growth is now expected to be 5.8% in 2021, a sharp upwards revision from the 4.2% growth rate forecasted at the end of last year. The upgrade in the forecast was the result of historic government stimulus and the impressive vaccine rollout in the U.S. and other developed economies.2
As of May 31, over 50% of the U.S. population had received at least one vaccine dose, and approximately 41% of the population was fully vaccinated. In Europe, 31.7% had received at least one dose, and 16.8% were fully vaccinated. Key emerging markets fell significantly short of these vaccination rates. Through May, India, Brazil, Russia, and South Africa had 3.1%, 8.2%, 10.4% and 0.8%, respectively, of their populations fully vaccinated.3 Comparative data for China was not available, but they had administered an astonishing 661 million vaccine doses as of May 31, more than twice as many as any other single country.3
In the U.S., the rapid pace of the economic rebound has come at the cost of growing pressures. Excluding the more volatile food and energy components, core inflation rose by 3.8%, the highest rate since June 1992
According to the Institute for Supply Management (ISM), the May U.S. Manufacturing Purchasing Managers’ Index (PMI) came in at 61.2%, signifying solid growth and the 12th consecutive month of manufacturing expansion (readings over 50 signal expansion).4 The ISM U.S. Services PMI also demonstrated strong growth (64%) and a similarly impressive string of monthly increases. Although other PMI readings from around the world also improved in May, especially relative to the stalled readings of the pandemic era, the surveys also noted mounting frustrations. Manufacturers across the developed world griped about exploding material costs, delivery delays, and capacity limitations – many linked to tight labor markets.4 Conversely, in emerging markets like Mexico and India, manufacturing PMIs dropped as these countries continued to battle COVID-19.5,6 An excerpt from the OECD May report duly summarized the mixed state of the global economy: “Prospects for the world economy have brightened but this is no ordinary recovery. It is likely to remain uneven and dependent on the effectiveness of vaccination programs and public health policies. Some countries are recovering much faster than others. Korea and the United States are reaching pre-pandemic per capita income levels after about 18 months. Much of Europe is expected to take nearly 3 years to recover. In Mexico and South Africa, it could take between 3 and 5 years.” 7
In the U.S., the rapid pace of the rebound has come at the cost of growing economic pressures. U.S. inflation data for May showed the Consumer Price Index (CPI) rising 5.0% on a year-over-year basis.8 Excluding the more volatile food and energy components, core inflation rose by 3.8%, the highest rate since June 1992.8
According to the Bureau of Labor Statistics, the number of Americans who quit their jobs rose 11% to almost 4 million in April, also the highest number ever recorded for this series.
Help Wanted
The U.S. unemployment rate dropped to 5.8% in May.9 This is a pivotal improvement from the 14.8% level hit in April 2020, but it remains a far cry from the 3.5% level of February 2020.10 Under the surface, however, this improvement hides a perplexing and potentially unhealthy cross-current that is creating a disconnect between millions of out-of-work Americans and millions of “help wanted” signs.
At the end of April, Federal Reserve chairman Jerome Powell referred to this disconnect as a “labor shortage,” caused by skills mismatches, geographical disconnects, and still closed schools forcing parents to stay home to care for their children. The phrase “labor shortage” hit the mark. In May, those words saw a seven-fold increase in Google search activity relative to the long-term average.11
But there is more to the disconnect than closed schools and skills mismatches. Indeed, the acceleration of the economy and need for workers caught employers flat-footed, with many scaling down during the pandemic only to have to reverse course this year. This is evidenced by the 9.3 million job openings reported by the Labor Department in the May jobs report (shown below), by far the highest number ever recorded for this series.12
The pandemic also changed workers’ conditions, too. The shifting sands of the post COVID global economy, new remote work possibilities, and a range of powerful macroeconomic trends have changed people’s habits, mindsets, and plans for the future. According to the Bureau of Labor Statistics, the number of Americans who quit their jobs rose 11% to almost 4 million in April, also the highest number ever recorded for this series.12 According to a 2021 survey by Prudential Financial, slightly more than one in four U.S. workers plan to switch jobs in the wake of the pandemic.13 The trend is global. According to Microsoft’s Work Trend Index report released in March – which was based on interviews with 30,000 people across 31 countries and trillions of emails, messages, Teams meetings, and other activity across Microsoft 365 – 40% of the global workforce hopes to change jobs this year.14
One oft-cited reason for the labor shortage is record amounts of government stimulus. In Washington state, for instance, the maximum total weekly benefit available via various unemployment support programs is $1,141 per week, the equivalent of over $28 per hour for a 40-hour work week. That’s double Washington’s current minimum wage of $13.69 per hour.15 While there is more to the story, it is not hard to see how such a large mismatch could slow the pace of job gains. While it may be tempting to blame businesses for offering low wages, many of them are already feeling the pinch of higher inflation. According to the National Federation of Independent Businesses (NFIB), small business optimism fell 0.2% in May, the first decline in four months.16 NFIB’s May jobs report revealed that an incredible 48% of small business owners reported unfilled job openings, yet another all-time high for a series. Further, 8% noted that their largest problem was inflation, a four-fold increase from the average over the last five years.17
Looking Forward
It will come as no surprise to anyone that the U.S. economy is expanding at a rapid pace and inflation is a growing concern. Markets, however, are forward looking, and as investors, we must also try to be. As we do that, we must consider that today’s inflationary pressures could fade in the coming months as fiscal stimulus wanes and the inflationary effects of a post-COVID-19 rebound begin to moderate. Indeed, the uninspiring 1.58% yield on the 10-year Treasury note at the end of May suggests that the bond market may be anticipating this very dynamic. The pandemic accelerated some of the most powerful deflationary forces of the last few decades; higher government debt levels and increased technology adoption, to name a few, are arguably more deflationary today than they have ever been.
That said, we also believe investors should take policymakers at their word. In a recent press release following the G7 finance ministers meeting in London, Treasury Secretary Janet Yellen shared her thoughts about inflation and interest rates as she made her case for President Biden’s colossal $4 trillion fiscal spending proposal: “If we ended up with a slightly higher interest rate environment, it would actually be a plus for society’s point of view and the Fed’s point of view.” 18 Yellen continued, “We’ve been fighting inflation that’s too low and interest rates that are too low now for a decade.” Policymakers appear to believe that higher prices are what this economy needs, and in time, that may be what they get.
Performance Disclosures
All market pricing and performance data from Bloomberg, unless otherwise cited. Asset class and sector performance are gross of fees unless otherwise indicated.
Citations
Share it :
Disclaimer
Magnus Financial Group LLC (“Magnus”) did not produce and bears no responsibility for any part of this report whatsoever, including but not limited to any microeconomic views, inaccuracies or any errors or omissions. Research and data used in the presentation have come from third-party sources that Magnus has not independently verified presentation and the opinions expressed are not by Magnus or its employees and are current only as of the time made and are subject to change without notice.
This report may include estimates, projections or other forward-looking statements, however, due to numerous factors, actual events may differ substantially from those presented. The graphs and tables making up this report have been based on unaudited, third-party data and performance information provided to us by one or more commercial databases. Except for the historical information contained in this report, certain matters are forward looking statements or projections that are dependent upon risks and uncertainties, including but not limited to factors and considerations such as general market volatility, global economic risk, geopolitical risk, currency risk and other country-specific factors, fiscal and monetary policy, the level of interest rates, security-specific risks, and historical market segment or sector performance relationships as they relate to the business and economic cycle.
Additionally, please be aware that past performance is not a guide to the future performance of any manager or strategy, and that the performance results and historical information provided displayed herein may have been adversely or favorably impacted by events and economic conditions that will not prevail in the future. Therefore, it should not be inferred that these results are indicative of the future performance of any strategy, index, fund, manager or group of managers. Index benchmarks contained in this report are provided so that performance can be compared with the performance of well-known and widely recognized indices. Index results assume the re-investment of all dividends and interest and do not reflect any management fees, transaction costs or expenses.
The information provided is not intended to be, and should not be construed as, investment, legal or tax advice nor should such information contained herein be construed as a recommendation or advice to purchase or sell any security, investment, or portfolio allocation. An investor should consult with their financial advisor to determine the appropriate investment strategies and investment vehicles. Investment decisions should be made based on the investor’s specific financial needs and objectives, goals, time horizon and risk tolerance. This presentation makes no implied or express recommendations concerning the way any client’s accounts should or would be handled, as appropriate investment decisions depend upon the client’s specific investment objectives.
Investment advisory services offered through Magnus; securities offered through third party custodial relationships. More information about Magnus can be found on its Form ADV at www.adviserinfo.sec.gov.
Terms of Use
Definitions
Asset class performance was measured using the following benchmarks: U.S. Large Cap Stocks: S&P 500 TR Index; U.S. Small & Micro Cap: Russell 2000 TR Index; Intl Dev Large Cap Stocks: MSCI EAFE GR Index; Emerging & Frontier Market Stocks: MSCI Emerging Markets GR Index; U.S. Intermediate-Term Muni Bonds: Bloomberg Barclays 1-10 (1-12 Yr) Muni Bond TR Index; U.S. Intermediate-Term Bonds: Bloomberg Barclays U.S. Aggregate Bond TR Index; U.S. High Yield Bonds: Bloomberg Barclays U.S. Corporate High Yield TR Index; U.S. Bank Loans: S&P/LSTA U.S. Leveraged Loan Index; Intl Developed Bonds: Bloomberg Barclays Global Aggregate ex-U.S. Index; Emerging & Frontier Market Bonds: JPMorgan EMBI Global Diversified TR Index; U.S. REITs: MSCI U.S. REIT GR Index, Ex U.S. Real Estate Securities: S&P Global Ex-U.S. Property TR Index; Commodity Futures: Bloomberg Commodity TR Index; Midstream Energy: Alerian MLP TR Index; Gold: LBMA Gold Price, U.S. 60/40: 60% S&P 500 TR Index; 40% Bloomberg Barclays U.S. Aggregate Bond TR Index; Global 60/40: 60% MSCI ACWI GR Index; 40% Bloomberg Barclays Global Aggregate Bond TR Index.