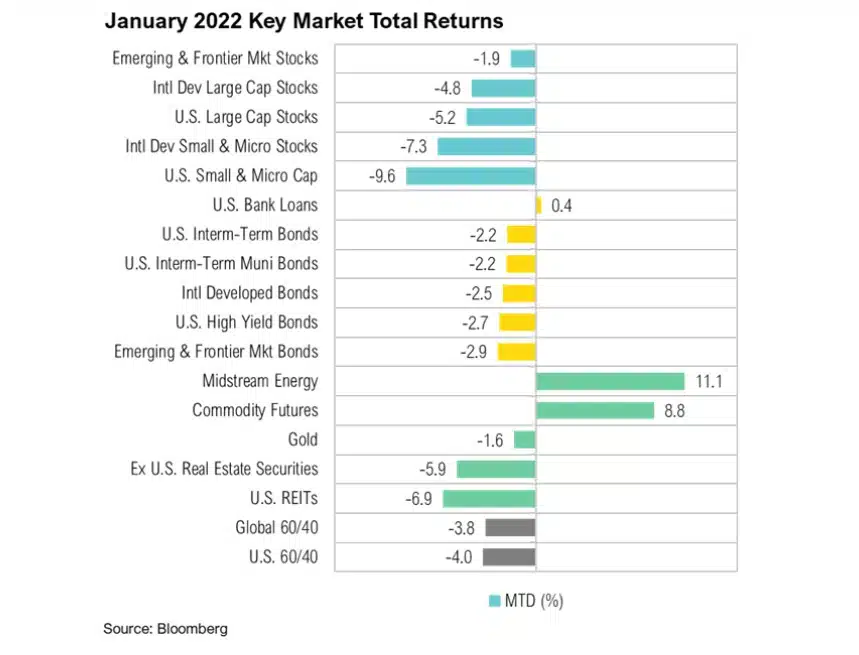
Volatility, which was absent in 2021, returned in dramatic fashion in January. Global stocks, as proxied by the MSCI All Country World Index, entered official correction territory during the month, but thanks to a late-January rebound, losses narrowed to – 4.9%. U.S. stocks, as measured by the S&P 500 Index, experienced the largest monthly drawdown since the start of the pandemic (-5.2%). Geopolitical concerns, continued supply-chain bottlenecks, and the imminent end of crisis-era monetary and fiscal policy support all hit during the month, leaving investors with few safe places to turn to. In fact, the Bloomberg U.S. Aggregate Bond Index returned -2.2% during the month.
Of all of these concerning factors, the anticipated pivot in monetary policy was perhaps the most jarring. Alarm bells first rang on January 5, when the minutes from the December Federal Open Market Committee (FOMC) meeting were released. The minutes suggested the Fed would hike rates sooner and potentially more aggressively than had previously been expected.1 In the ensuing weeks, markets began to adjust to the reality of potentially higher rates and lower levels of liquidity. By the end of the month, expectations were for five hikes over the course of 2022, with the first to occur in March.6
This environment has been broadly bad for bonds as they have been forced to adjust to higher levels of inflation and the inevitability of rate hikes. The yield on the benchmark U.S.10-year Treasury rose dramatically in January from 1.51% to close the month at 1.78%. The yield on the 2-year Treasury also jumped substantially from 0.75% to 1.22%. The spread between these two yields, often used as a proxy for the health of the economy, declined to just 61 basis points, the lowest level in over a year.

Market Commentary
Market Commentary – January, 2022
Behind the Curve
and higher valuation growth stocks.
Volatility, which was absent in 2021, returned in dramatic fashion in January as Global stocks entered official correction territory during the month.
Overview
Volatility, which was absent in 2021, returned in dramatic fashion in January. Global stocks, as proxied by the MSCI All Country World Index, entered official correction territory during the month, but thanks to a late-January rebound, losses narrowed to – 4.9%. U.S. stocks, as measured by the S&P 500 Index, experienced the largest monthly drawdown since the start of the pandemic (-5.2%). Geopolitical concerns, continued supply-chain bottlenecks, and the imminent end of crisis-era monetary and fiscal policy support all hit during the month, leaving investors with few safe places to turn to. In fact, the Bloomberg U.S. Aggregate Bond Index returned -2.2% during the month.
Of all of these concerning factors, the anticipated pivot in monetary policy was perhaps the most jarring. Alarm bells first rang on January 5, when the minutes from the December Federal Open Market Committee (FOMC) meeting were released. The minutes suggested the Fed would hike rates sooner and potentially more aggressively than had previously been expected.1 In the ensuing weeks, markets began to adjust to the reality of potentially higher rates and lower levels of liquidity. By the end of the month, expectations were for five hikes over the course of 2022, with the first to occur in March.6
This environment has been broadly bad for bonds as they have been forced to adjust to higher levels of inflation and the inevitability of rate hikes. The yield on the benchmark U.S.10-year Treasury rose dramatically in January from 1.51% to close the month at 1.78%. The yield on the 2-year Treasury also jumped substantially from 0.75% to 1.22%. The spread between these two yields, often used as a proxy for the health of the economy, declined to just 61 basis points, the lowest level in over a year.
The January inflation reading showed that the CPI rose to 7.5% on a year-over-year basis. Monetary policy orthodoxy suggests the Fed would normally be well into a hiking cycle by now. However, the Fed Funds Rate is still at zero, and the Fed is actively engaged in largescale asset purchases (quantitative easing) through March.
Behind the Curve
The January inflation reading (released on February 10) showed that the Consumer Price Index (CPI) rose to 7.5% on a year-over-year basis. Monetary policy orthodoxy suggests the Fed would normally be well into a hiking cycle by now. Rather than higher rates, however, the Fed Funds Rate is still at zero, and the Fed is actively engaged in large-scale asset purchases (quantitative easing) through March. This unusual situation is captured by the chart below, which shows the Fed Funds Rate adjusted for inflation (teal shaded area) going back to 1960. When viewed relative to the current inflation rate, the stance of monetary policy represents an astonishing outlier. As a result, investors may no longer be able to rely on the ‘Fed put’—the point at which the pain from a market decline exceeds the risks of the Fed pivoting policy back to easing. Today, inflation is clearly the larger concern, and it may be the Fed’s priority for the foreseeable future.
Wage growth remains well below the rate of inflation, eroding the purchasing power of consumers
Because the U.S. labor market staged a remarkable recovery from its pandemic downturn and remained robust throughout last year, the Fed’s tightening strategy still has work to do. Throughout 2022, unemployment levels remained near all-time lows, ending 2022 at 3.7%.9 Both initial and ongoing jobless claims ended the year lower than where they started in 2022.10 The ratio of job openings to unemployed people has remained near all time highs at 1.7x.11 Given the tight labor market, nominal wages remain elevated, growing at a pace well above sustainable levels and contributing to elevated inflation. As the Fed continues to try and clamp down on demand, the unemployment rate should start to increase. According to economist Bill Dudley, “This will require a persistent string of payroll gains of less than 100,000 per month and a rise in the unemployment rate to at least 4.5% from the current 3.7%”.12 In a nod in the right direction, the nonfarm payrolls report for December showed a meaningful cooling of wage growth, and the year-over-year measure fell from 5.0% to 4.6%.13 While this is a positive from the Fed’s inflation fighting point of view, wage growth remains well below the rate of inflation, eroding the purchasing power of consumers.
Despite a tough backdrop for real (inflation-adjusted) wages, consumers continued spending throughout 2022. Real personal consumption expenditures in 2022 consistently showed year-over-year growth of 2%, right in line with the average growth rate from 2010 to 2019.14 But this spending has come at a cost. The personal savings rate is currently 2.4%—its lowest level since 2005.15 In addition, total consumer credit increased by more than $300 billion—a record—to $4.7 trillion.16 Household debt service payments as a percentage of disposable income have climbed to 9.7%.17 Should economic activity slow further, the labor market starts to dive, and consumer finances worsen, politicians will likely look to pump more cash to consumers via fiscal support, just as they have in the past three recessions. Such measures would counteract the Fed’s efforts to reduce demand.
Companies within the S&P 500 Index have reported higher quarterly earnings than were expected at the end of last year. Approximately 60% of S&P 500 companies have reported earnings.
Earnings Update
As of Friday, February 4, roughly 60% of S&P 500 companies have reported earnings for the fourth quarter.2 Overall, the index is reporting higher earnings than were expected at the end of last year. Of the companies that have reported, 76% beat their analyst earnings estimates, equal to the five-year average.2 The estimated earnings growth rate is now 29% quarter-over-quarter and more than 45% year-over-year. If the 29% figure stands, it would mark the fourth straight quarter of at least 25% earnings growth; the last time this happened was from the fourth quarter of 2009 through the third quarter of 2010 as the economy recovered from the Global Financial Crisis. These outstanding average growth rates were mainly due to a combination of higher earnings in 2021 and an easier comparison to weaker earnings in 2020 due to COVID’s negative impact on several industries.
In contrast to the solid results of the fourth quarter, analysts decreased first-quarter earnings estimates for companies in the S&P 500 in January by 0.7%.3 This marked the first monthly decrease in analyst estimates since the height of the pandemic in the second quarter of 2020. At the sector level, four sectors recorded an increase in their earnings estimates for the first quarter during the first month of the quarter, led by energy (+5.9%). Seven sectors recorded a decline, led by industrials (-10.1%).
Two influential earnings announcements were Meta (formerly Facebook) and Amazon. These two stocks represented over 5% of the S&P 500 at the end of January. Meta missed on earnings by 4.4%, and the stock subsequently plummeted by over 25% the next day.4 The company guided 3-11% sales growth for the first quarter, suggesting a sharp deceleration in social media ad spend mainly because of Apple’s changes to its user privacy and data usage agreements, which restricted Meta from capitalizing on user data on both Facebook and Instagram. Amazon reported earnings per share of $27.75, far above the analyst consensus of $3.77.5 However, most of that was due to a mark-tomarket of their Rivian, an electric automaker, investment following its IPO on November 10. Even after controlling for this, the company still had a solid quarter driven by 40% revenue growth in their Amazon Web Services segment. The company also announced that it will increase its Prime Membership fees by over 15%, sending the stock higher by 12% after dropping 8% the day prior due to Meta’s weak earnings release. The price hike by Amazon and favorable market reaction highlights a critical issue for companies this year—some will be able to successfully pass higher prices along to their customers, but it will not go this smoothly for everyone.
Looking Forward
We continue to believe that incoming inflation data will determine the path of monetary policy. We also believe the trajectory of interest rate hikes and balance sheet runoff, if pursued, will be crucial in determining the path of risky assets, such as equities. Further, because inflation is so elevated, we believe the “Fed put” may be meaningfully below current prices for many risky investments.
Performance Disclosures
All market pricing and performance data from Bloomberg, unless otherwise cited. Asset class and sector performance are gross of fees unless otherwise indicated.
Citations
Share it :
Disclaimer
Magnus Financial Group LLC (“Magnus”) did not produce and bears no responsibility for any part of this report whatsoever, including but not limited to any microeconomic views, inaccuracies or any errors or omissions. Research and data used in the presentation have come from third-party sources that Magnus has not independently verified presentation and the opinions expressed are not by Magnus or its employees and are current only as of the time made and are subject to change without notice.
This report may include estimates, projections or other forward-looking statements, however, due to numerous factors, actual events may differ substantially from those presented. The graphs and tables making up this report have been based on unaudited, third-party data and performance information provided to us by one or more commercial databases. Except for the historical information contained in this report, certain matters are forward looking statements or projections that are dependent upon risks and uncertainties, including but not limited to factors and considerations such as general market volatility, global economic risk, geopolitical risk, currency risk and other country-specific factors, fiscal and monetary policy, the level of interest rates, security-specific risks, and historical market segment or sector performance relationships as they relate to the business and economic cycle.
Additionally, please be aware that past performance is not a guide to the future performance of any manager or strategy, and that the performance results and historical information provided displayed herein may have been adversely or favorably impacted by events and economic conditions that will not prevail in the future. Therefore, it should not be inferred that these results are indicative of the future performance of any strategy, index, fund, manager or group of managers. Index benchmarks contained in this report are provided so that performance can be compared with the performance of well-known and widely recognized indices. Index results assume the re-investment of all dividends and interest and do not reflect any management fees, transaction costs or expenses.
The information provided is not intended to be, and should not be construed as, investment, legal or tax advice nor should such information contained herein be construed as a recommendation or advice to purchase or sell any security, investment, or portfolio allocation. An investor should consult with their financial advisor to determine the appropriate investment strategies and investment vehicles. Investment decisions should be made based on the investor’s specific financial needs and objectives, goals, time horizon and risk tolerance. This presentation makes no implied or express recommendations concerning the way any client’s accounts should or would be handled, as appropriate investment decisions depend upon the client’s specific investment objectives.
Investment advisory services offered through Magnus; securities offered through third party custodial relationships. More information about Magnus can be found on its Form ADV at www.adviserinfo.sec.gov.
Terms of Use
Definitions
Asset class performance was measured using the following benchmarks: U.S. Large Cap Stocks: S&P 500 TR Index; U.S. Small & Micro Cap: Russell 2000 TR Index; Intl Dev Large Cap Stocks: MSCI EAFE GR Index; Emerging & Frontier Market Stocks: MSCI Emerging Markets GR Index; U.S. Intermediate-Term Muni Bonds: Bloomberg Barclays 1-10 (1-12 Yr) Muni Bond TR Index; U.S. Intermediate-Term Bonds: Bloomberg Barclays U.S. Aggregate Bond TR Index; U.S. High Yield Bonds: Bloomberg Barclays U.S. Corporate High Yield TR Index; U.S. Bank Loans: S&P/LSTA U.S. Leveraged Loan Index; Intl Developed Bonds: Bloomberg Barclays Global Aggregate ex-U.S. Index; Emerging & Frontier Market Bonds: JPMorgan EMBI Global Diversified TR Index; U.S. REITs: MSCI U.S. REIT GR Index, Ex U.S. Real Estate Securities: S&P Global Ex-U.S. Property TR Index; Commodity Futures: Bloomberg Commodity TR Index; Midstream Energy: Alerian MLP TR Index; Gold: LBMA Gold Price, U.S. 60/40: 60% S&P 500 TR Index; 40% Bloomberg Barclays U.S. Aggregate Bond TR Index; Global 60/40: 60% MSCI ACWI GR Index; 40% Bloomberg Barclays Global Aggregate Bond TR Index.