 It’s often said that big things come in small packages.
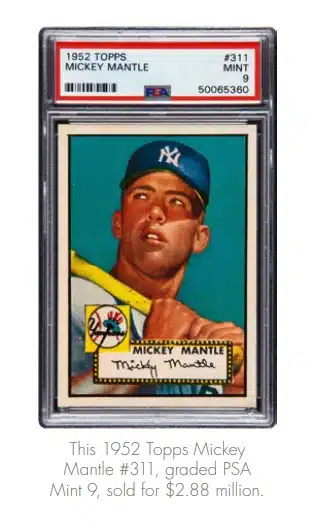
In 1952, the Topps Company printed a few Mickey Mantle baseball trading cards in some of their bubble gum packages, worth about five cents at the time. After Mantle had a legendary career, including achieving the all-time World Series record for home runs, those baseball cards now trade for big money. In 2006, a mint condition ’52 Topps Mantle sold for over $282,000, according to Forbes magazine. In 2018, a similar card raked in $2.88 million – approximately 10 times the amount, at a Heritage sports card auction. The seller was former NFL Pro Bowl offensive guard Evan Mathis, who is an avid collector of rare professional sports trading cards.
“The 1952 Mickey Mantle baseball card is the most expensive post-World War II trading card,” says Chris Ivy, Director of Sports Auctions at Heritage, adding, “The card that was sold in 2018 is one of just six examples graded Mint 9 by PSA and the winning bid surpassed the card’s previous auction record by more than $2.5 million.”
For some, collecting cards is about the fun. For others, it’s about the money. Few investments can appreciate like collectibles, and that also means these small packages can carry some surprises – big tax bills. When it comes to collectibles held for longer than one year, Uncle Sam wants 28 percent of your capital gains. This represents a bump up from the 20 percent tax rate associated with the sale of other investments, such as stocks and bonds. Is there a way to sell collectibles without the government collecting a chunk of your gains?
The Tax Cuts and Jobs Act of 2017 (TCJA) created a new provision that offers big tax benefits. Taxpayers can now defer short-term and longterm capital gains from the sale of qualified assets by reinvesting all or a portion of their gains in a Qualified Opportunity Zone. QOZs allow sellers to redeploy their gains, within 180 days of the sale, into designated urban and rural areas while at the same time decreasing an investor’s tax, potentially down to nothing. That’s right – potentially down to zero taxes.
Starting in 2018, the IRS allowed governors of U.S. states, possessions or territories to designate certain low-income, high-poverty areas as QOZs, which retain their designations for 10 years. You cannot, however, directly invest into a QOZ. Instead, you must invest in a Qualified Opportunity Fund, or QOF. To maximize the tax benefits, under the current law, you would want to invest before the close of 2019.
A QOF is an investment vehicle that is set up as either a partnership or corporation to invest in eligible property that is located in a QOZ. They are required to hold at least 90 percent of their assets in QOZ property, including newly issued stock, partnership interests or business property in a QOZ business.
What types of asset sales apply? The sale of highly appreciated real estate, businesses and partnership interests all qualify and are the most prevalent. But that is not all, as the benefit can apply to both personal and intangible assets, including intellectual property, patents, artwork– and yes, even professional player trading cards.
Here are the basics of how a QOZ investment could work using Mathis as our example:
Let us assume Mathis paid $1 million for his Mickey Mantle card in 2019 and ultimately sold it, 12 months and one day later, for $3 million. The sale would create a $2 million long-term capital gain, which would normally trigger a $560,000 federal tax bill in the year of the sale, not including city tax, state tax and/or net investment income tax (3.8 percent). Since there is technically no cap on the size of the reinvested gain, let’s say he invested the entire $2 million gain into a QOF. By doing this, the gain on the original sale is deferred for later recognition – upon the earlier of either (1) the sale of the QOF interest, or (2) Dec. 31, 2026. If held in the QOF for at least five years, 10 percent of the originally deferred gain would be forgiven, which would bring his federal capital gains tax down to $504,000 ($1.8 million x 28 percent). If held for seven years, 15 percent of the originally deferred gain would be forgiven, which would bring his federal capital gains tax down to $476,000 ($1.7 million x 28 percent). Best of all, if held for 10 years, he could eliminate the entire gain on the investment made into the QOF. Assuming he did, if his $2 million investment grew to $6 million over that period, he would owe zero taxes on the capital appreciation. This would save Mathis $1.12 million in projected capital gains tax. The longer an investment is held in a QOZ, the bigger the tax benefits.
In baseball, one marvels when a triple play occurs and that is no different in the tax-planning world. In our example, Mathis was able to turn a triple tax play resulting in both tax-deferral and tax reduction on the original sale and the elimination of the entire tax associated with his prudent investment in a QOZ.
If you’re sitting on investments with large capital gains, an investment in a QOZ can provide significant tax planning utility. It’s a gift from the IRS that some financial service professionals are calling the greatest tax play in American history.
Sometimes, big things can come in big packages – tax packages that is!