
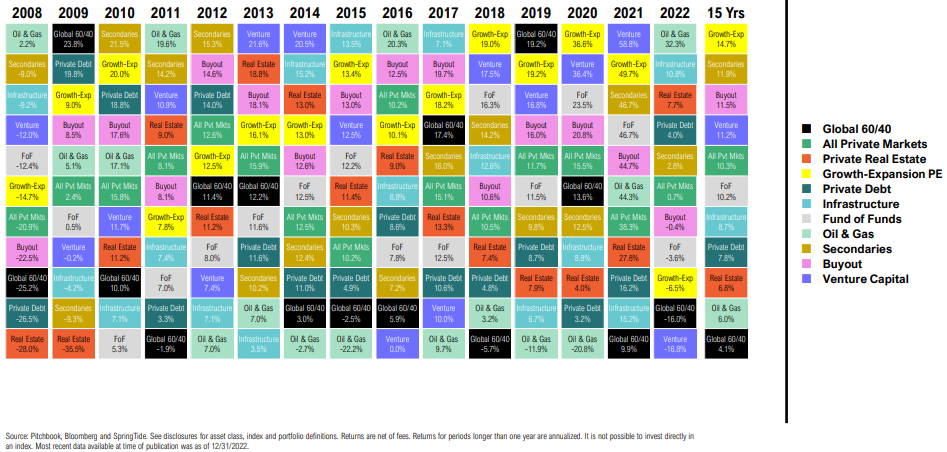
Asset Allocation
Returns Summary
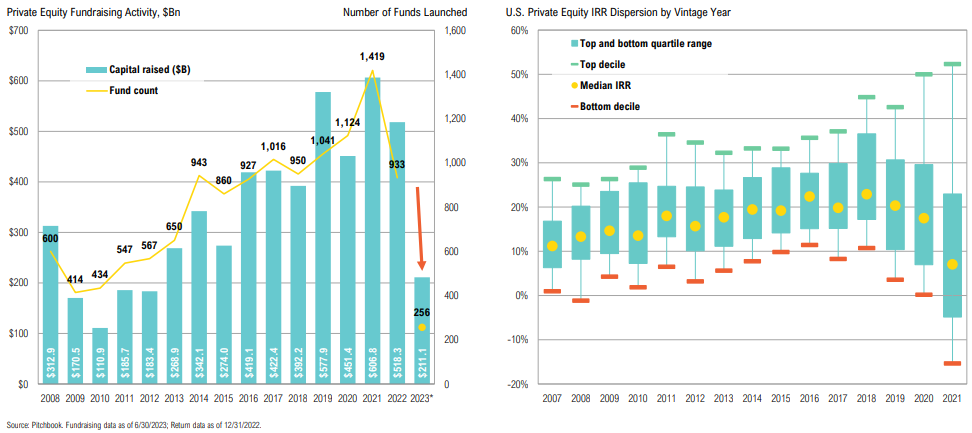
Fundraising
Private capital fundraising has been in decline since Q4 2021
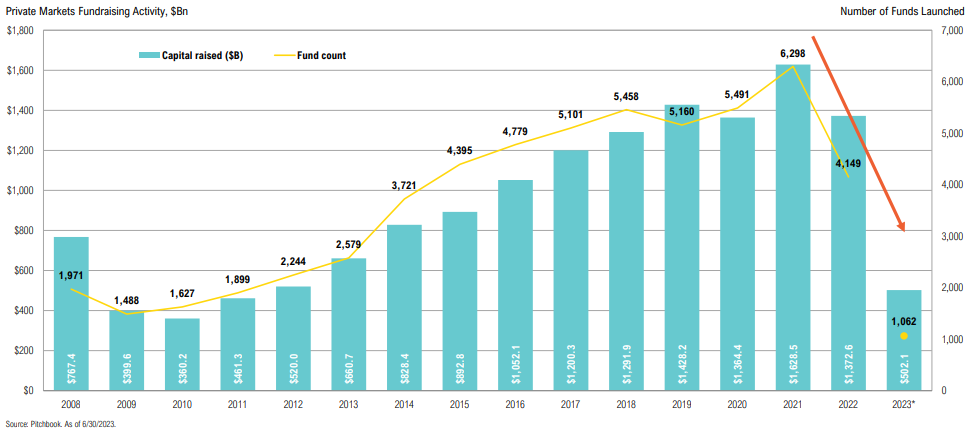
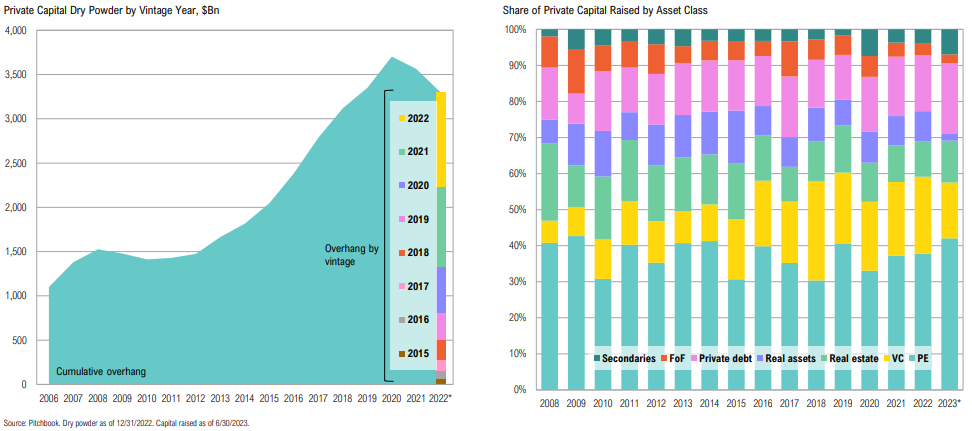
In the first 6 months of 2023, Private Debt and Secondaries took in a larger share of capital than usual
Fundraising for 2023 is substantially behind the pace of recent years
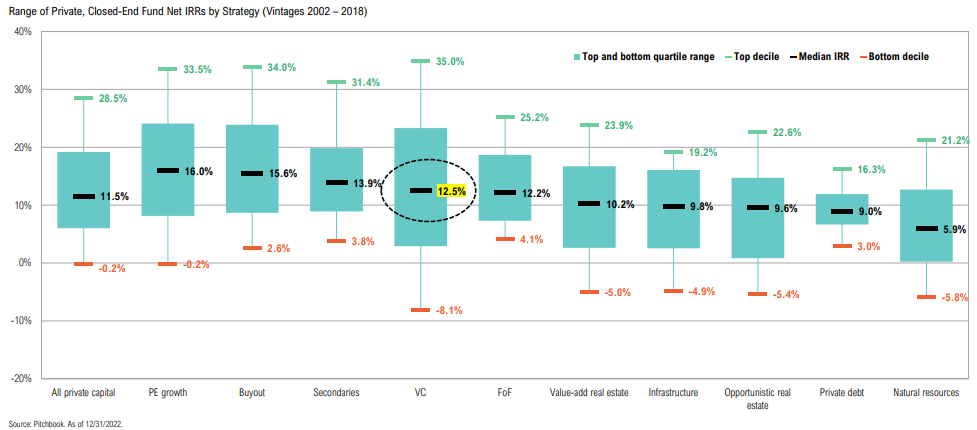
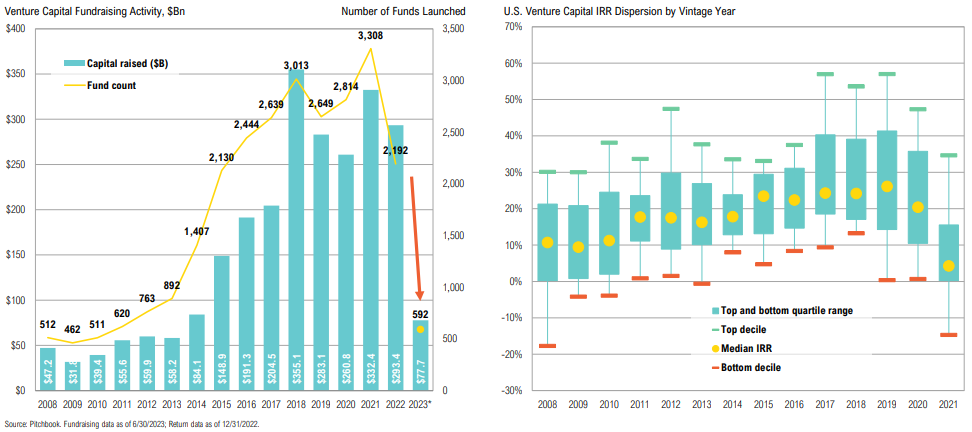
Cross-Asset Quartile Returns
Despite relatively strong returns over the last decade, the median VC fund has lagged other private equity strategies over longer time horizons
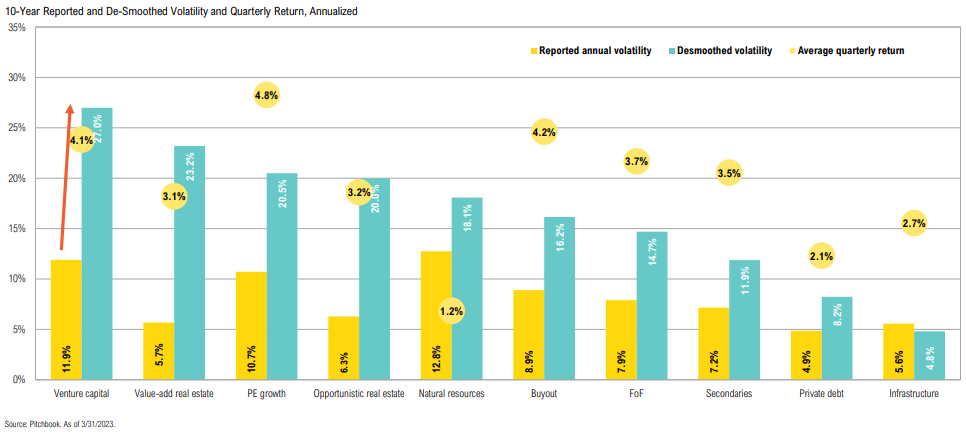
Volatility
True investment volatility risk is underestimated across private markets
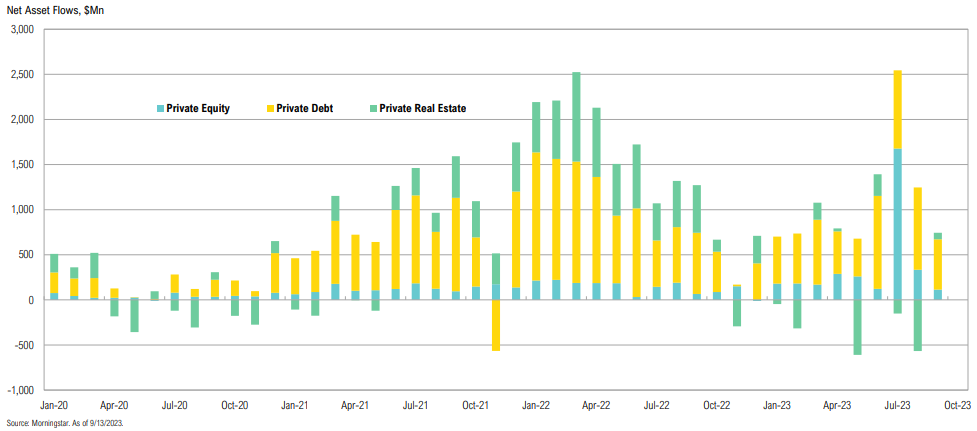
Interval Funds
Private equity and debt interval fund flows remain surprisingly strong; private real estate continues to see outflows
Private Equity & Venture
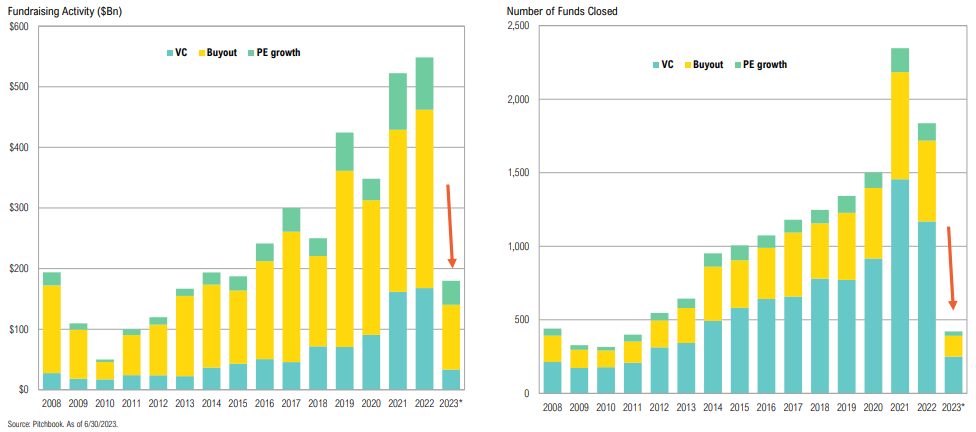
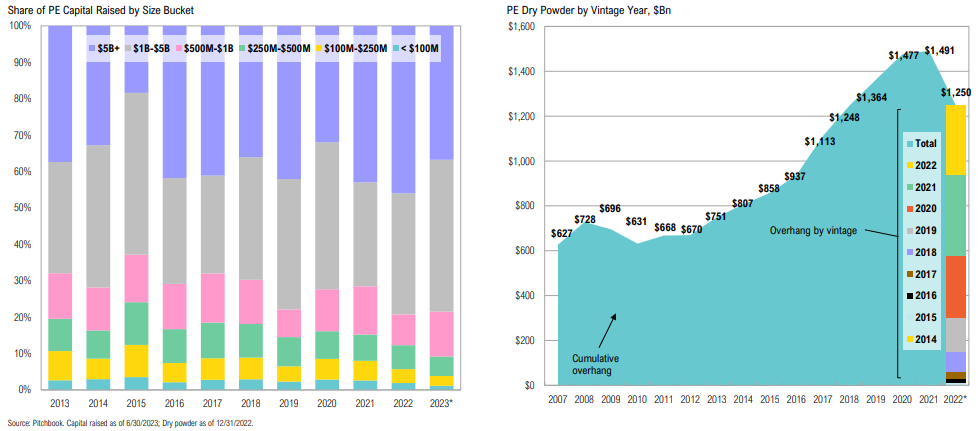
Private Equity: Fundraising
The PE fundraising environment remains challenged, with the number of funds closed tracking just 27.4% of 2022 levels
Mega funds saw a decline in share of PE fundraising value with LPs turning to smaller funds
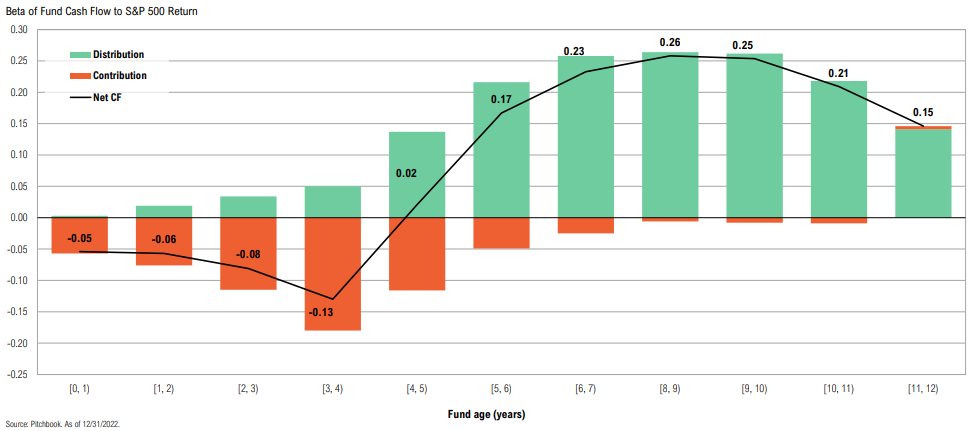
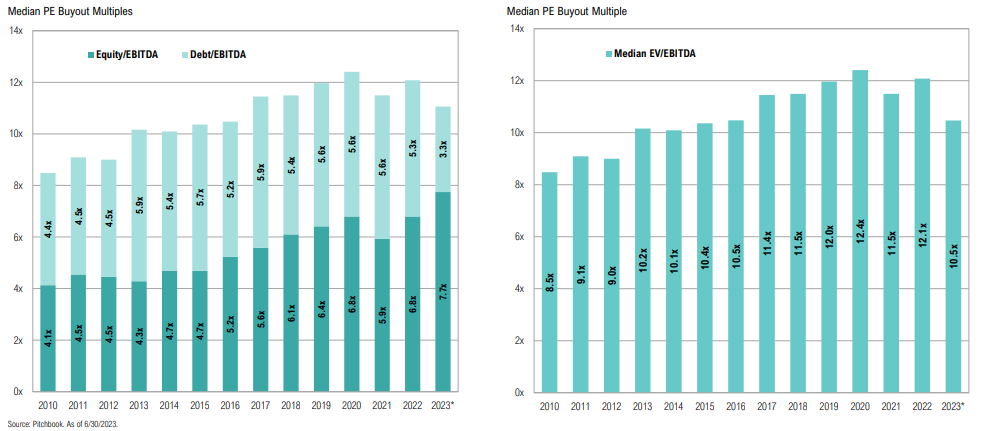
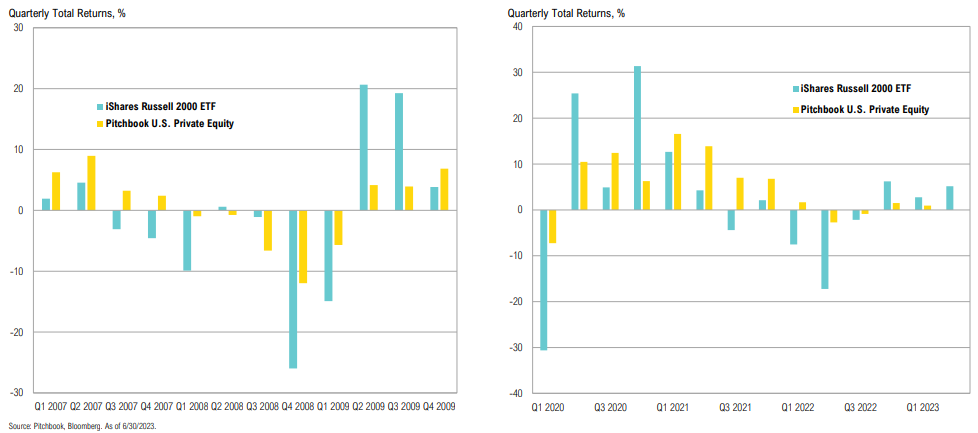
Buyout
Buyout funds tend to become more correlated with public equity returns as they mature
PE Buyout multiples continue to creep higher; equity share in new deals is above 70%
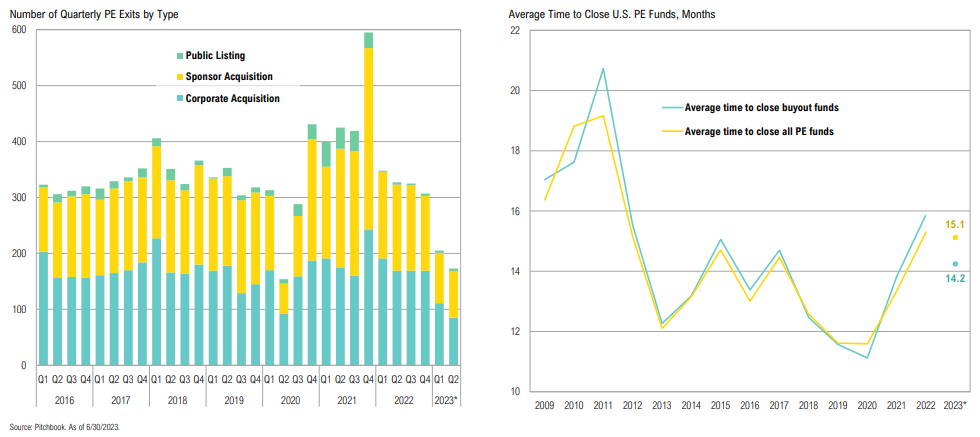
Exits
Another year of stunted exits: YTD exit activity is less than half of that seen in 2022
Performance
Private equity funds have not marked down properties like they did in the GFC
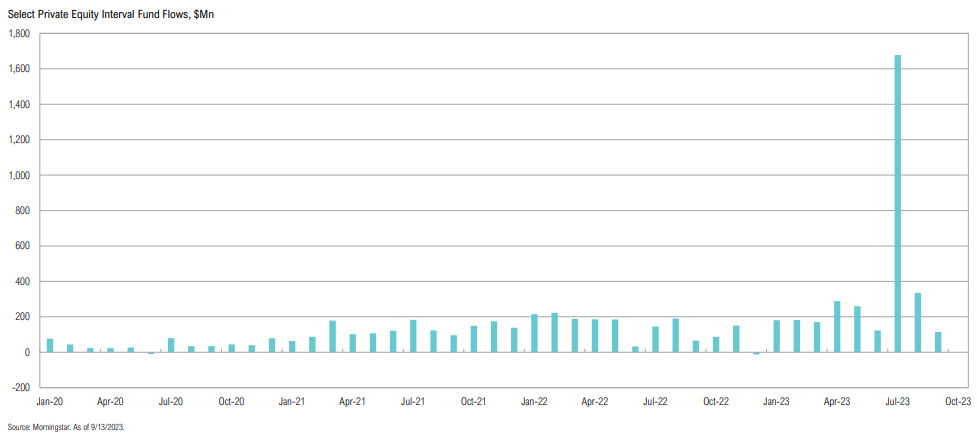
Interval Funds
Private equity interval funds continue to see inflows
Venture capital is not for everyone, but neither is starting a business
-Marc Andreessen
Venture Capital: Fundraising
Global VC fundraising has been extraordinarily low in 2023
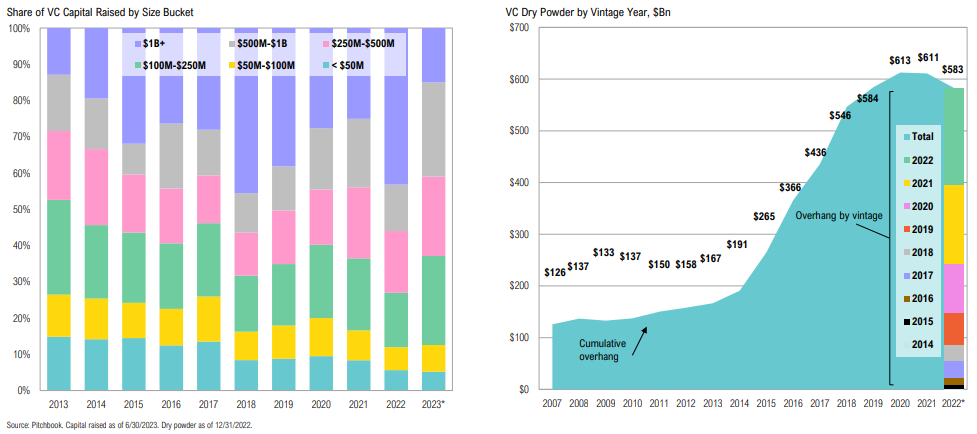
The major factor driving the lack of fundraising has been the absence of $1Bn+ funds, which only account for 15% of 2023 commitments
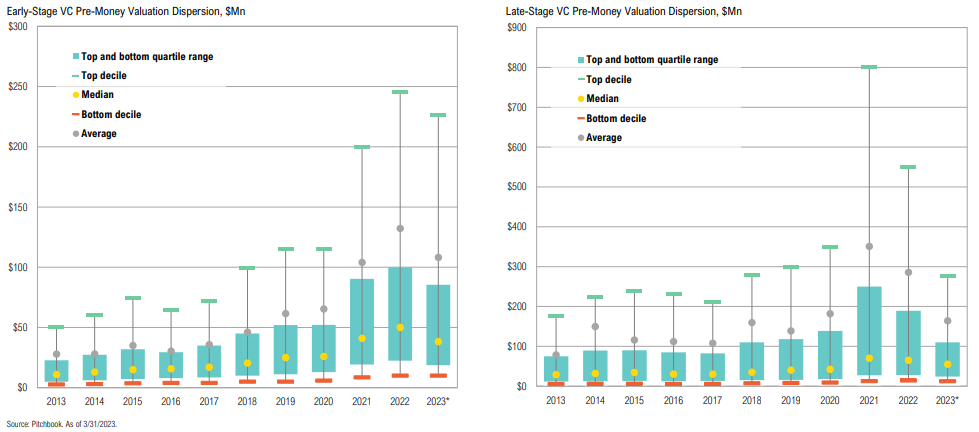
Valuations
Late-stage VC continues its descent from 2022 as the demand for capital at the late-stage far outweighs the supply
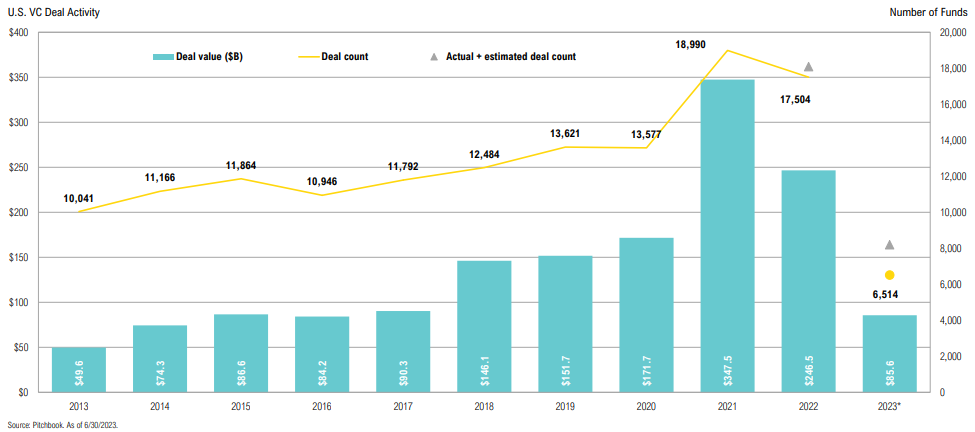
Deal Activity
Nontraditional investors have continued to pull away from VC because of a lack of liquidity
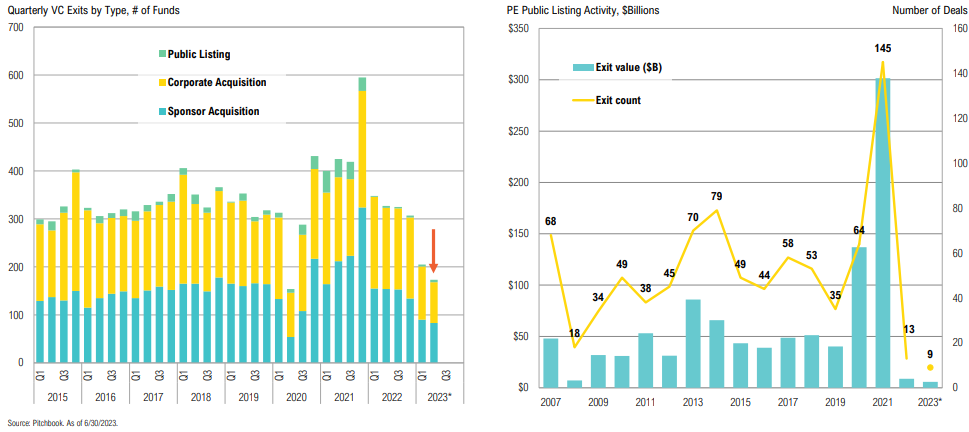
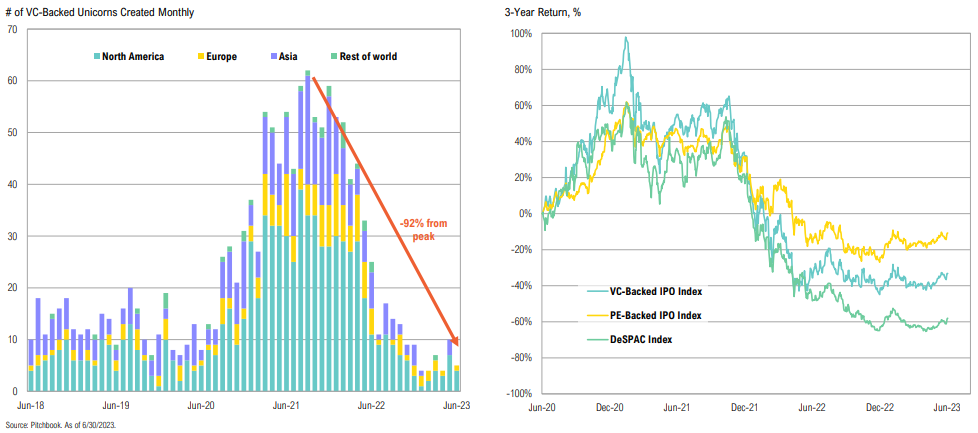
Exits
The dire state of public exits has continued through 2023
2021 venture unicorns have flopped in the public markets
Private Credit
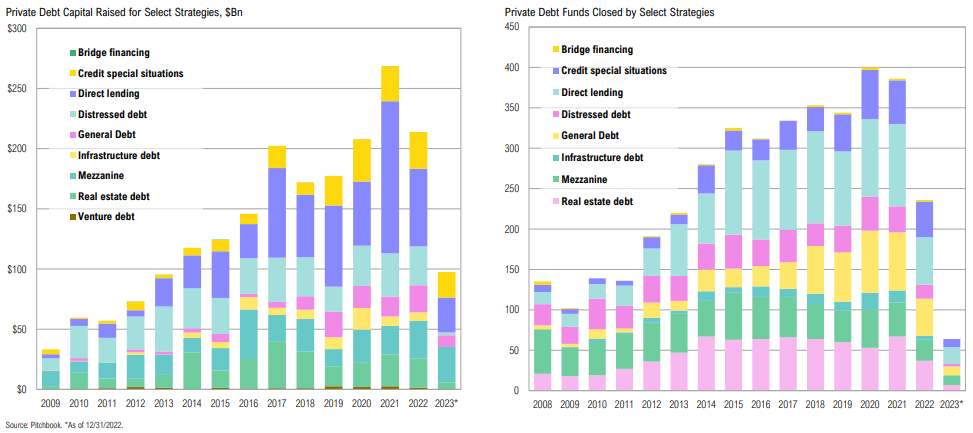
Private Credit: Fundraising
Private debt is tracking moderately ahead of 2022 and is likely to exceed $200Bn for the fourth consecutive year
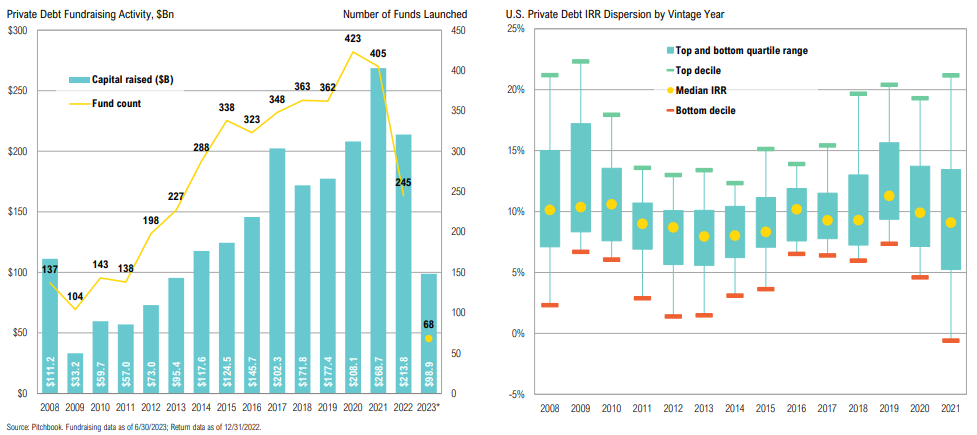
Pure distressed strategies have fallen sharpy while special credit situations saw elevated fundraising
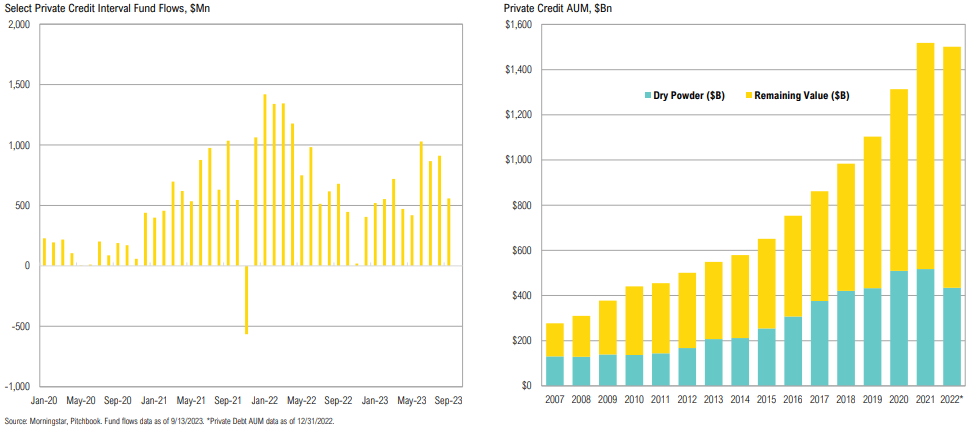
Interval Fund Flows
Private Credit/Debt interval funds continue to receive steady inflows; with higher yields, dry powder hit a 5-year low
Valuations
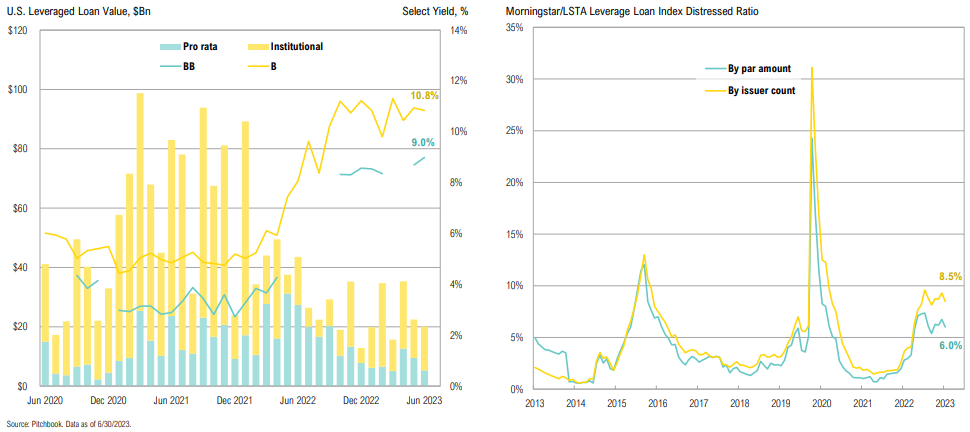
Both the institutional loan and unsecured bond market have dried up
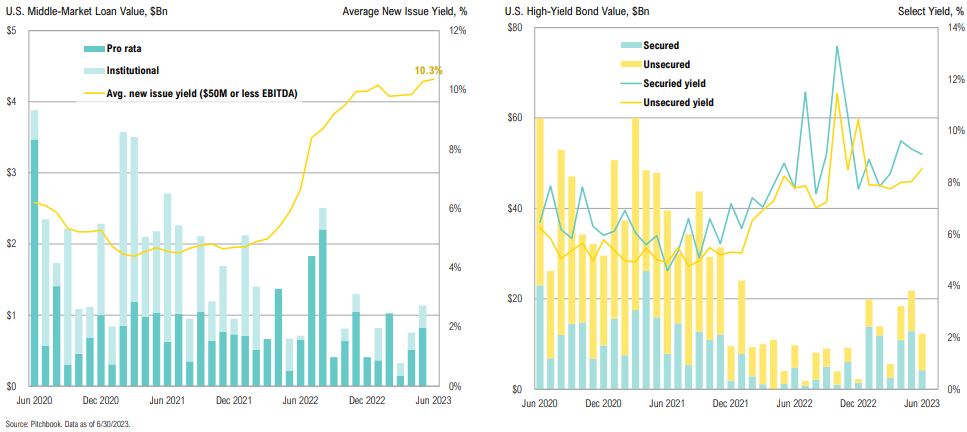
While high yield bond spreads remain tight, the loan market is showing signs of stress
Real Assets: PRE, Energy & Infrastructure
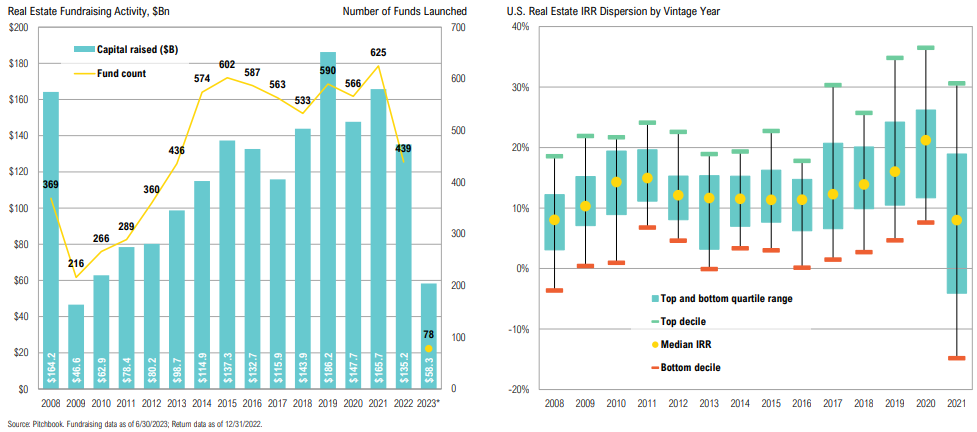
Real Assets: PRE Fundraising
Blackstone Real Estate Partners X, 1 of 78 closed funds, has been responsible for over half of the $58.3Bn raised capital during 2023
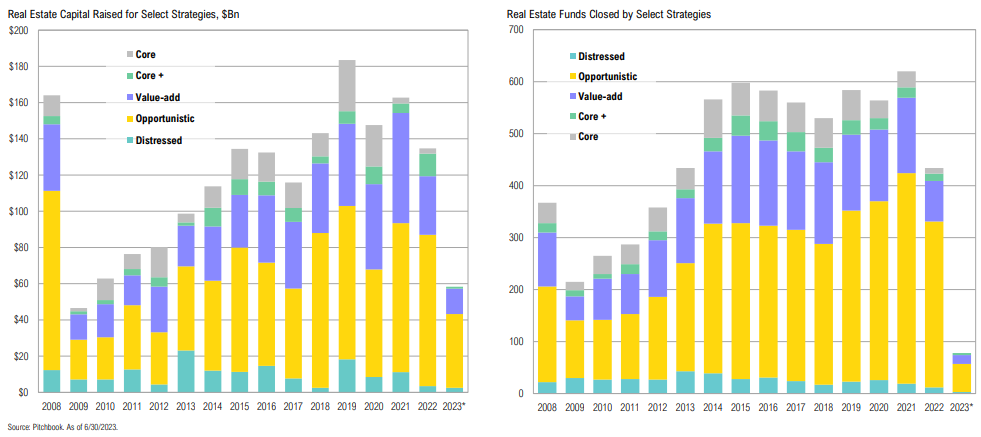
Opportunistic real estate funds received 70% of raised capital, while core and core-plus received less than 2%
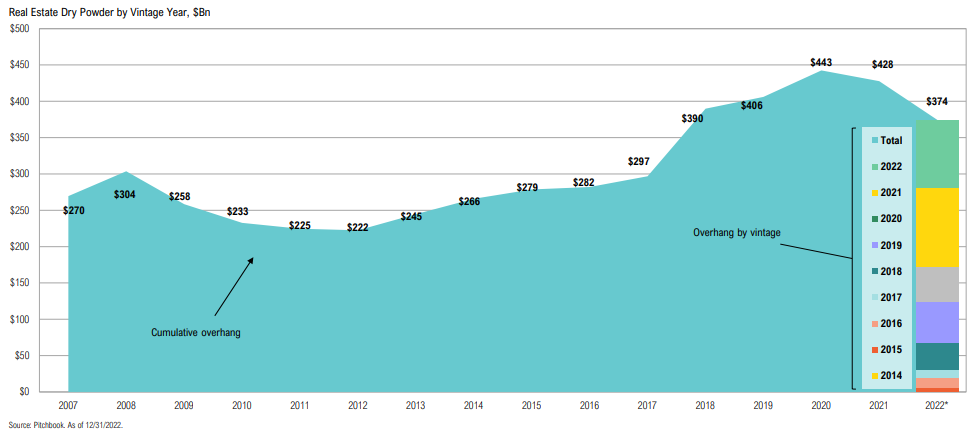
PRE Dry Powder
30% of private real estate dry powder is from 2021 vintages
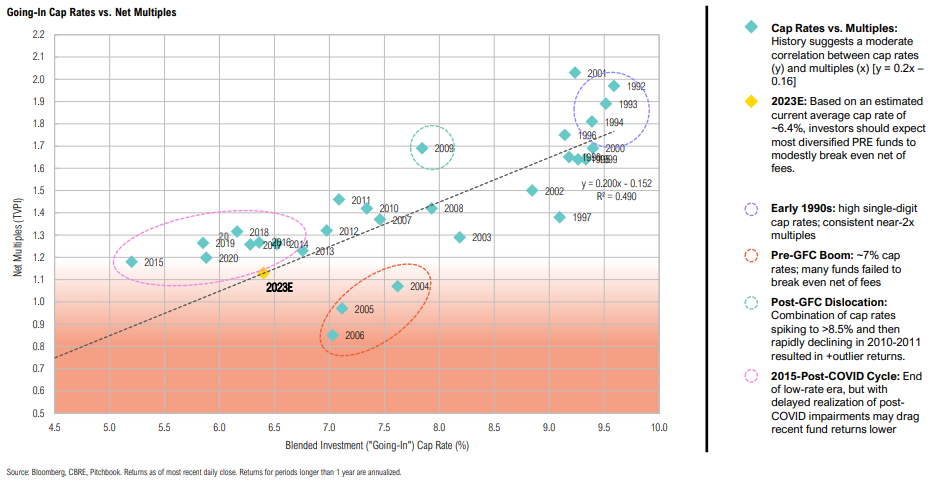
PRE Performance
Longer-Term (lagged) returns for various private real estate markets show the impact of going-in cap rates on subsequent returns
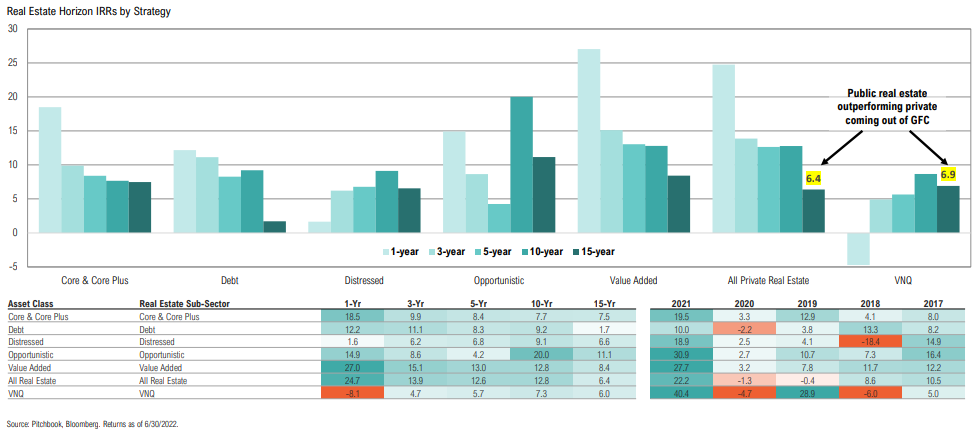
Private real estate funds have not yet marked down properties like they did in the GFC
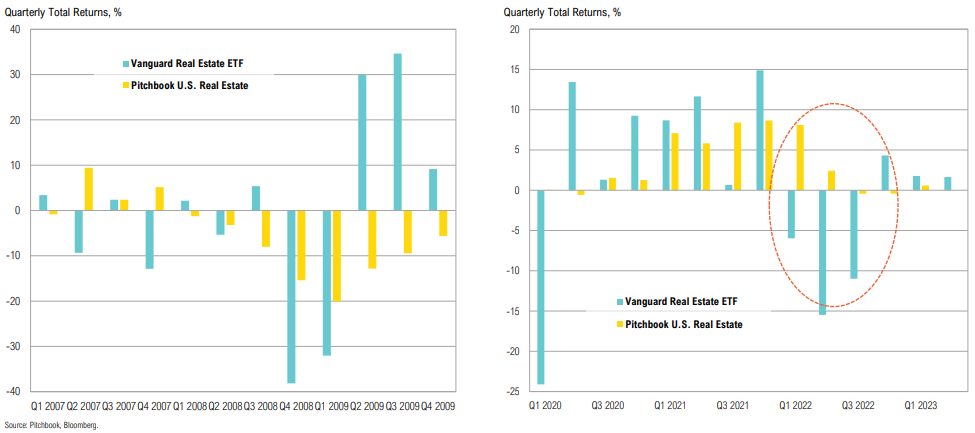
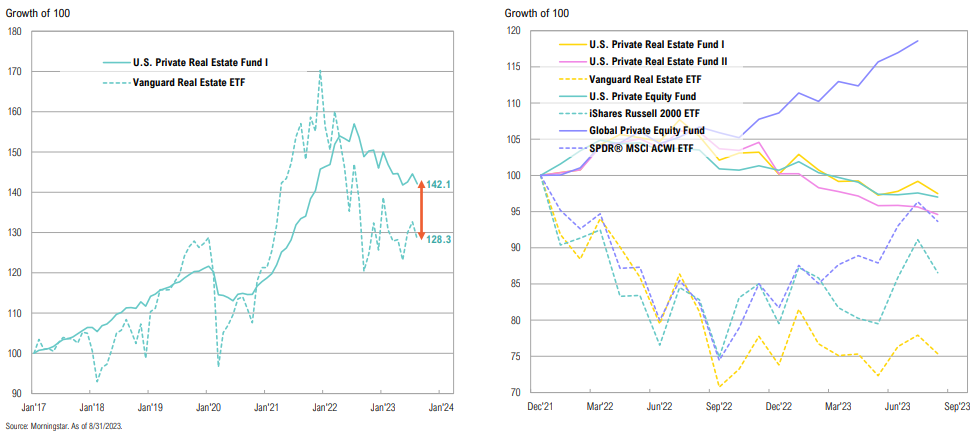
PRE vs. Public REITs
Private market interval fund NAVs have been drifting lower as 2022 markdowns are slowly filtering through
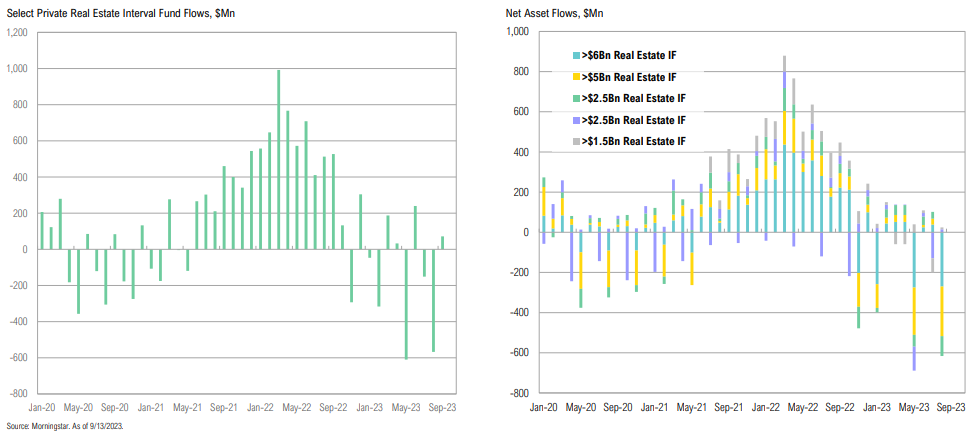
PRE Interval Funds
Large private real estate funds have gated redemptions two quarters in a row
PRE Valuations & Multiples
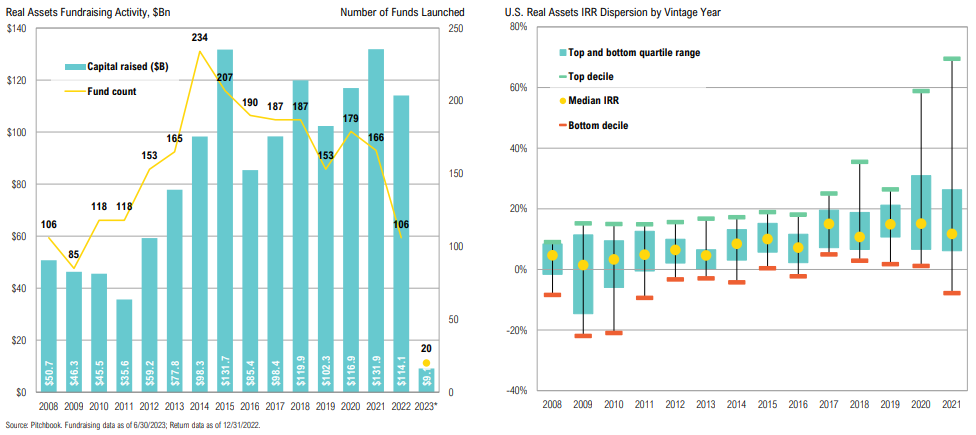
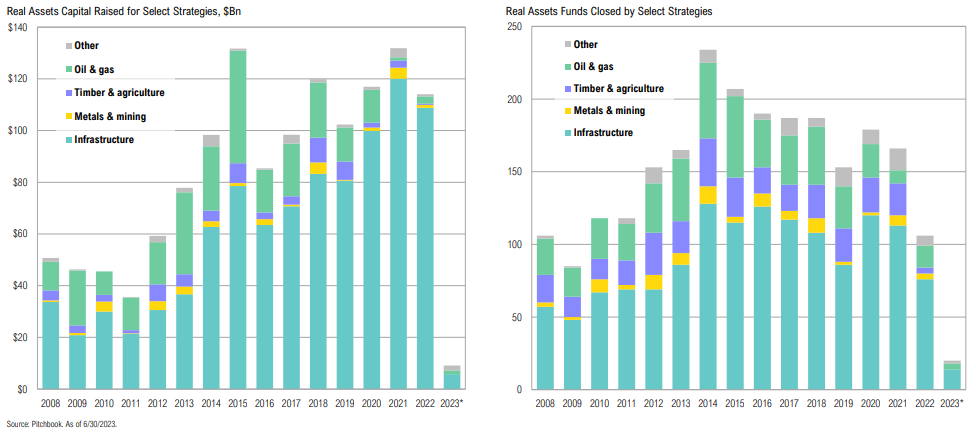
Aggregate Fundraising
Real assets fundraising has been so far off pace that it might have its worst year in 10 years
The 10 largest funds to close in Q2 2023 were almost exclusively infrastructure vehicles that largely exhibit opportunities relating to the energy transition
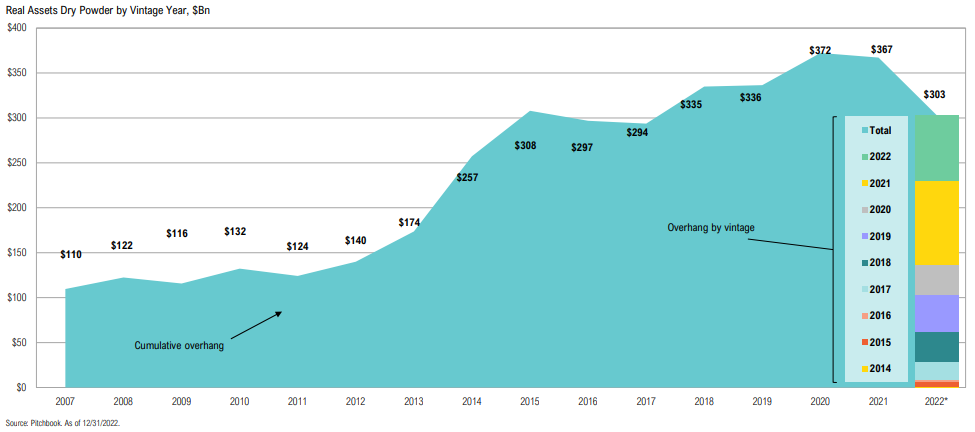
Aggregate Dry Powde
30% of real assets dry powder is from 2021 vintages
Other Private Markets
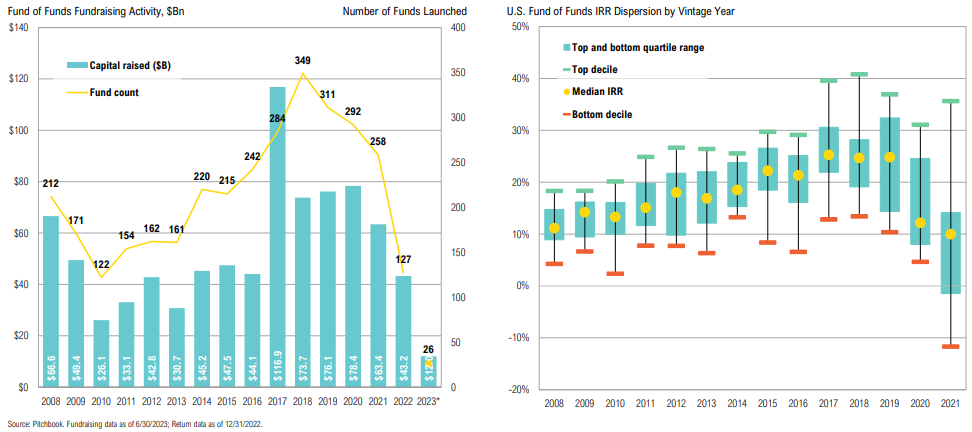
FoF: Fundraising
The drop in FoF fundraising is primarily attributable to the decline in VC FoF fundraising
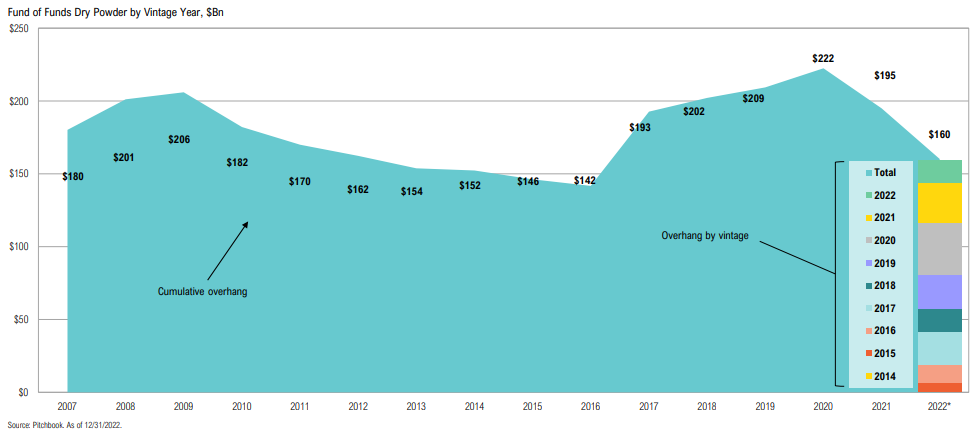
Dry Powder
Compared to history, and other private market strategies, there is minimal dry powder amongst fund of funds strategies
Secondaries: Fundraising
Through the first half of 2023, secondaries fundraising has already reached 64% of 2022’s annual fundraising total; median time to close is 19 months compared to 13.5 in 2022
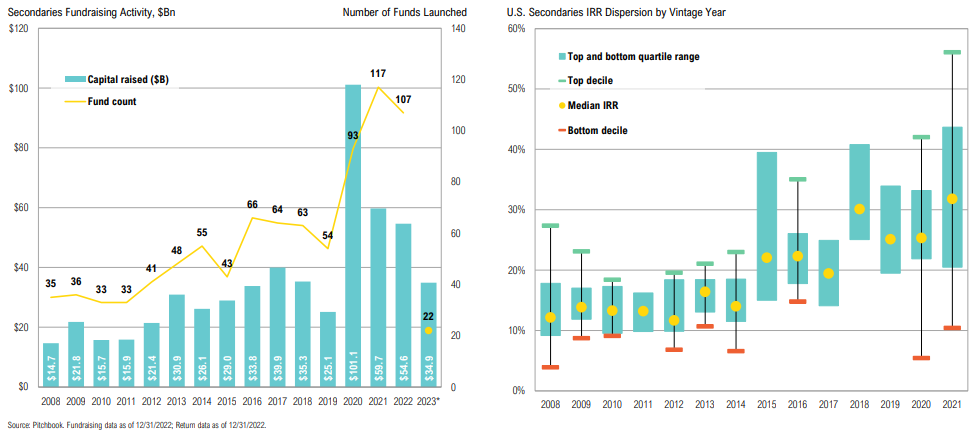
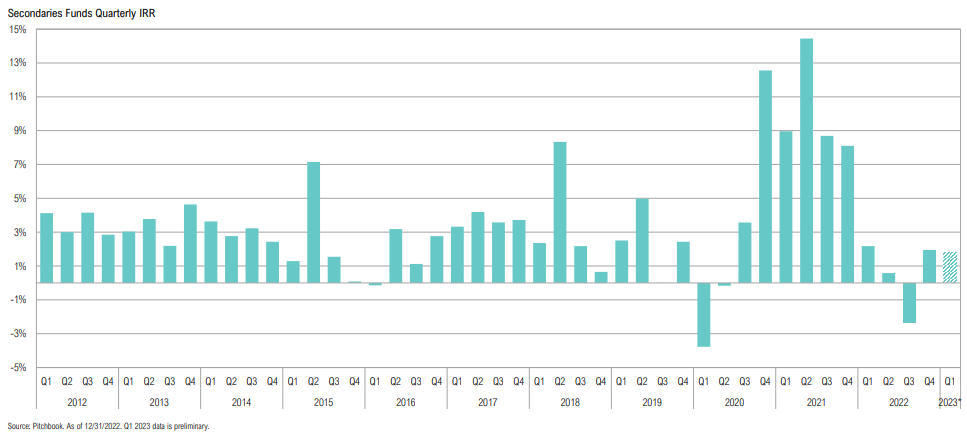
Performance
Secondaries continue to exhibit positive performance, albeit not as spectacular as 2021
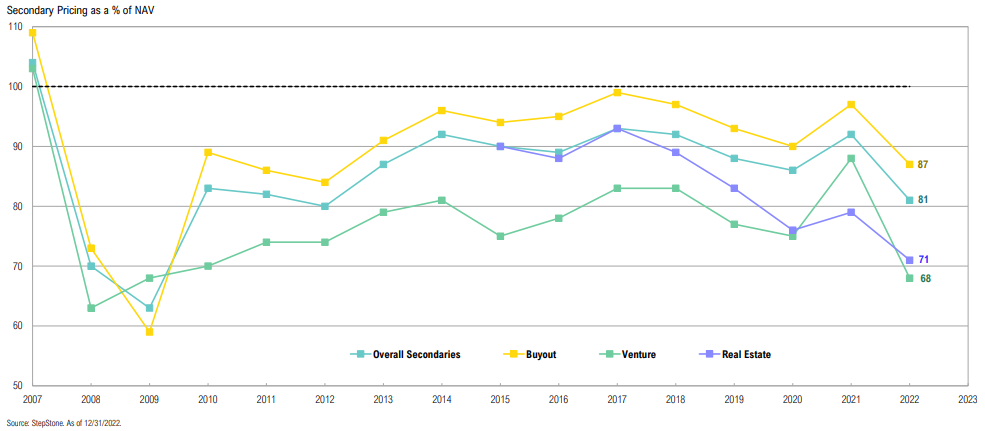
Pricing
Secondary pricing has come down substantially over the past year providing attractive entry points across asset classes
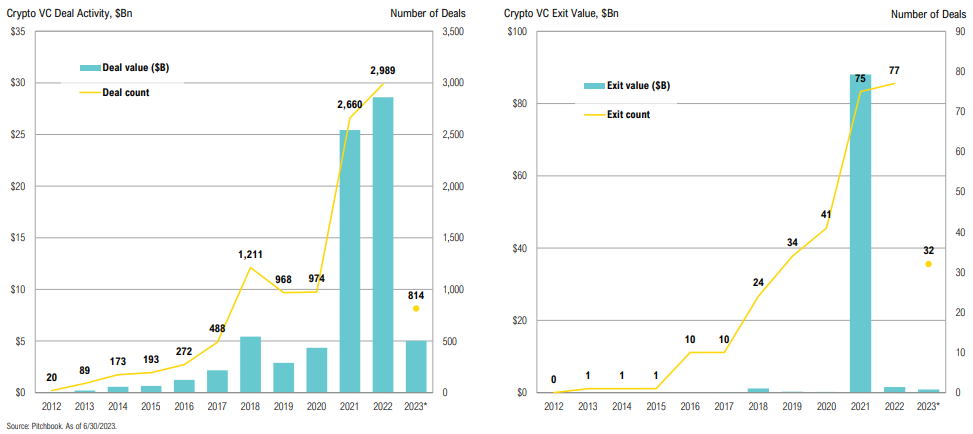
Venture Capital Crypto
In Q2 2023, deal activity and capital invested was at the lowest levels since Q4 2020
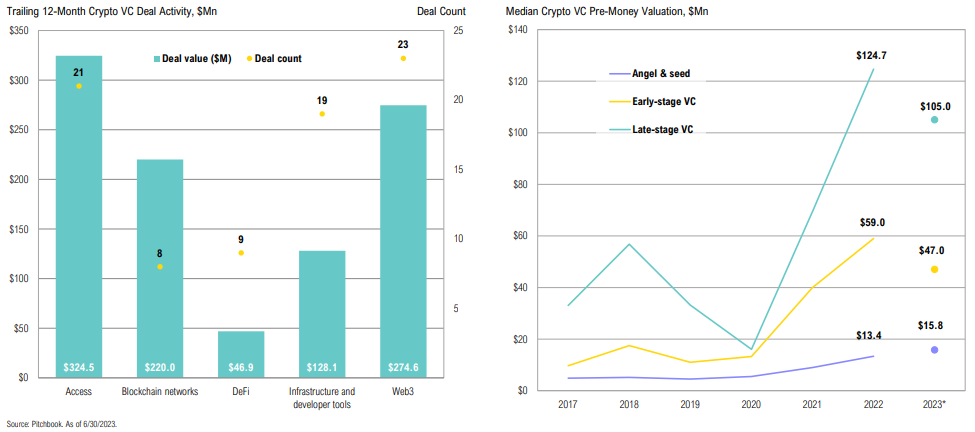
Crypto valuations have bounced back from pandemic lows; “Web3” related investments saw the highest deal count
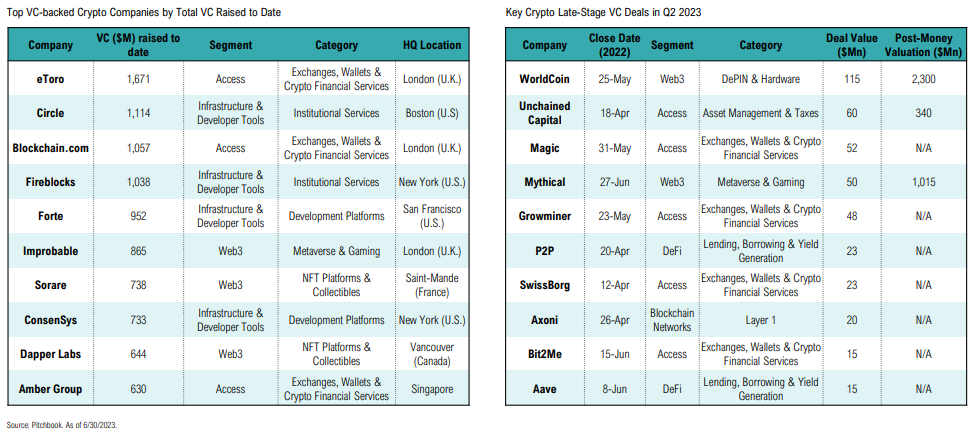
The future companies of crypto, today
Definitions
Global 60/40: Consists of 60% iShares MSCI ACWI ETF & 40% Vanguard Total World Bond ETF.
All Private Markets/ Private Capital: All private markets is an aggregation of all private funds mentioned in this report.
Buyout Private: Equity funds primarily focus on purchasing at least a controlling percentage of a company’s stock to take over its assets and operations.
Fund of Funds: Funds that take equity positions in other, newly created alternative investment funds.
Growth/Expansion: Private equity funds that make minority (non-control) equity investments.
Infrastructure: Funds that make investments in infrastructure or infrastructure-related projects.
Other Private Equity: Other private equity includes all private equity that is not specifically buyout or growth/expansion. This includes, but is not limited to: Diversified Private Equity, Mezzanine and Restructuring/Turnaround.
Private Debt: Private debt in general provide various types of debt on private equity transactions and generally includes, but is not limited to, the following: Bridge financing, Credit Trading, Direct Origination or Capital Solutions, Distressed-for-Control, Direct Lending, Distressed Debt, Infrastructure Debt, Real Estate Debt and Venture Debt.
Private Real Assets: Funds that focus on physical assets with intrinsic value due to their substance and natural resources with commodities assets. This includes, but is not limited to: Oil/Gas, Metals & Mining, Timer and Agriculture.
Private Real Estate: Private real estate funds in general are private equity funds that invest in buildings in land. This includes core, core plus, value added, opportunistic and distressed real estate.
Secondaries: Private equity funds that invest in limited partnership interest of funds that have already been raised or directly the purchase of companies from other fund managers.
Venture: Venture Capital funds that invest in new companies with high growth rates. Includes angel funds, early (seed, first, second rounds) stage and later stage (third and later rounds) venture.