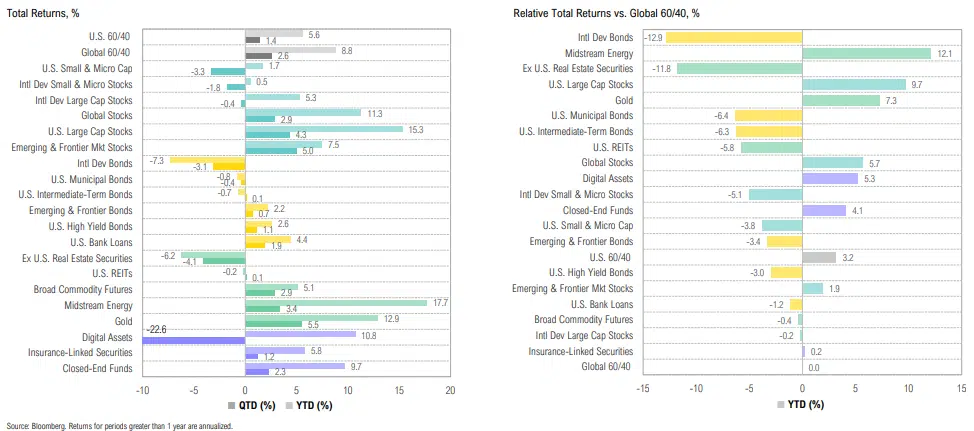
Most risky assets fared well over the second quarter, but equities’ market breadth remains narrow; interest rate-sensitive areas of the market lagged
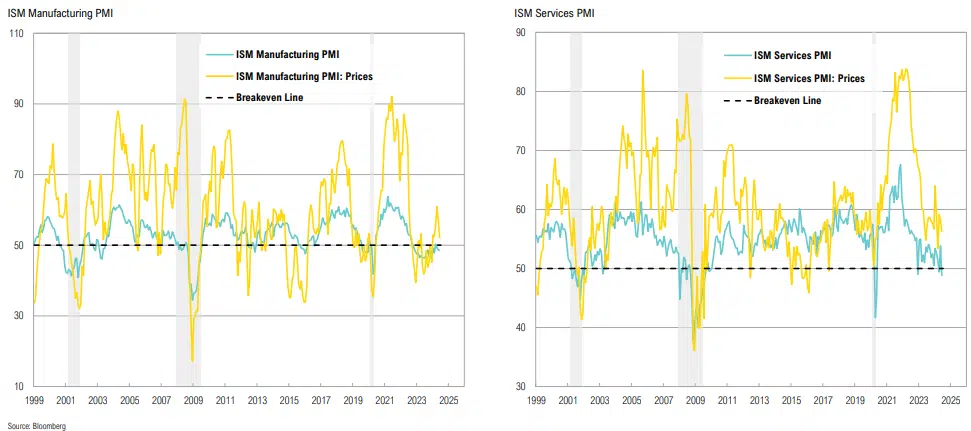
Both manufacturing and services sector activity are now in contractionary territory; ongoing high prices are weighing on both sectors’ growth, particularly in services
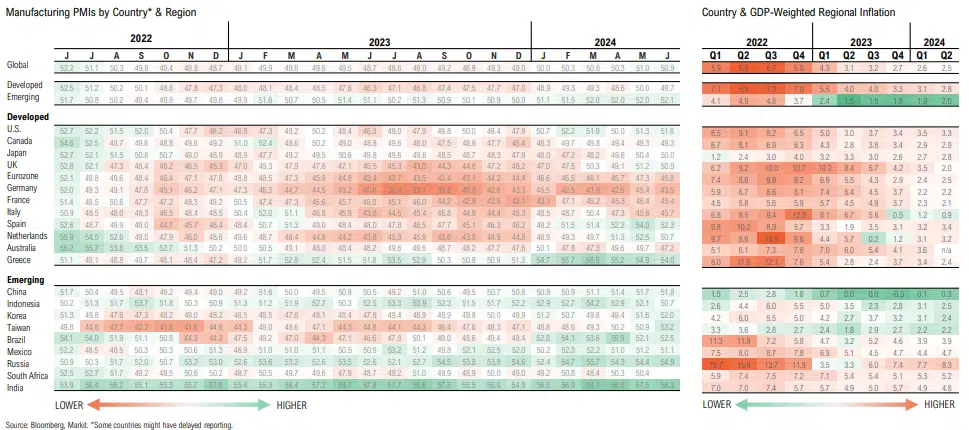
Overall, global manufacturing is expanding and inflation easing, but stark divergences between countries with the U.S. and select emerging markets faring much better than developed Europe
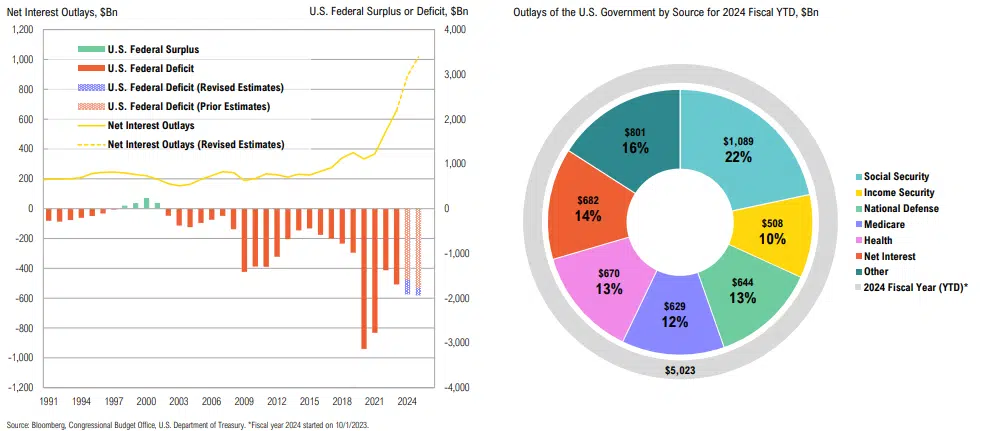
Government spending continues unchecked: the fiscal budget deficit for this year is already at $1.27Tn, and the CBO has revised deficit estimates upwards for 2024 and 2025
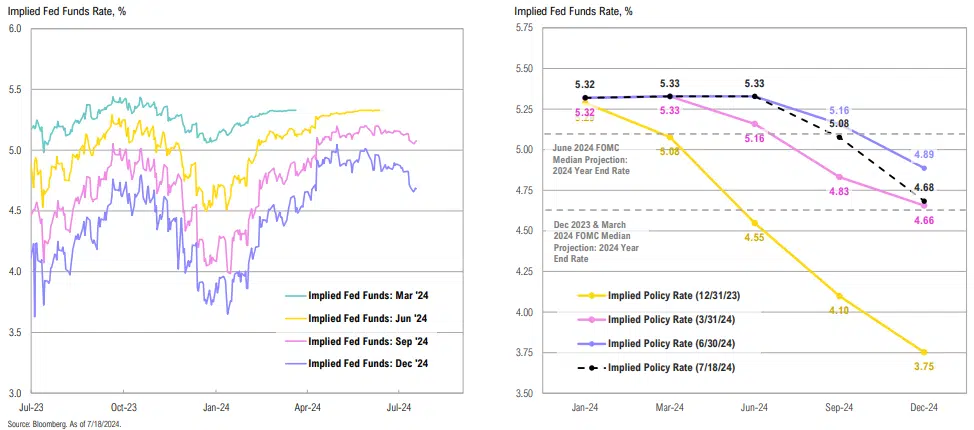
Following the June CPI report, rate cut expectations reverted to March levels; markets now expect the equivalent of three cuts for 2H 2024, with the first cut anticipated in September
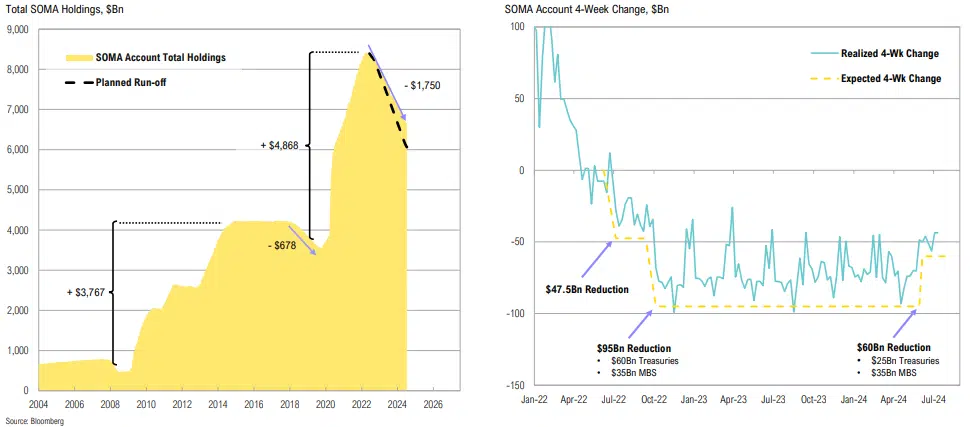
Despite inflation still above target, the Fed slowed the pace of QT on June 1; the balance sheet has been reduced by only 1/3 of what was added during COVID and lags its planned runoff by >$450bn
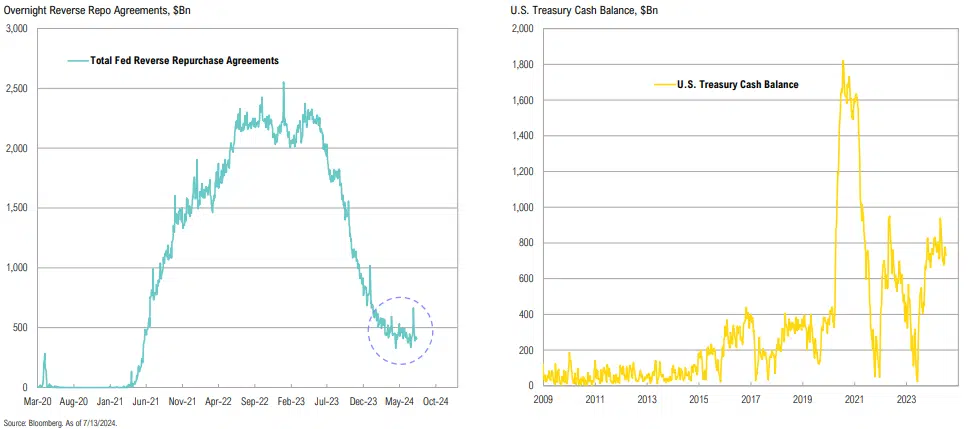
The Fed’s reverse repo facility (which has dampened the effects of QT), has stabilized at ~$400bn; Treasury cash balance is currently at $730bn and is expected to build to $850bn by September
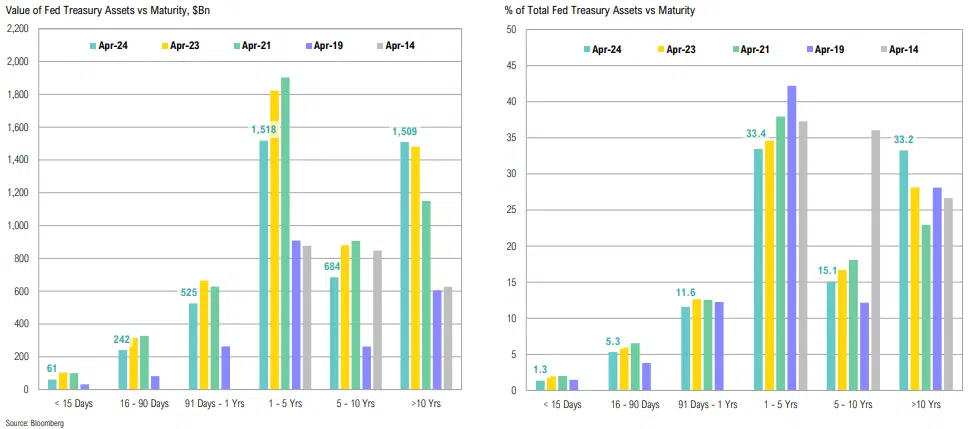
~18% ($800bn) of the Fed’s balance sheet assets are maturing within the next year—enough to hit the $25bn monthly roll-off target; this implies the Fed will purchase ~$500bn in Treasuries
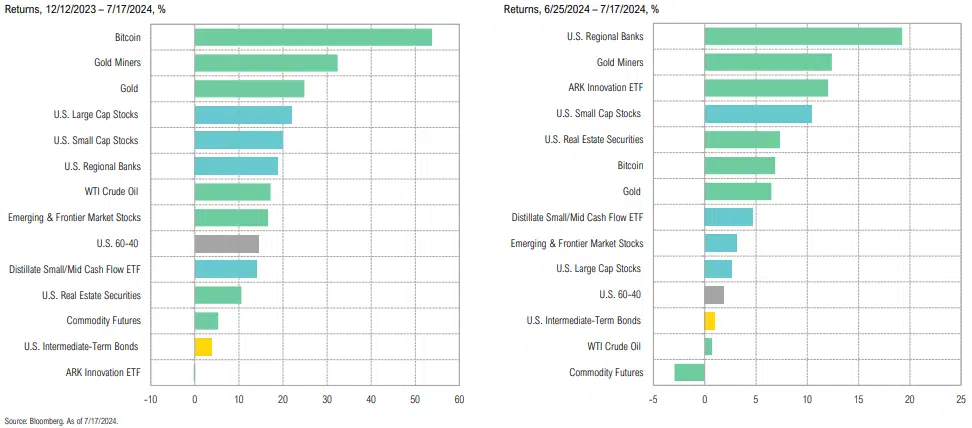
The market reaction since the December FOMC meeting is consistent with the Fed raising their inflation target; performance has recently started to broaden out
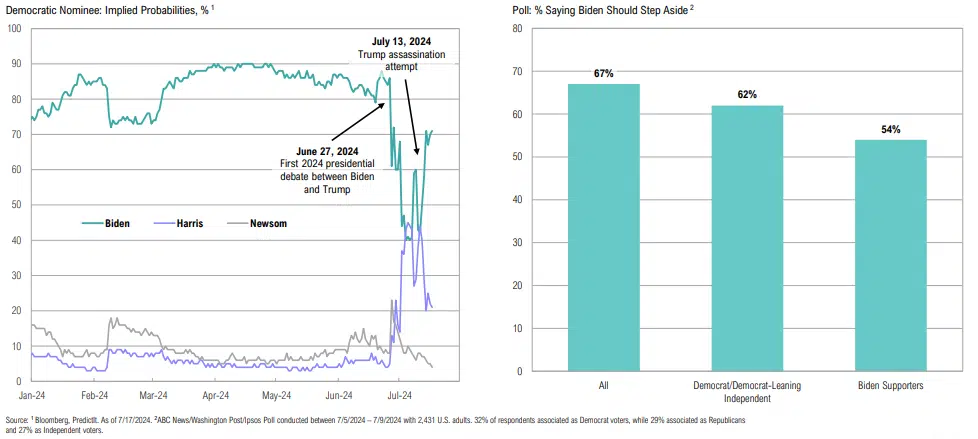
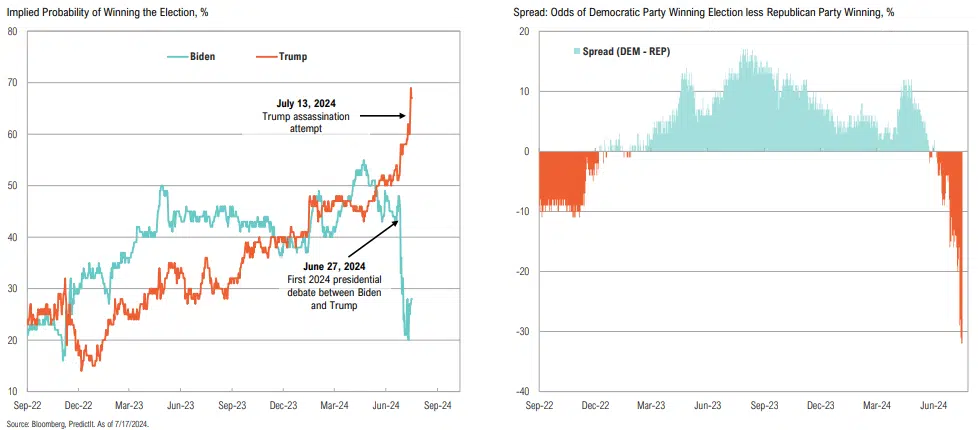
Trump’s probability of winning jumped post-debate and even more post-assassination attempt, with betting markets now clearly favoring a Republican win in November
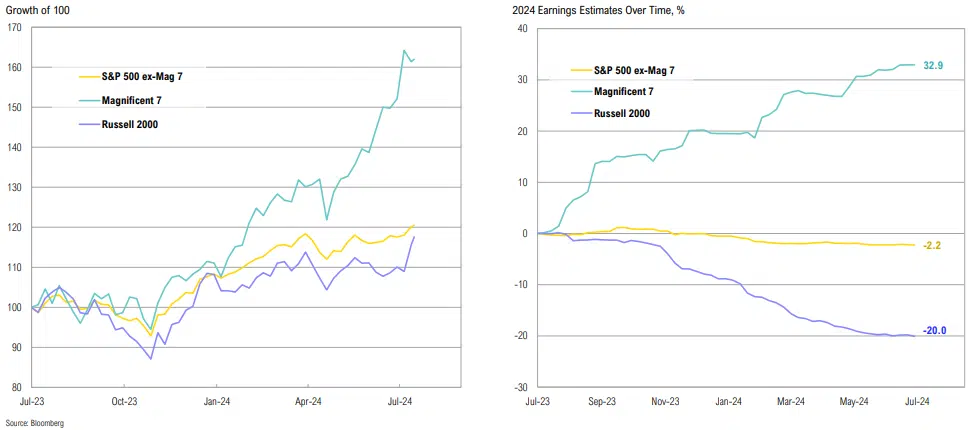
The outperformance of the Magnificent 7 over the S&P 500 and Russell 2000 in the past year has been somewhat justified by strong earnings revisions; will this continue?
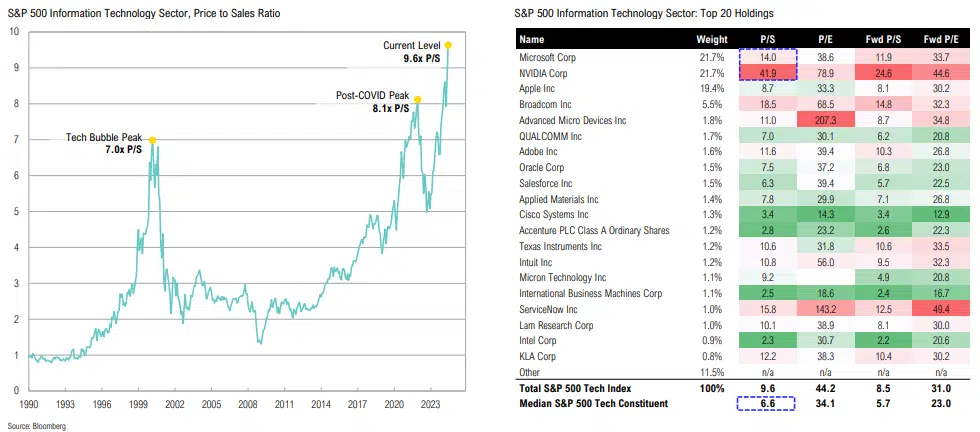
The tech sector P/S ratio is currently 40% higher than peak Tech Bubble levels: NVDA (41.9x P/S) and MSFT(14.0x P/S) together account for >40% of the sector; the median tech stock trades at a 6.6x P/S
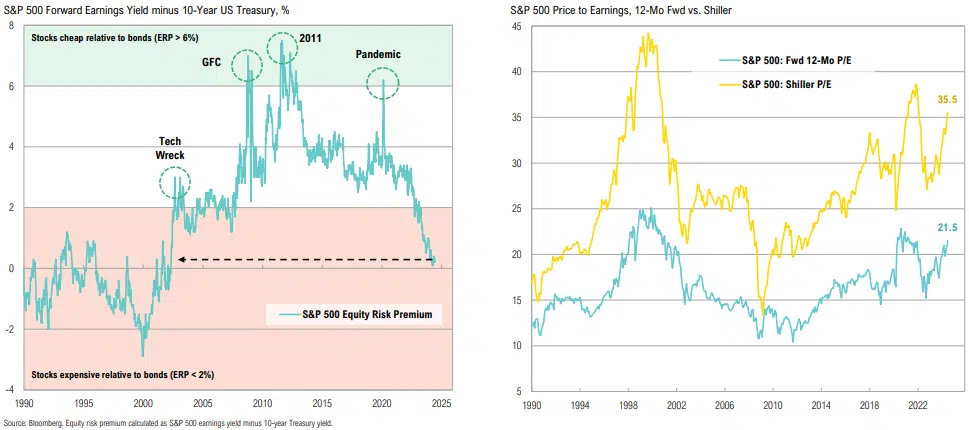
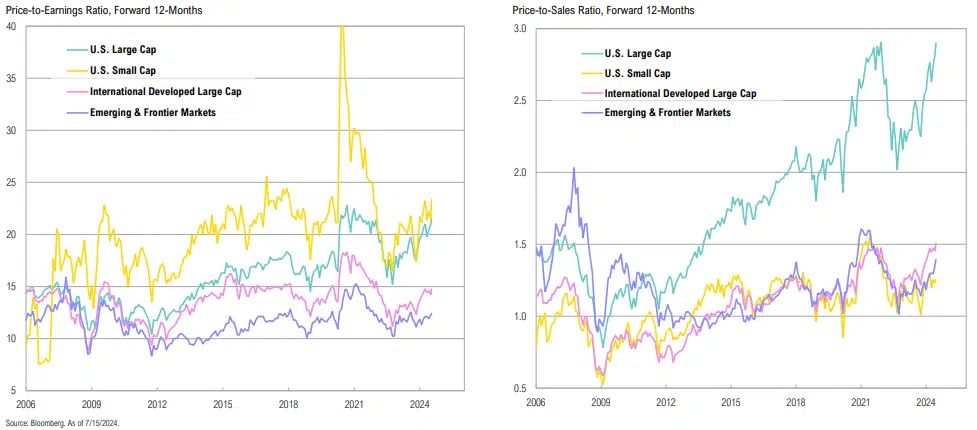
Using a yield-to-earnings yield comparison (ERP), U.S. stocks are less attractively priced vis-à-vis bonds than at any point since the 1990s; valuations appear rich from both a Shiller and forward P/E perspective
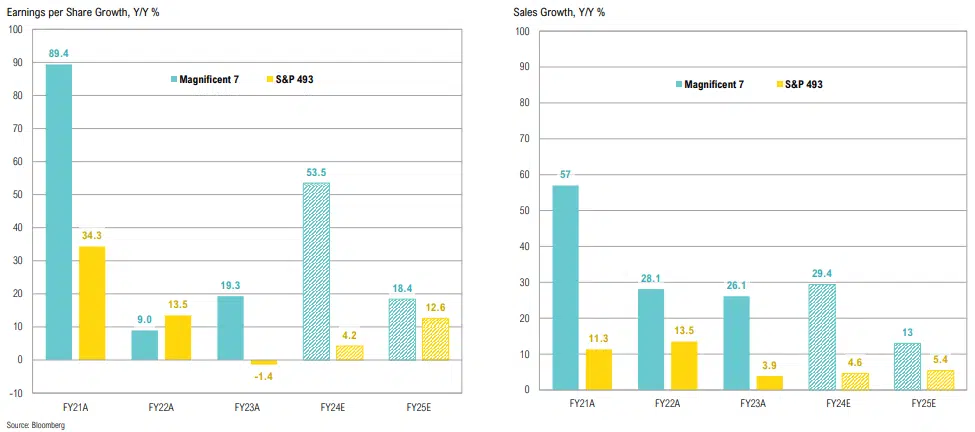
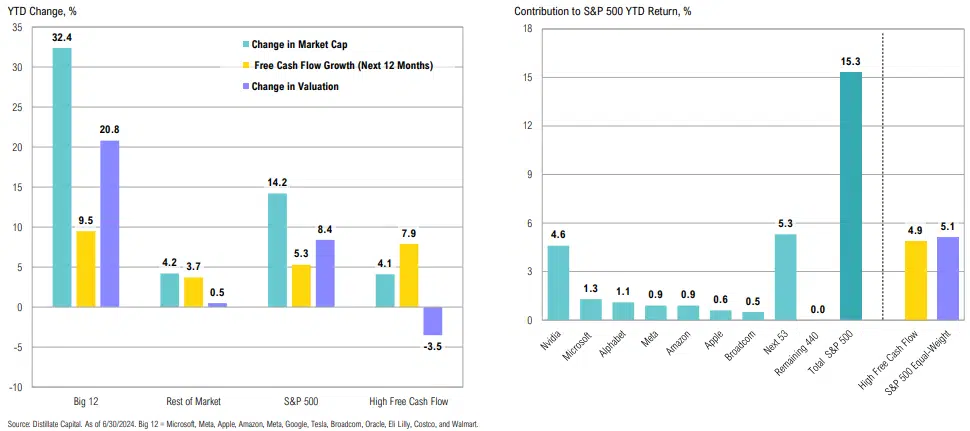
Is market narrowness at least partially justified by earnings growth trends? FY 2024 Mag 7 earnings are expected to grow by 53.5%, while S&P 493 earnings are expected to grow by 4.2%
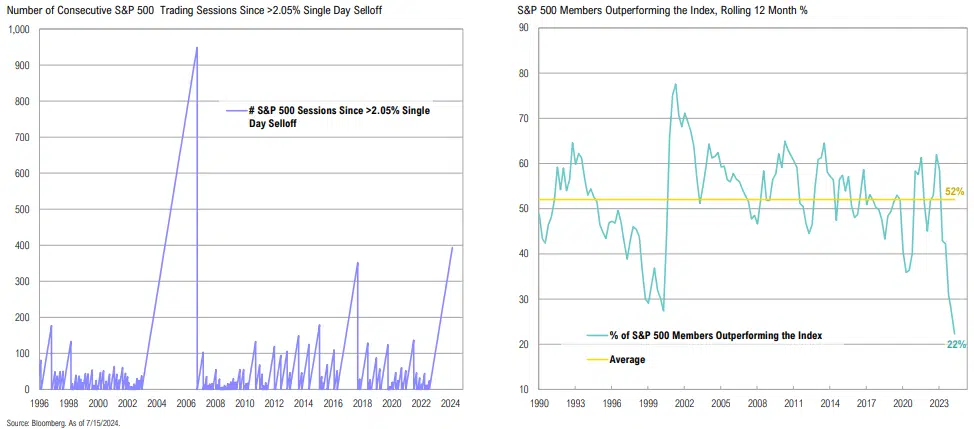
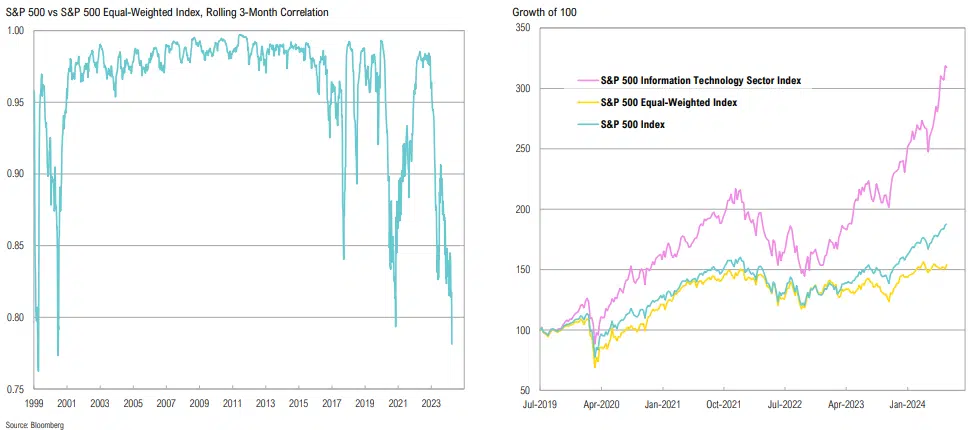
The market has rewarded a small subset of stocks while ignoring the rest, resulting in asymmetrical risk/reward for mega cap tech vs. other parts of the market
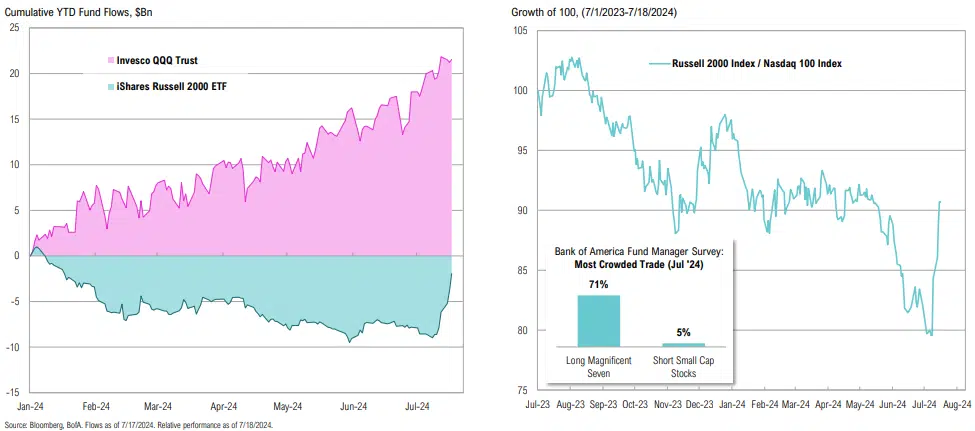
Is the recent move in all U.S. small cap stocks sustainable, or is it a forced unwind of extreme positioning that should be faded? We think a bit of both
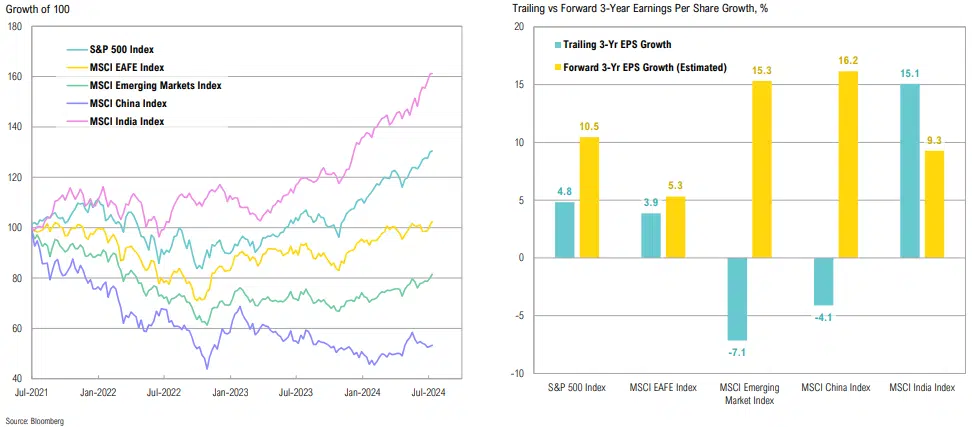
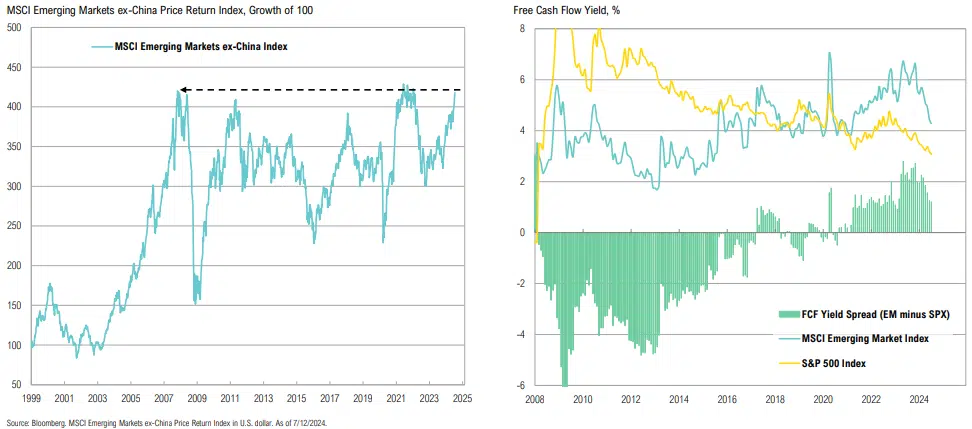
Bolstered by earnings growth, the U.S. and India have outperformed; looking ahead, earnings growth for broader emerging markets and China look promising
EM ex-China stocks are nearing a 16-year breakout; EM stocks look cheap compared to U.S. large-cap stocks, with free cash flow yields 1.2% higher than those of the S&P 500
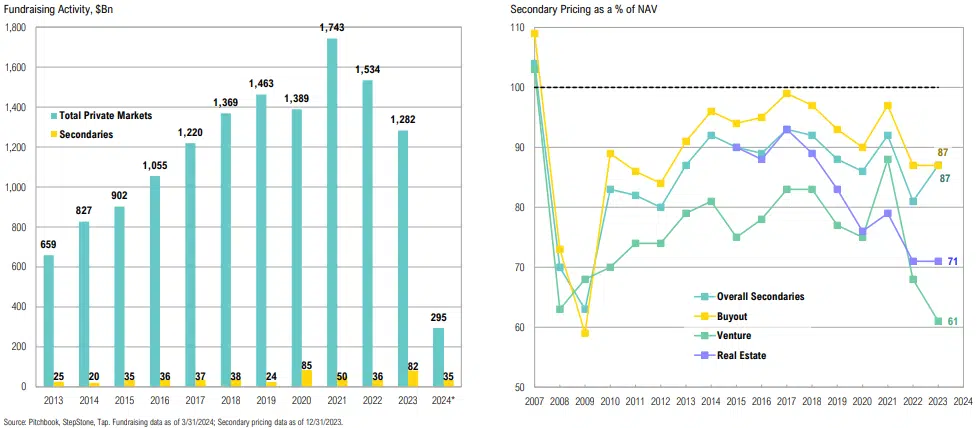
Secondaries fundraising is on pace for its largest year ever, but is only 11% of all private market fundraising in Q1
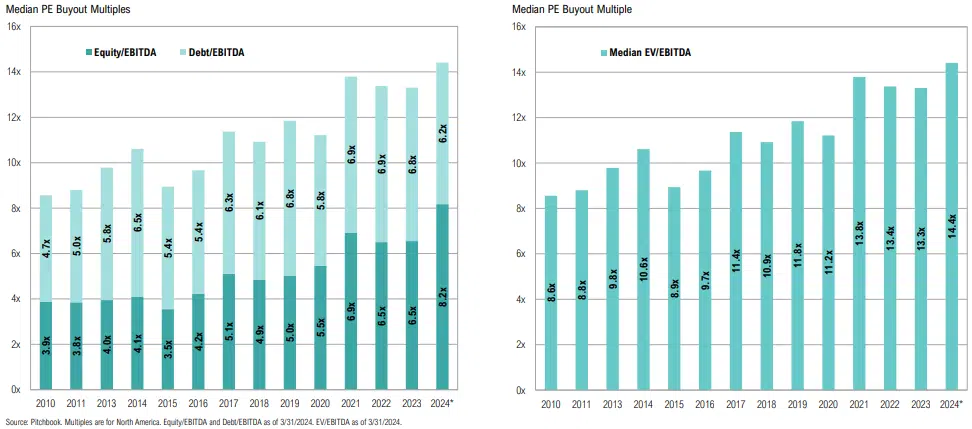
PE Buyout multiples continue to creep higher; elevated interest rates and looser covenants are deterring debt investors, causing equity share in new deals to climb above 50% for the first time ever
The outperformance of the Magnificent 7 over the S&P 500 and Russell 2000 in the past year has been somewhat justified by strong earnings revisions; will this continue?
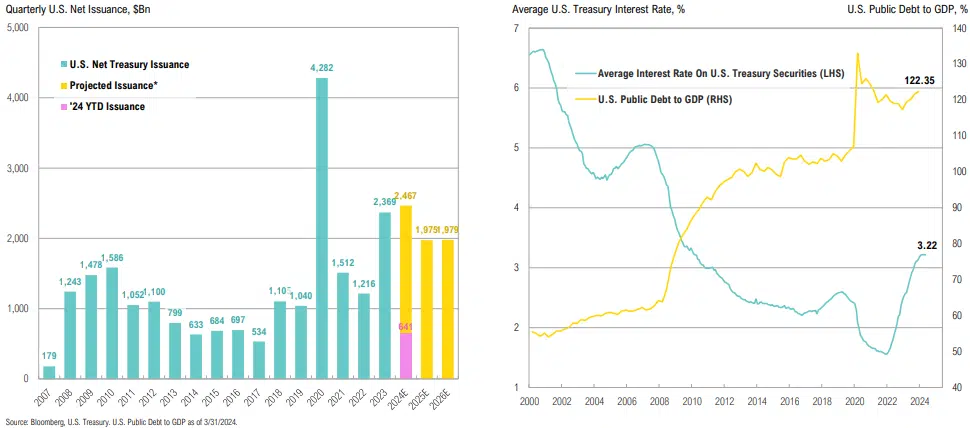
2024 Treasury issuance is on track to surpass 2023 to become the highest after 2020, and the highest in a non-crisis year; the average cost of U.S. government debt continues to rise, now >3.2%
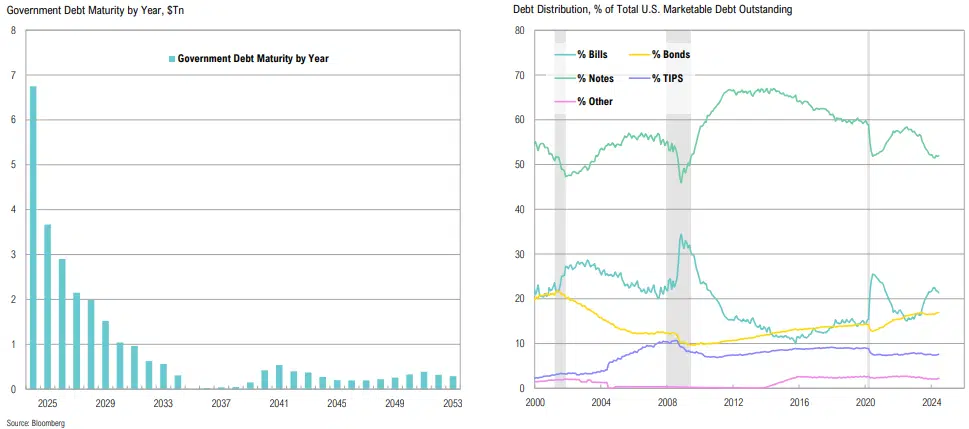
Over $8Tn in government debt is set to mature this year, and will be rolled at much higher rates; bill issuance has marginally declined, from 22.5% to 21.3% of total debt over the past quarter
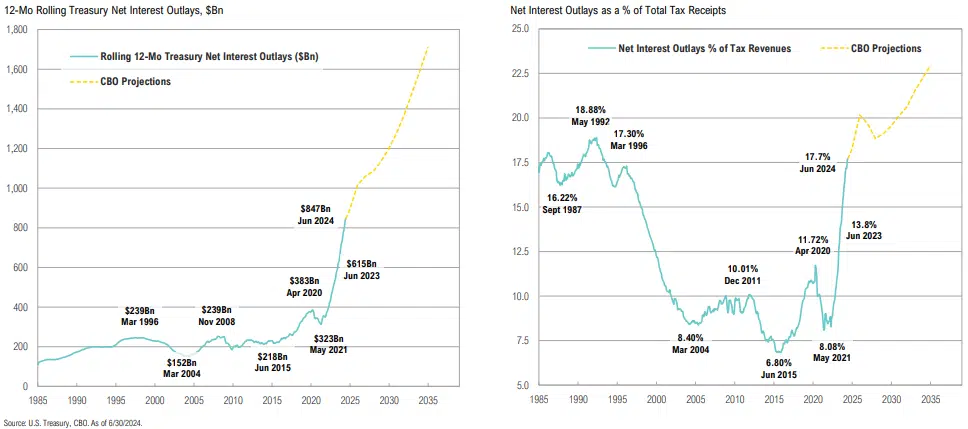
12-month Treasury net interest outlays rose over 37% to $847bn over the past year; tax receipts aren’t keeping pace, with nearly 18% of taxes going only to net interest payments
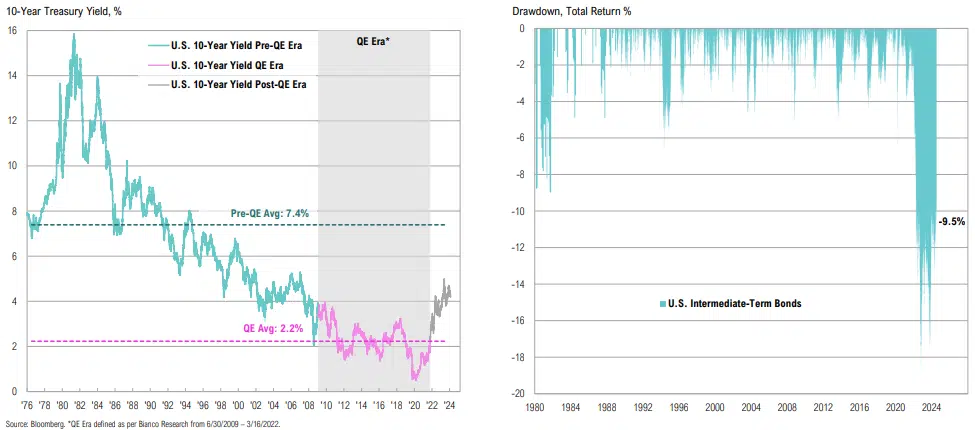
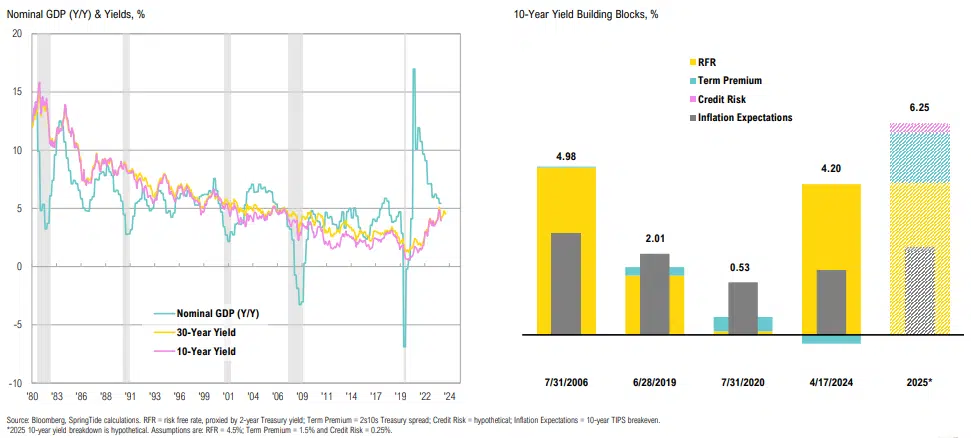
The fiscal balancing act: Historically, long-term yields tend to follow GDP, but what will happen in 2024 depends largely on policy
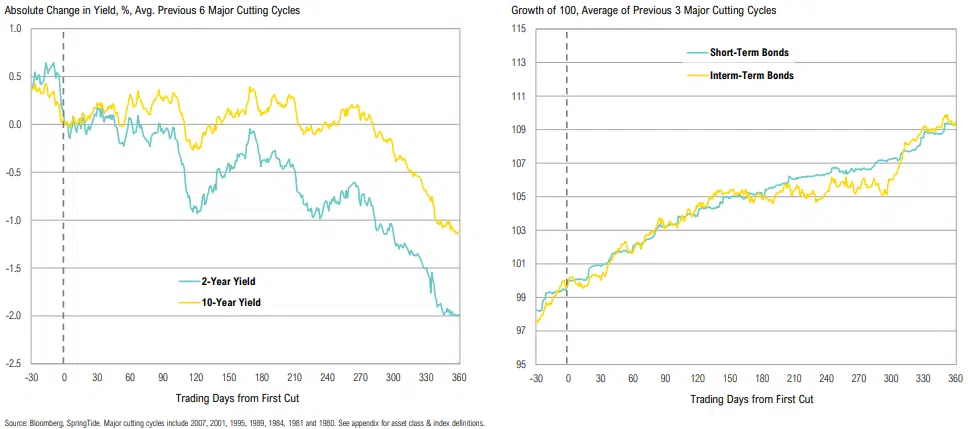
During cutting cycles, the shorter end of the yield curve responds more aggressively than the longer end; underweight duration is a good place to be
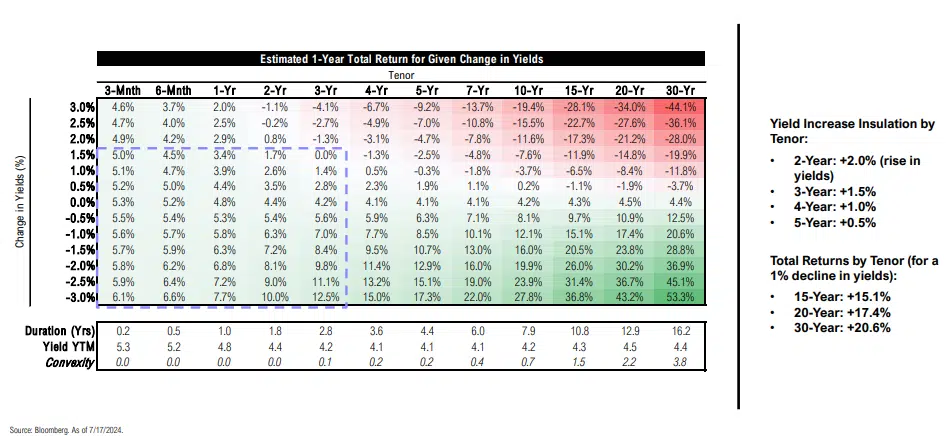
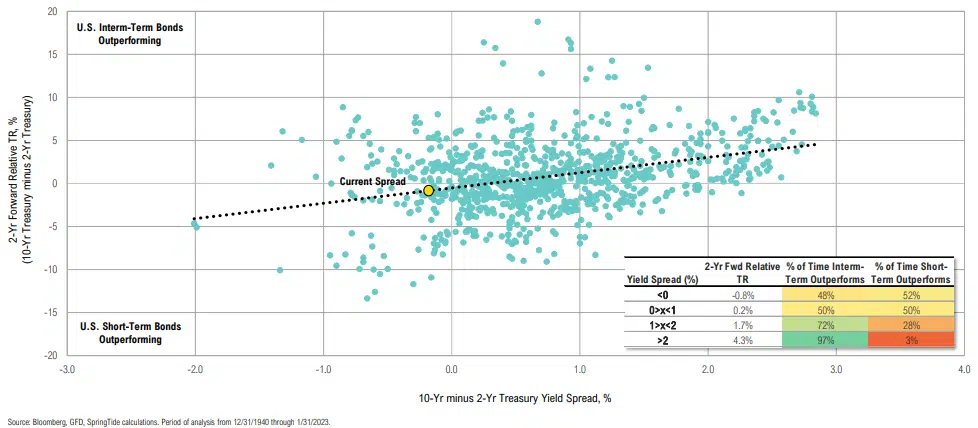
The 2–3-year part of yield curve has an attractive risk-reward profile—yields could rise 1.5% in the next year and total returns would still be positive
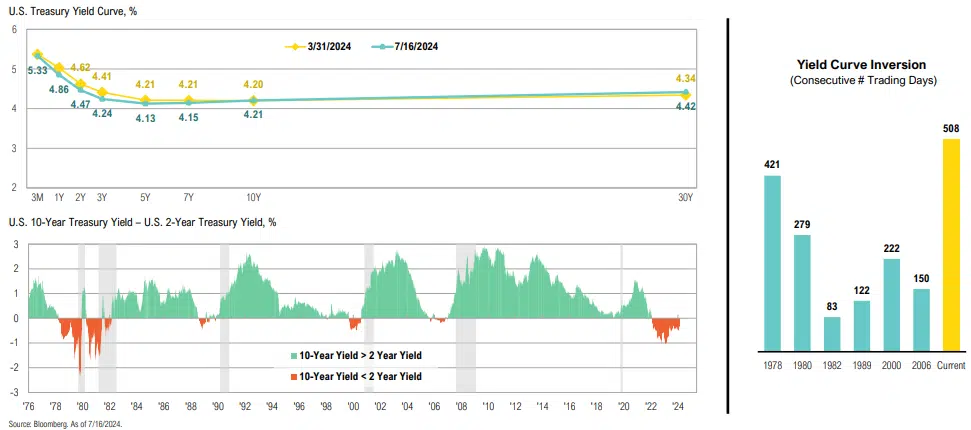
The yield curve remained relatively unchanged over the quarter; it has now been more than 2 years since the yield curve inverted and remains inverted at -26bps
When the 2s10s spread is above 2%, investors should generally hold longer duration bonds; when it is between 1% and 2%, it is not a home run; and below 1% is a coin toss
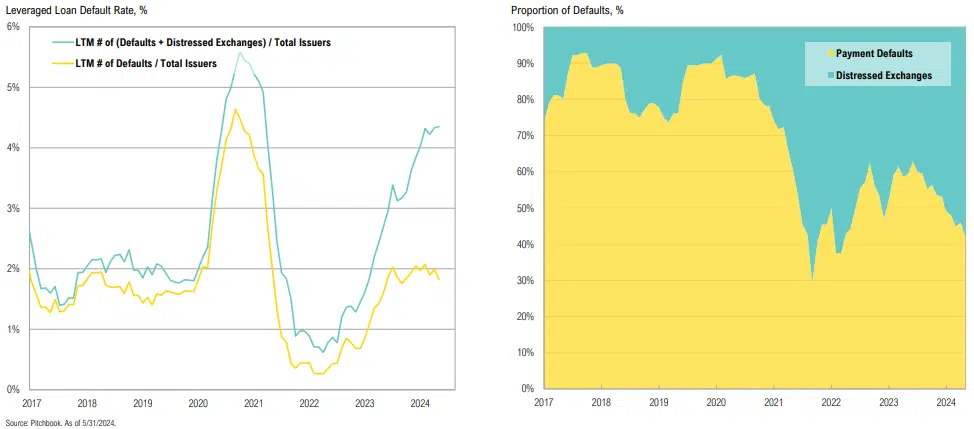
Distressed exchanges are replacing traditional defaults, masking issues
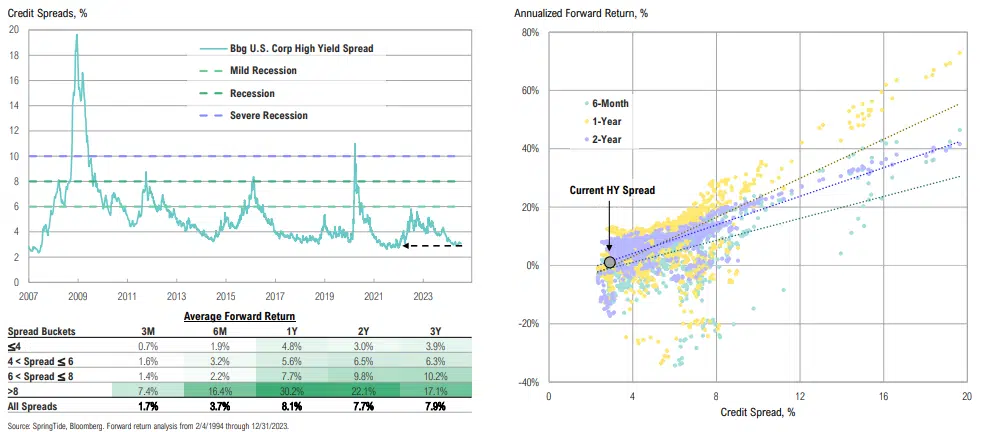
Not attractive: at ~307bps, credit spreads are in line with pre-COVID lows and even nearing 2021 levels; low credit spreads continue to suggest runway for the economy (i.e., a ‘soft landing’)
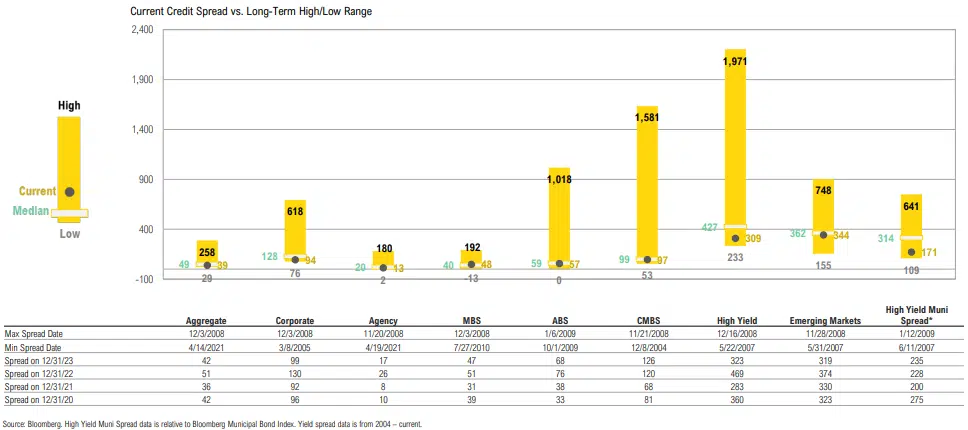
Credit spreads are near or below median across most sectors; high-yield bond spreads at current levels suggest that the economy may achieve a ‘soft landing’
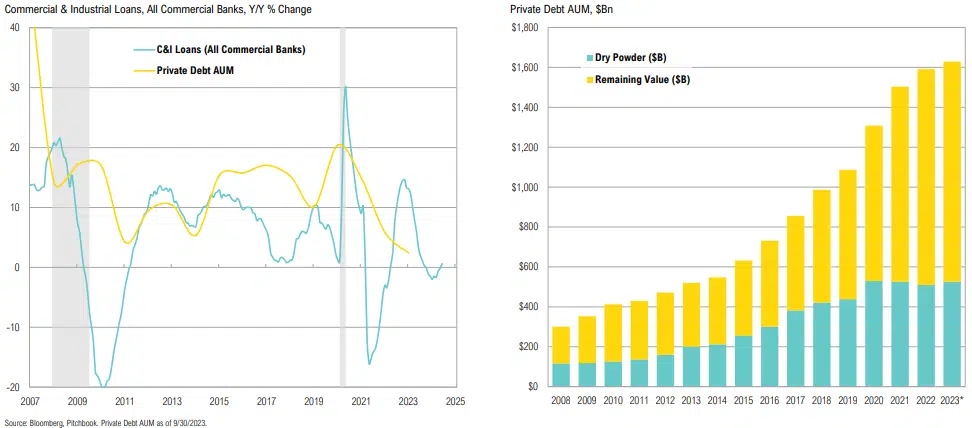
Private credit continues to grow, and is helping to fill the void left by declining commercial bank lending
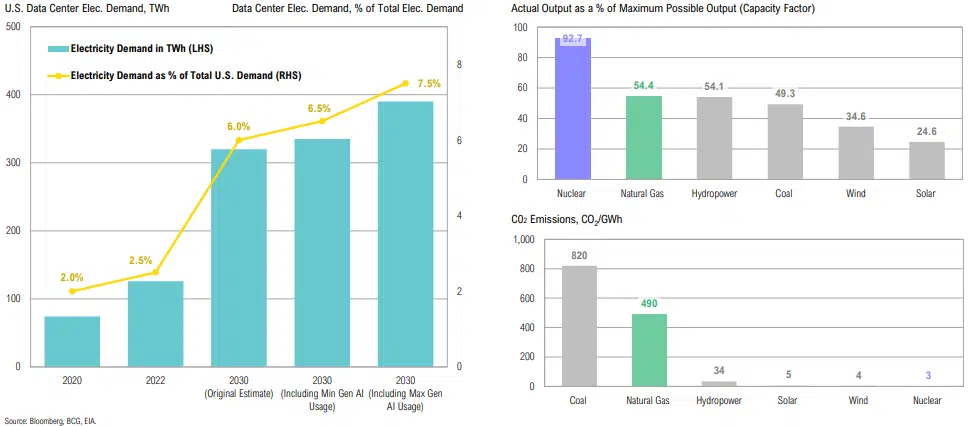
AI and data centers are expected to be key drivers of future U.S. power demand; given consistent output requirements for data centers, natural gas and nuclear are the best energy sources to meet demand
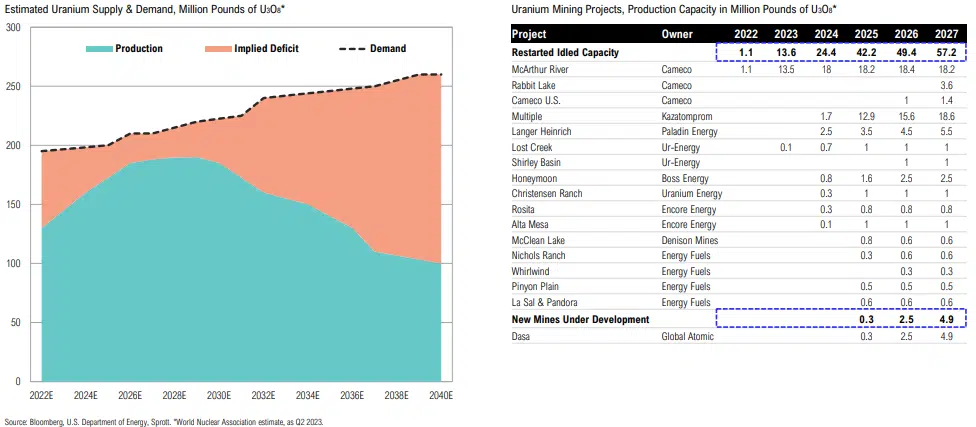
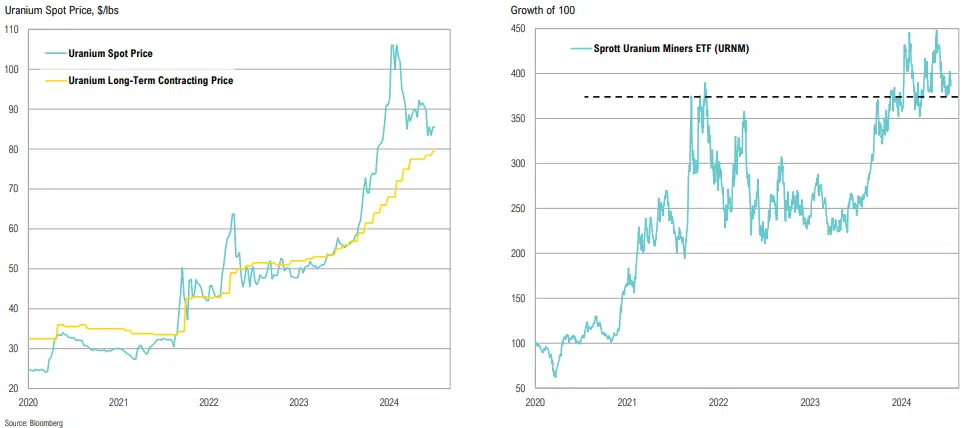
Spot uranium prices have pulled back since peaking in February, but long-term contracting prices (the prices negotiated between utilities and miners) continue to move higher; uranium miners are trading at/near key technical support levels
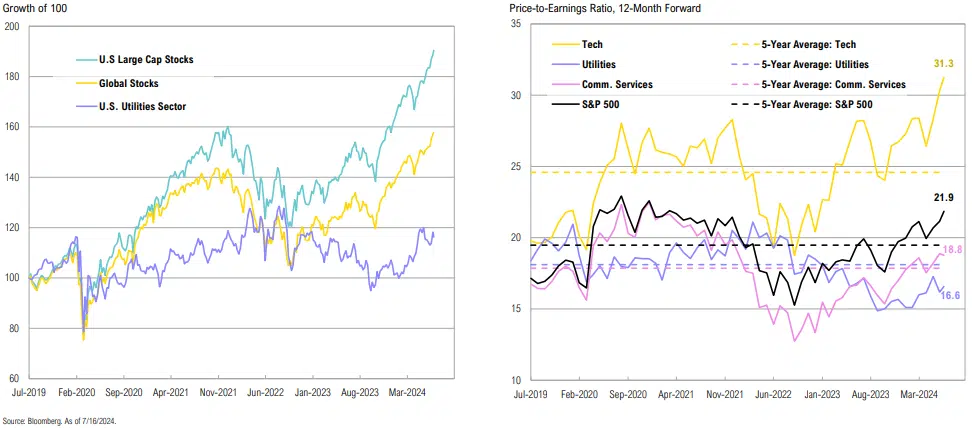
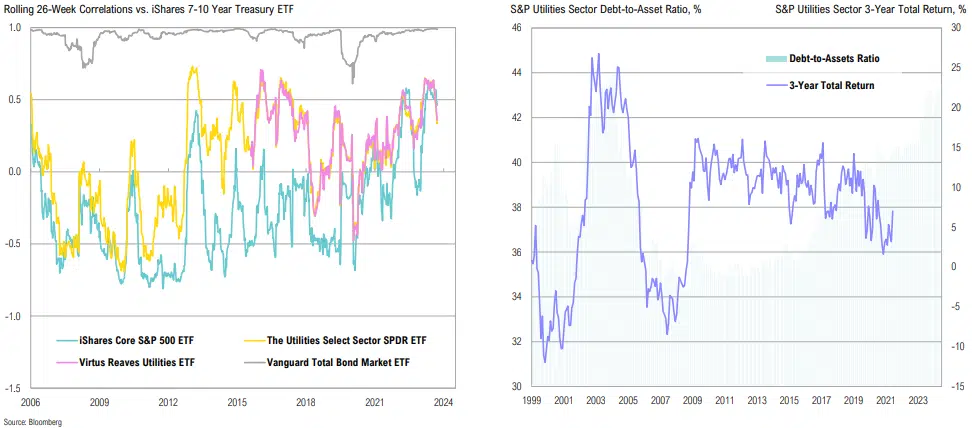
Utilities are now less correlated to bonds than the S&P 500, likely as markets realize their role in meeting future power demand; recent rising leverage is manageable as interest costs can be passed to customers
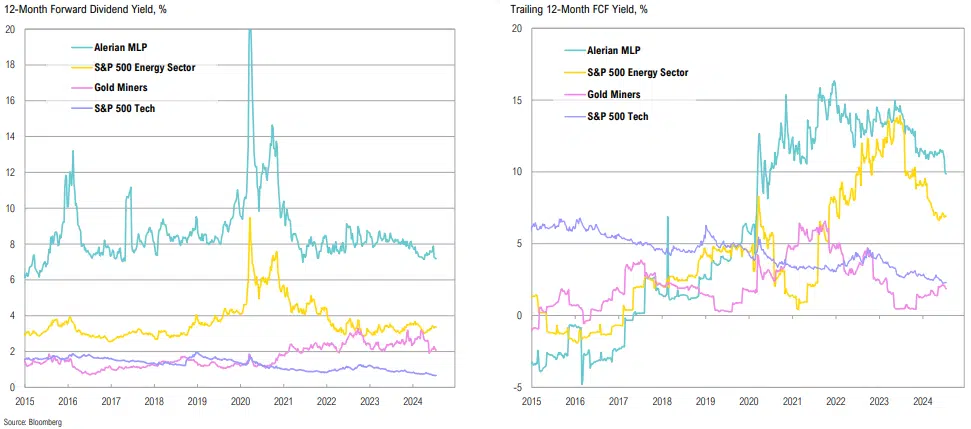
Midstream energy’s yield premium has narrowed but remains attractive, supported by ongoing distribution increases; trailing free cash flow yields of the energy sector have declined
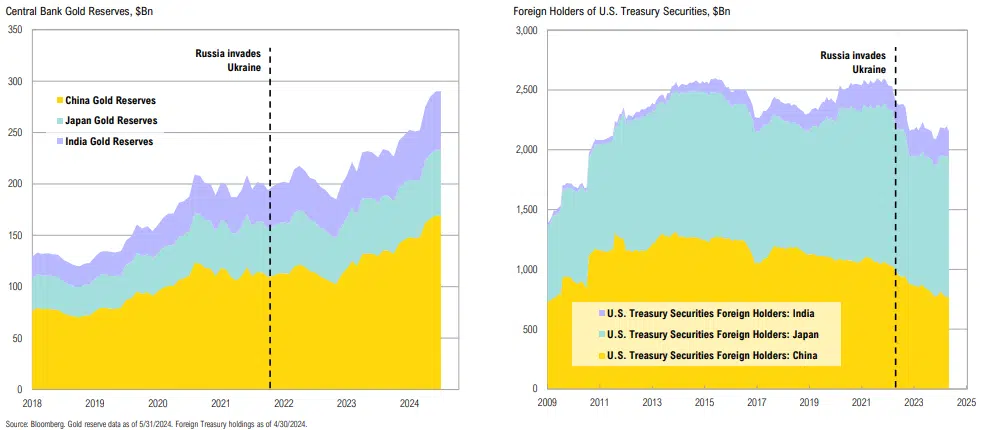
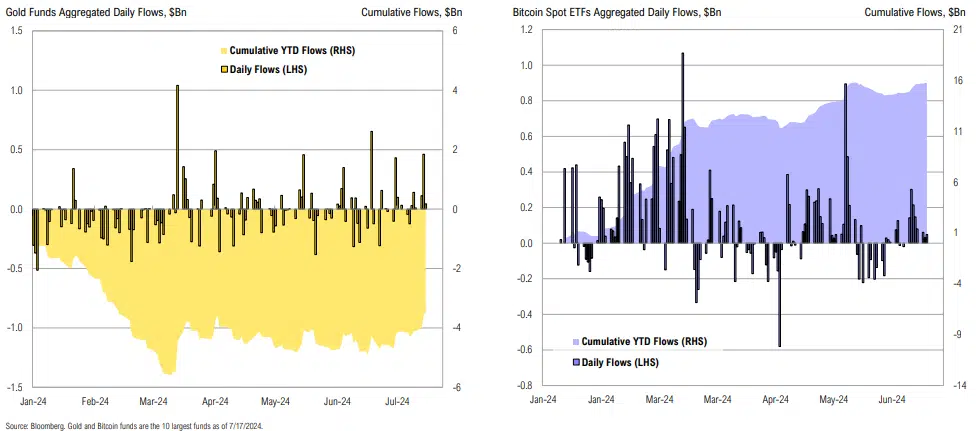
Accompanied by ‘flight to safety’ (geopolitics, U.S. fiscal situation), gold’s resilience despite rising real rates is likely due to sovereigns favoring gold, even with China pausing buying in May; whatever the reason, higher real rates remain a risk
U.S. fund flows make a compelling case that bitcoin has been cannibalizing demand for precious metals, but we still think gold has a role
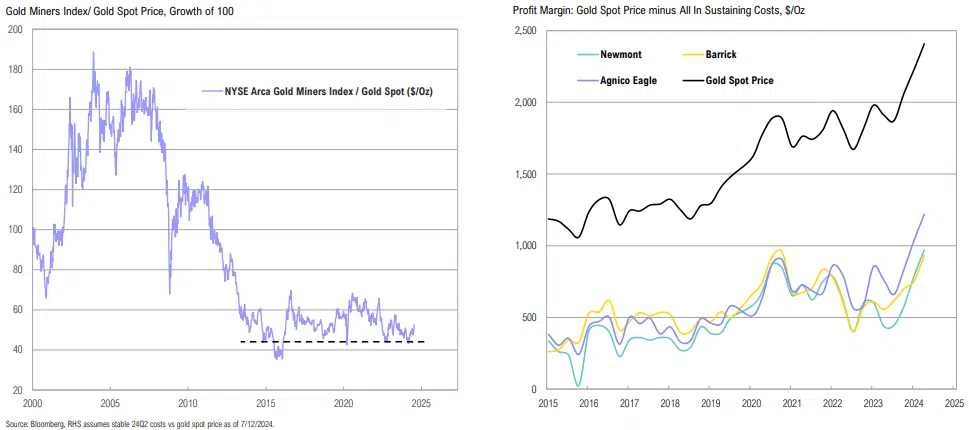
On the surface, gold miners look attractive vs. physical, but miners have been plagued by rising costs, country-specific issues, and labor challenges, among other things
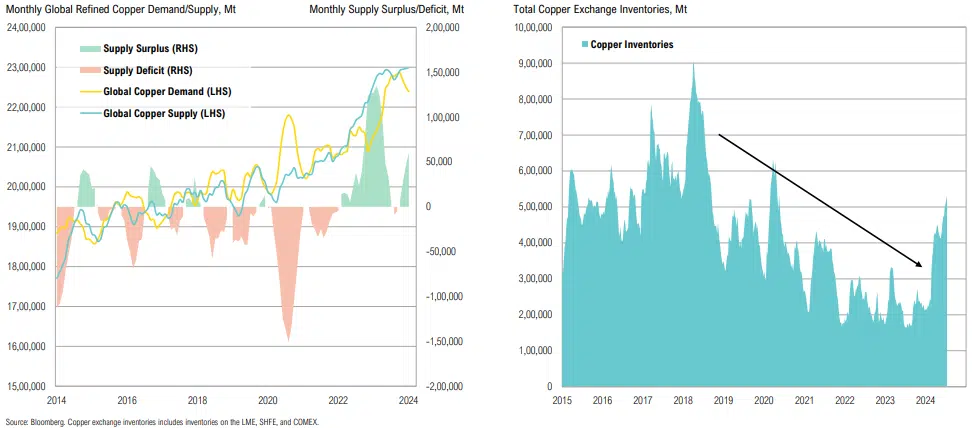
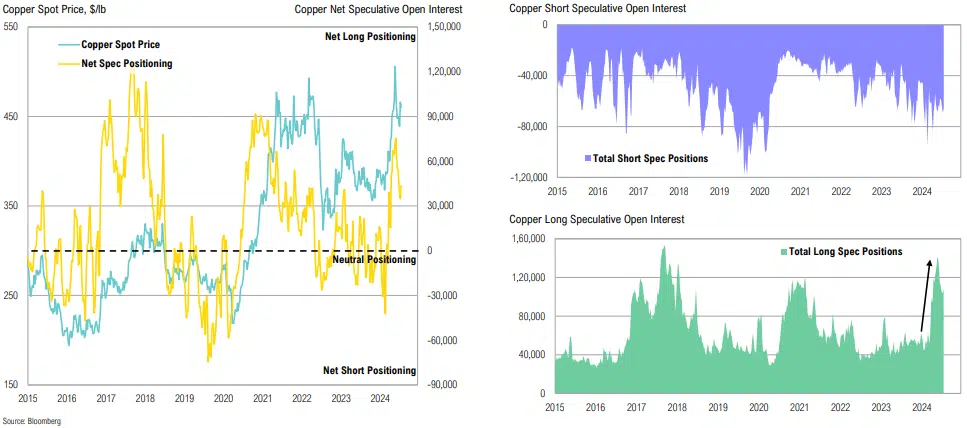
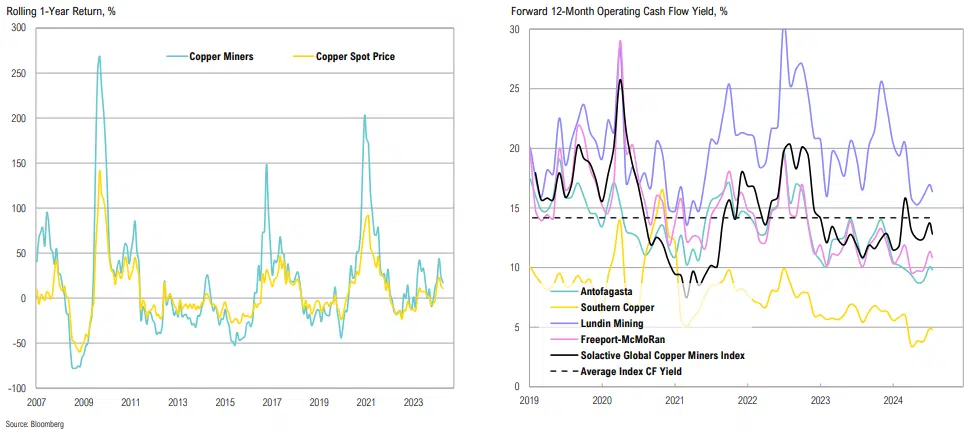
Copper markets have recently been driven by speculative demand rather than market fundamentals; spot prices rallied 38% from February to May but have since consolidated as fast money exits the market
Copper miners are highly sensitive to spot prices, making them appealing during copper bull markets; most miners are trading at a premium relative to their historical cash flow yields with valuations reflecting optimism
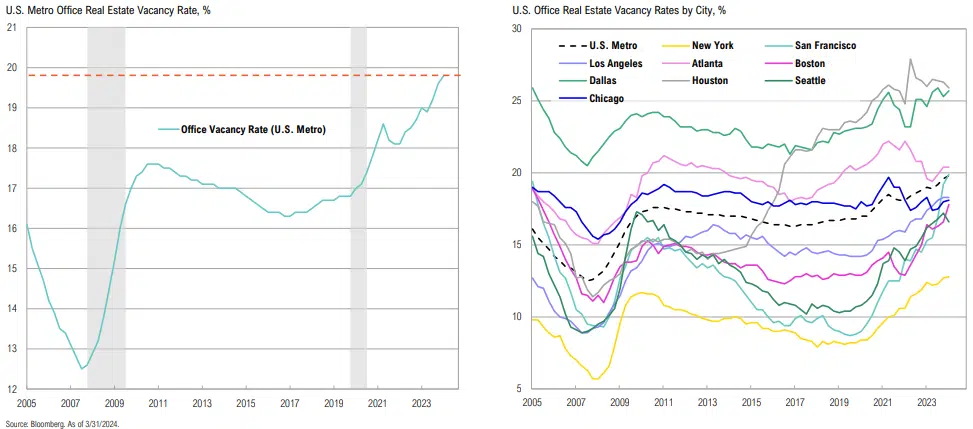
U.S. metro office vacancy rates are nearing 20%, far surpassing the GFC peak of 17.6%, vacancies in Boston, San Francisco, New York and Dallas continue to climb
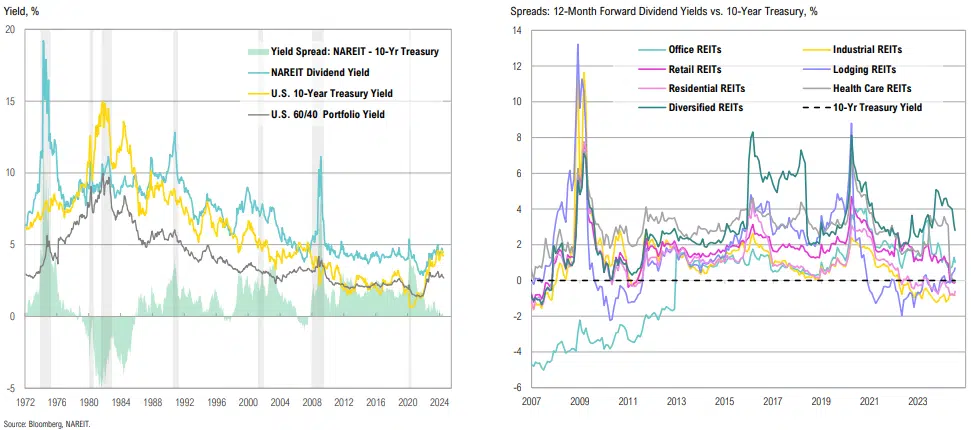
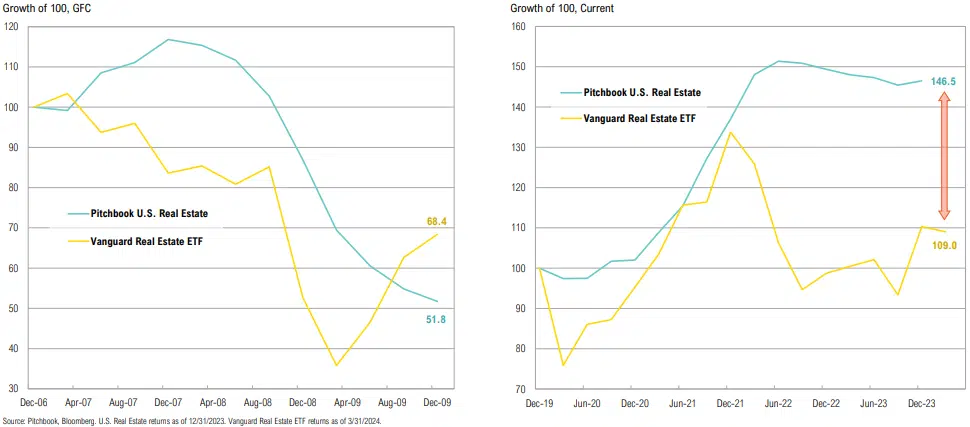
U.S. REITs rebounded 13% from their April lows as lower yields provided a reprieve for the asset class, despite the rebound, REITs still look wholly unattractive on a relative yield basis
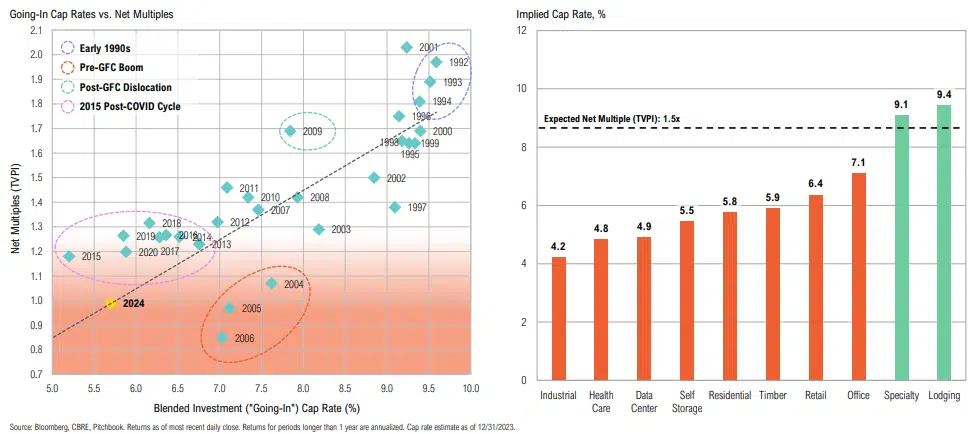
Implied cap rates are not attractive after the Q4 REIT rally, but the opportunity set is improving from a valuation perspective
Private real estate funds have not yet marked down properties, despite public markets struggling for more than 2 years
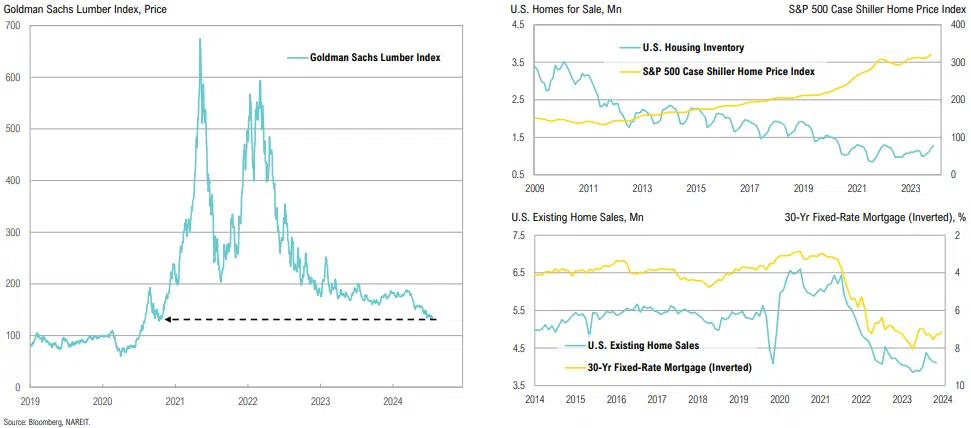
Lumber prices are back at October 2020 lows while residential home prices continue to climb and inventories remain subdued; home sales are declining, while mortgage rates remain above 7%
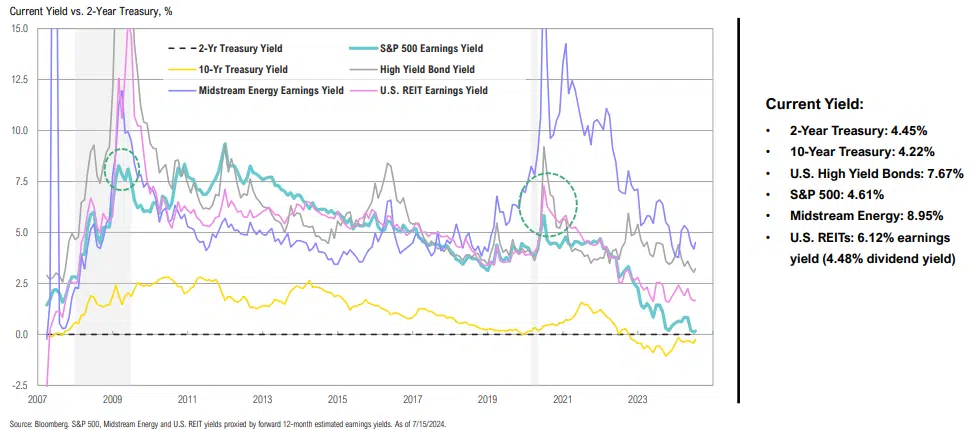
Most asset classes look unattractive relative to the 2-year Treasury yield
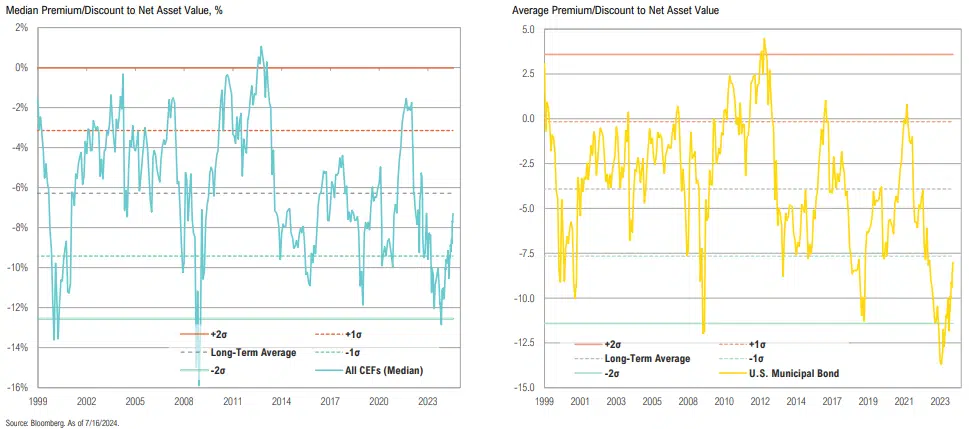
Median CEF discounts have been narrowing since October and are at the tightest discount since 2022; U.S. Muni CEF discounts are also less enticing, having narrowed from -13.7% to -8.0%
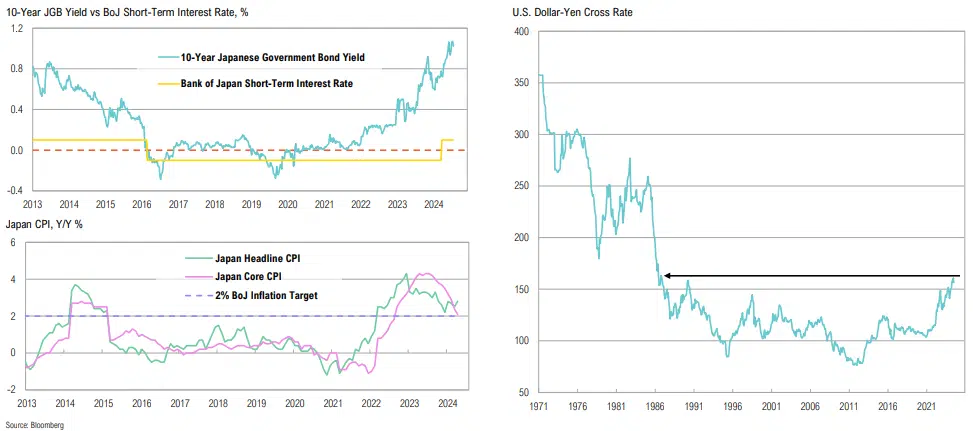
Japanese government bonds have climbed higher since the Bank of Japan hiked rates in March (the first hike in 17 years); the yen recently weakened to 4-decade lows
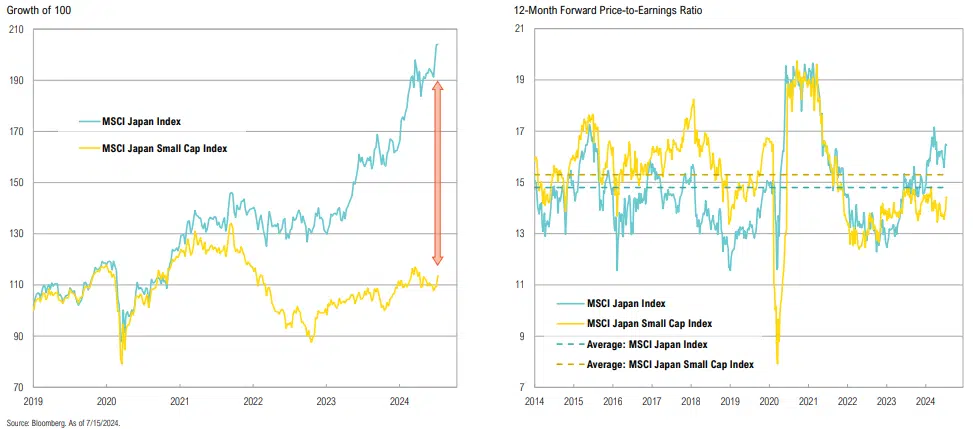
Japanese small cap stocks have lagged the broader index over the past 5 years; while still well below 10-year averages, small cap P/Es are starting to tick higher, likely due to incentives from TSE
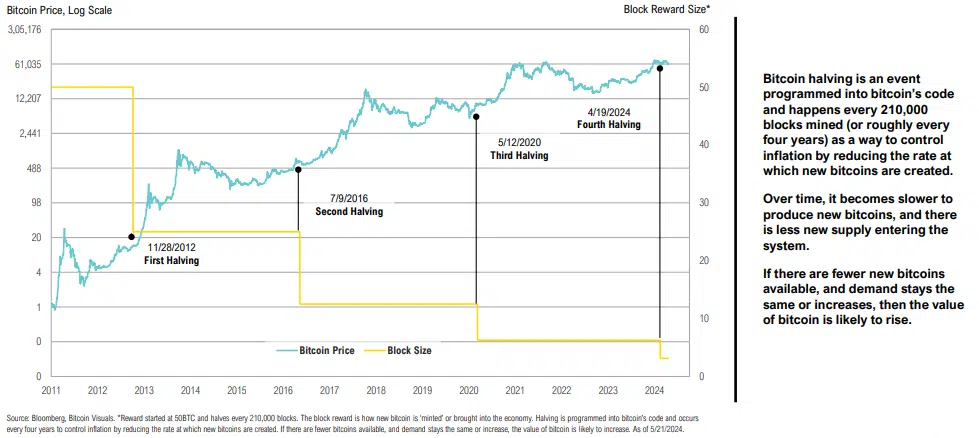
The price of bitcoin tends to increase after each halving event, but has been flat since the fourth halving in mid-April, despite having a volatile few weeks
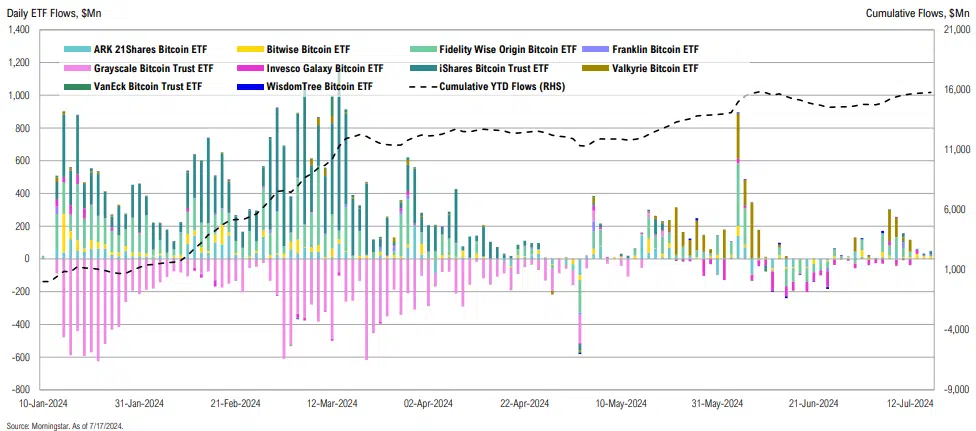
After accumulating nearly $16bn, flows into (and out of) bitcoin spot ETFs have stabilized somewhat; GBTC is no longer seeing meaningful outflows
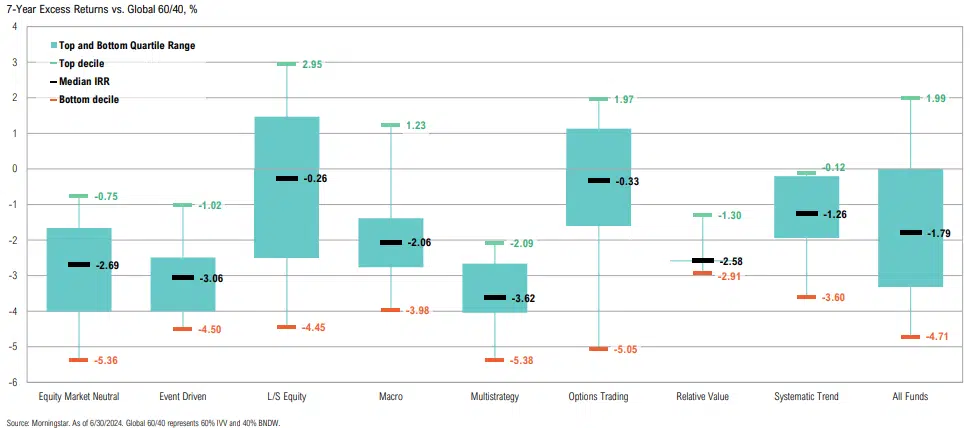
Keep it simple: expensive liquid alternatives have underperformed other than a select few categories, underpinning critical role of manager selection
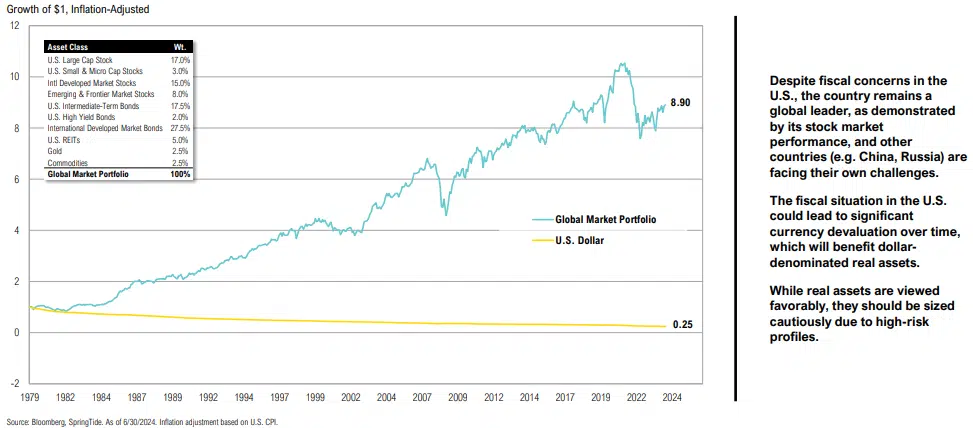
The U.S. dollar is likely to remain the ‘cleanest shirt in the laundry’ for the foreseeable future, but it will gradually lose its value vs. real and productive financial assets over time
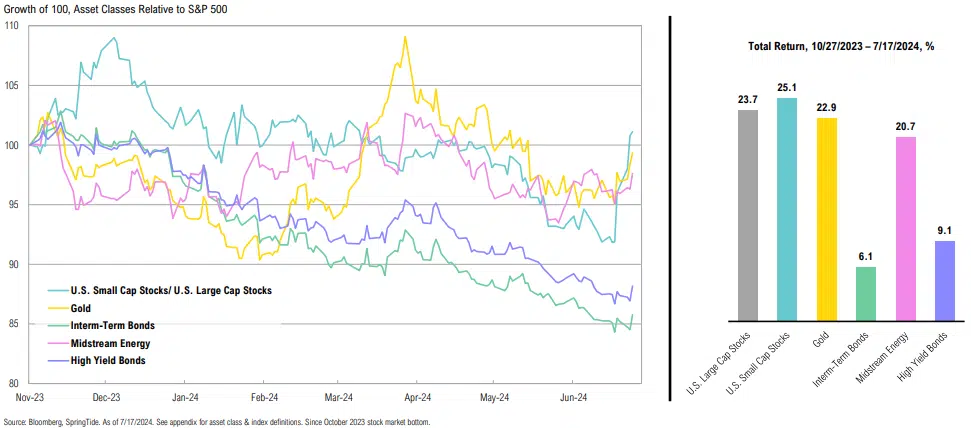
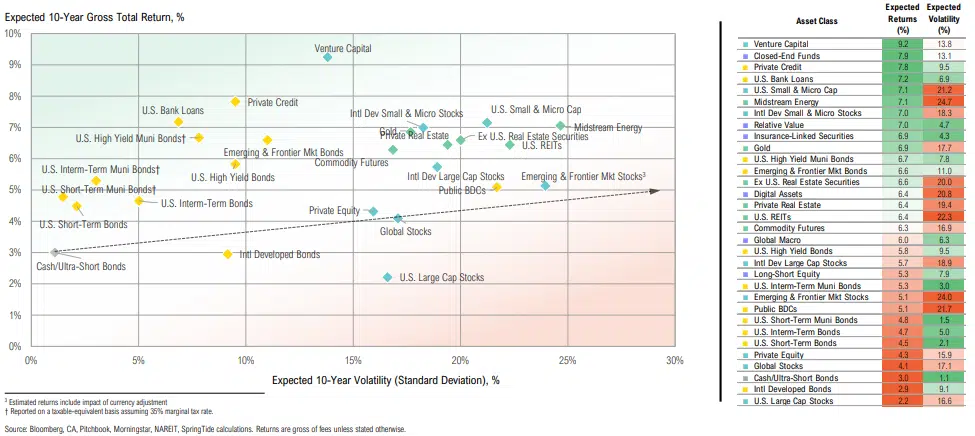
While some asset classes have been able to keep up with U.S. large cap stocks, most have lagged, suggesting there might be overlooked opportunities elsewhere
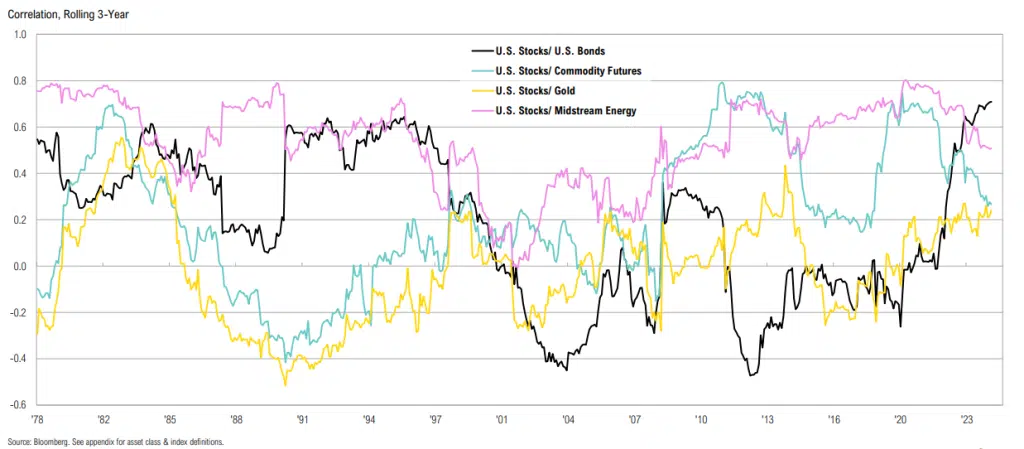
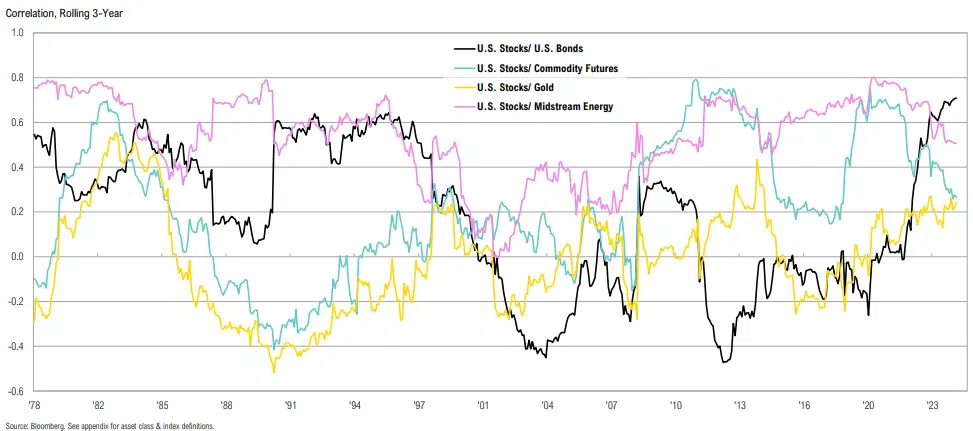
Bonds have recently provided less diversification benefits to stocks than other asset classes
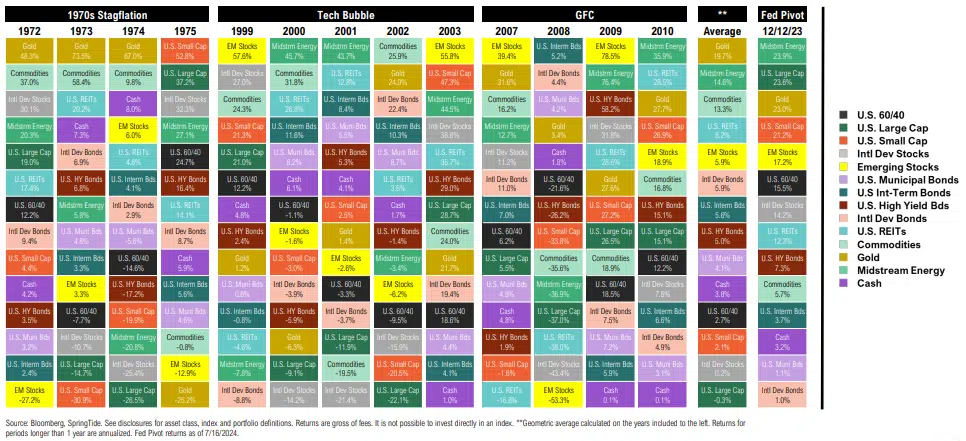
Even if not base case, returns during periods of stress (stagflation, bubble unwinds, banking crisis) contrast so starkly with the last 15 years that they should be considered
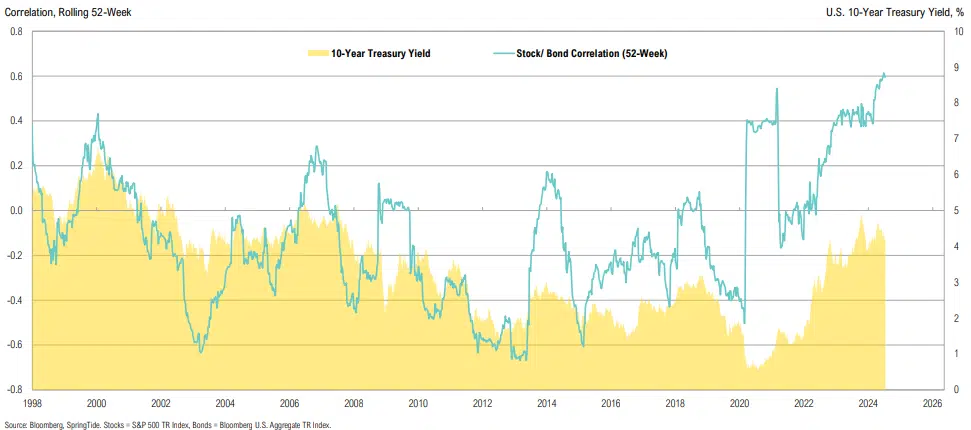
Stocks and bonds remain highly correlated in this higher-rate environment
Bonds have recently provided less diversification benefits to stocks than other asset classes