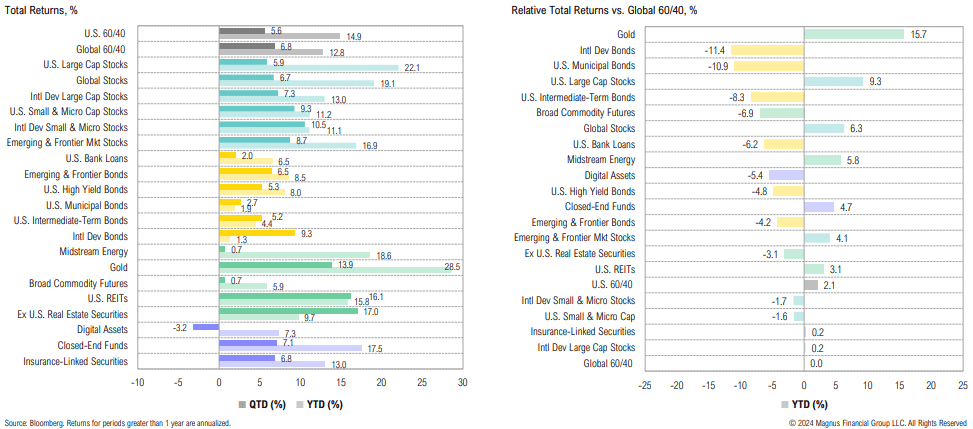
Major winners over the third quarter include ex-U.S. real estate (+17.0%) and U.S. REITs (+16.1%) while digital assets (-3.2%) and broad commodities (+0.7%) lagged
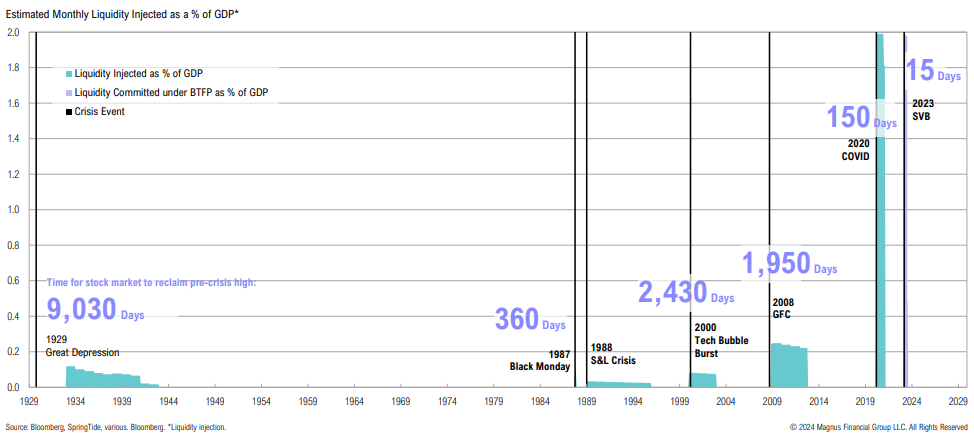
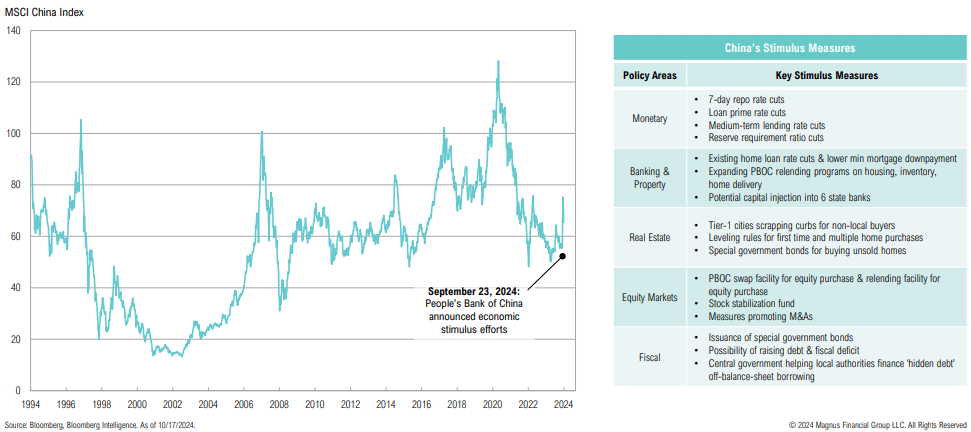
Liquidity injections are becoming larger and faster, with faster transmission to markets
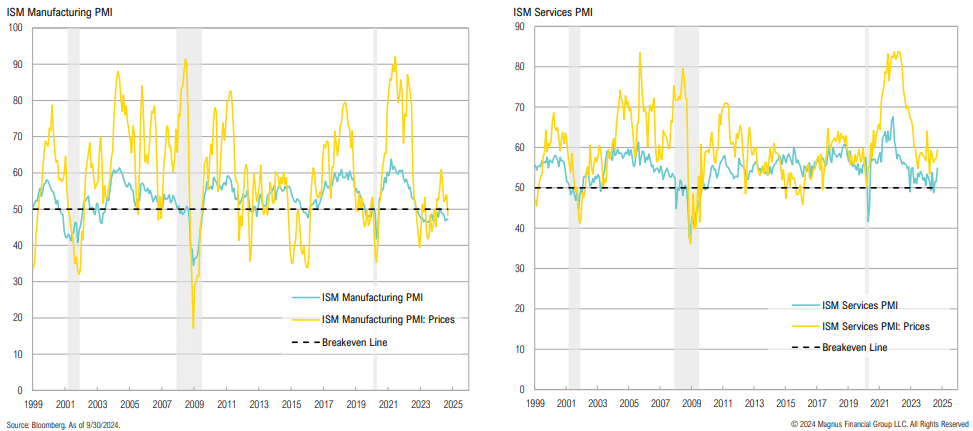
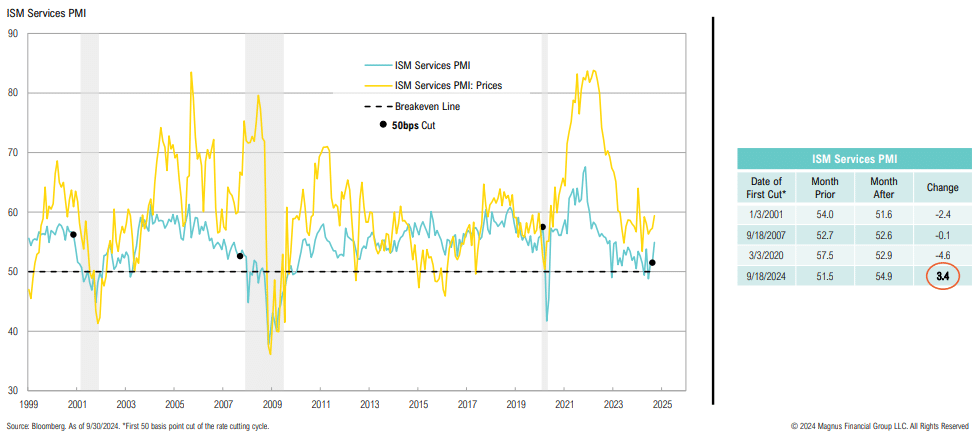
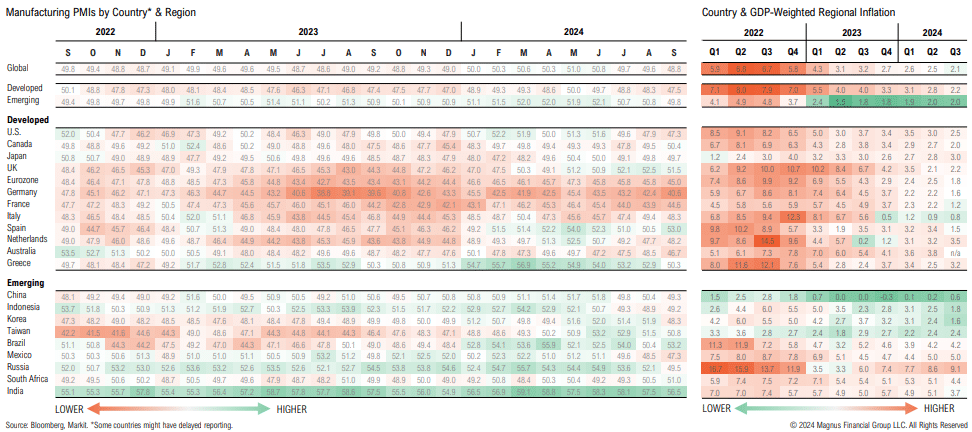
While the manufacturing sector remains in contractionary territory, the services sector remains strong; services prices paid in September rose to the highest level since January
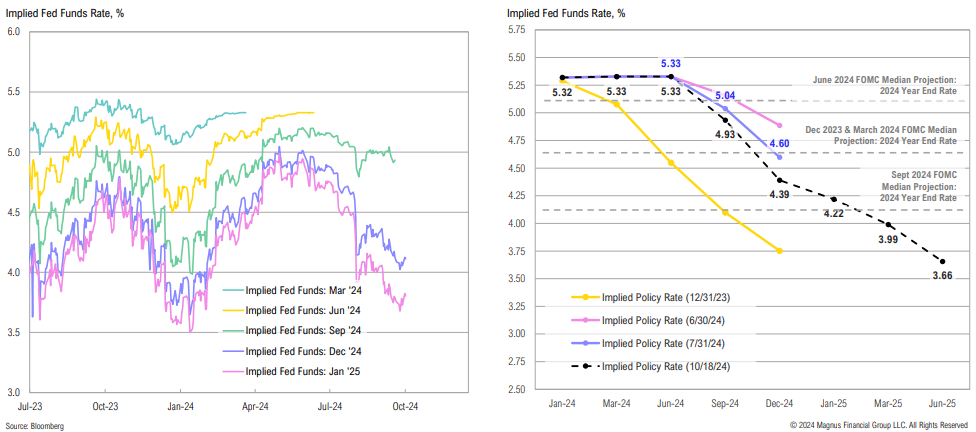
The Fed risks fueling a growing economy; this is the first time ISM Services PMI has increased in the month following a 50bps rate cut
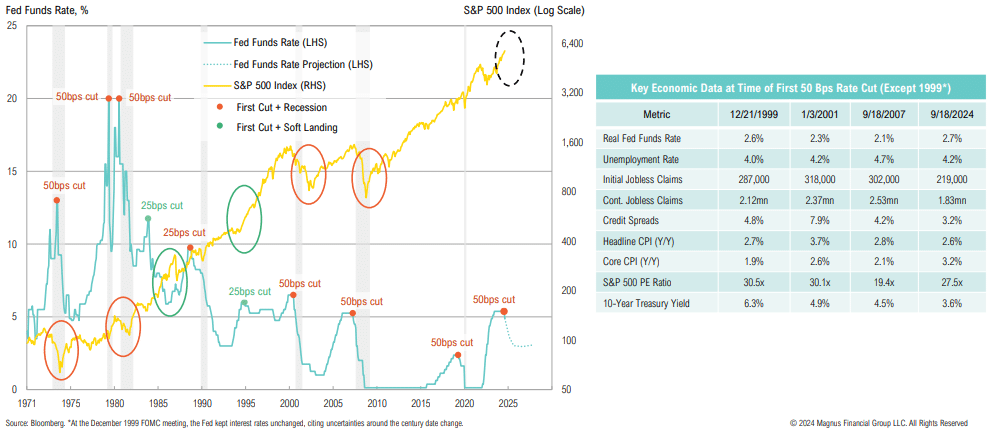
A 50bps cut usually only happens during times of crisis; history shows us if the first cut is 50bps, it’s usually been justified
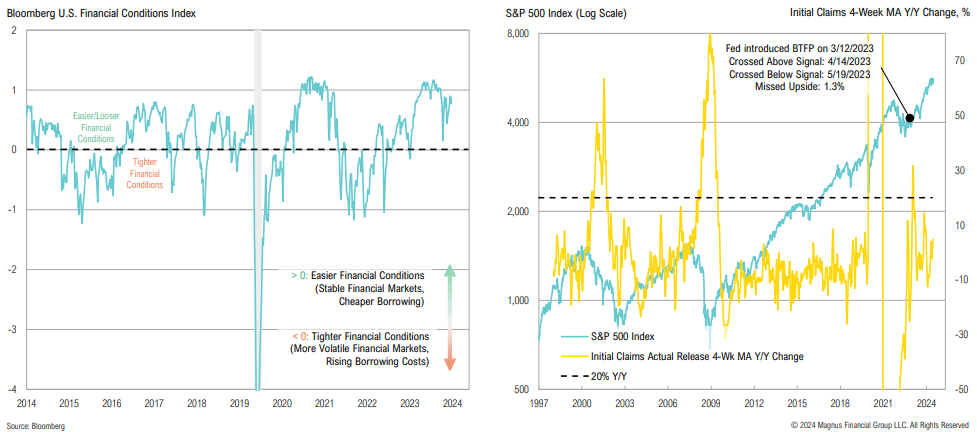
Financial conditions remain loose; initial jobless claims continue to indicate a stable labor market
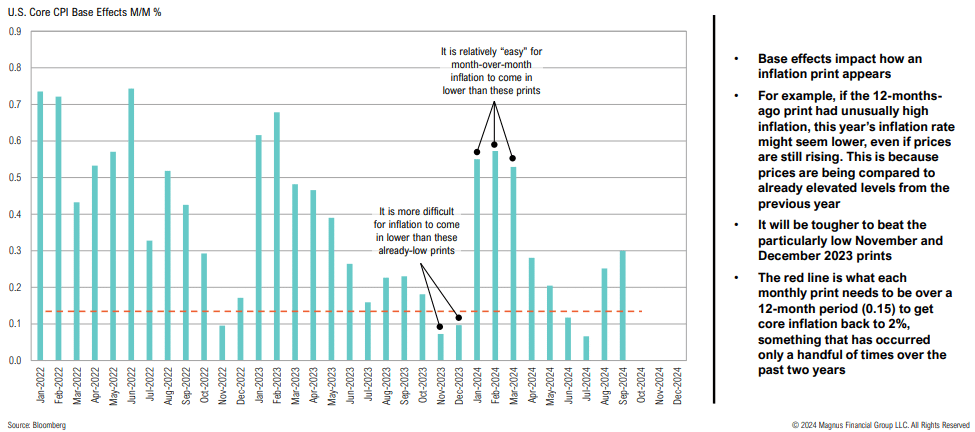
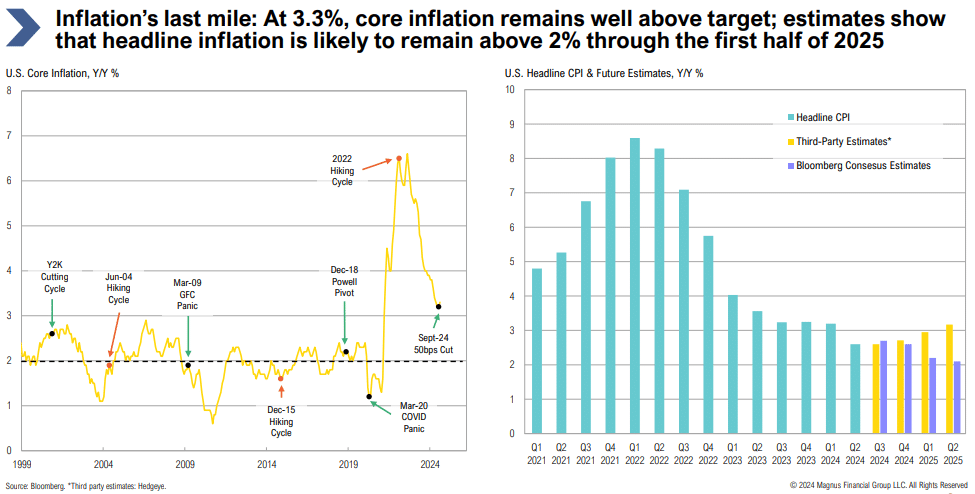
Further, core inflation may remain sticky: base effects show the challenge to beat “easy” larger month-over-month prints becomes more challenging through year-end
Inflation’s last mile: At 3.3%, core inflation remains well above target; estimates show that headline inflation is likely to remain above 2% through the first half of 2025
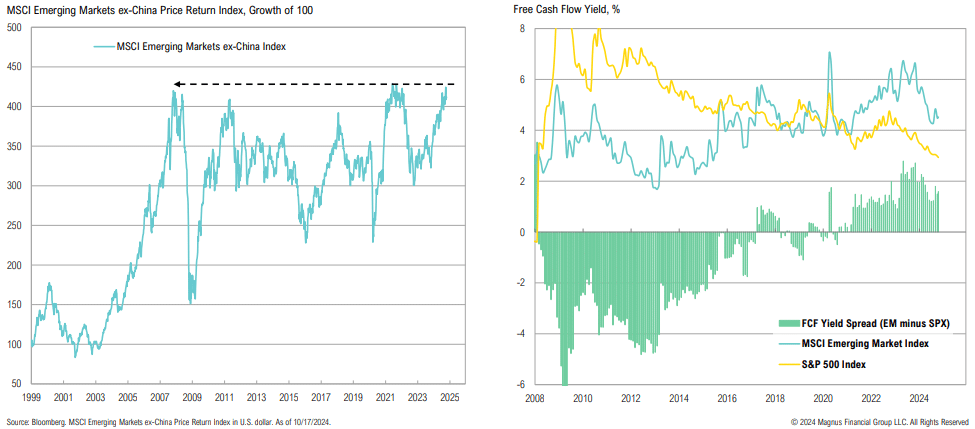
Globally, inflation has eased, but manufacturing activity has slowed; country divergences continue with Japan, Canada and select emerging markets faring better than the Euro area
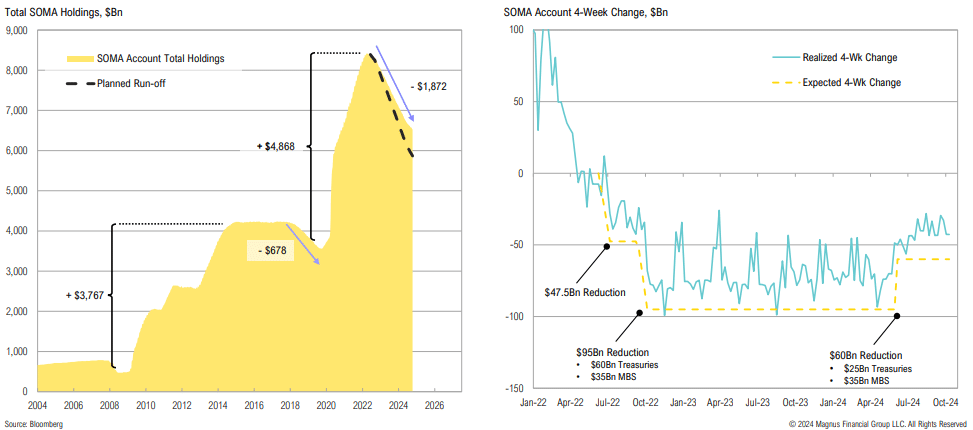
The Fed slowed the pace of QT on June 1, despite inflation remaining above target for >3 years, having reduced the balance sheet by only <40% of what was added during COVID and lagging its planned runoff by >$500bn
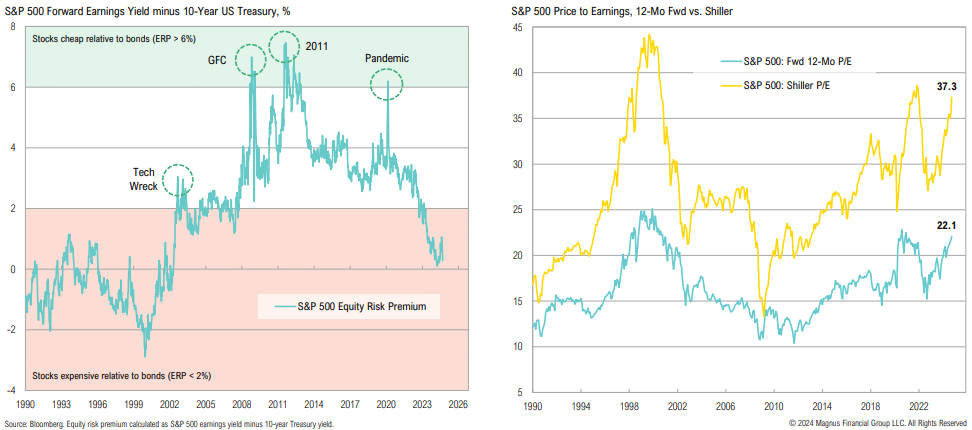
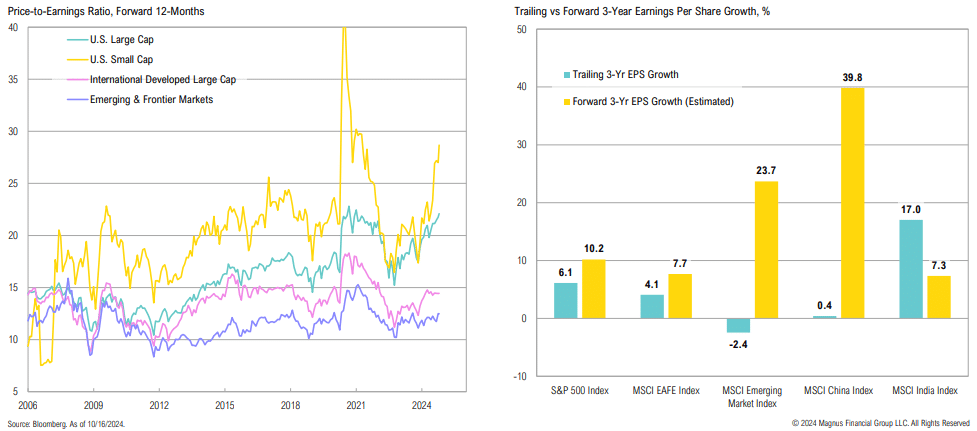
Using a yield-to-earnings yield comparison (ERP), U.S. stocks are less attractively priced vis-à-vis bonds than at any point since the 1990s; valuations appear rich from both a Shiller and forward P/E perspective
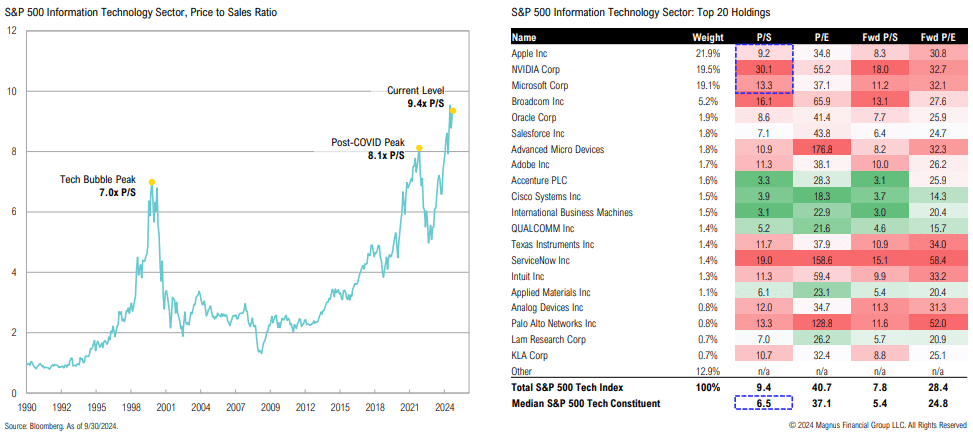
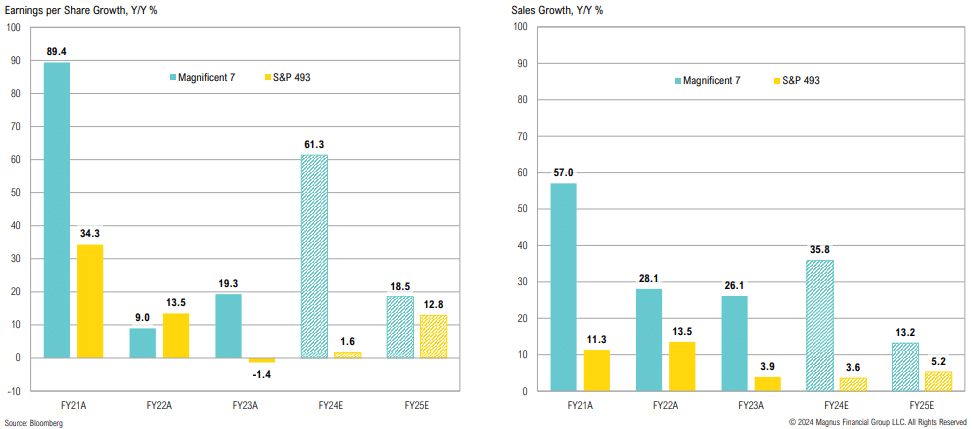
Are high valuations at least partially being driven by strong earnings growth? FY 2024 Mag 7 earnings are expected to grow by 61.3%, while S&P 493 earnings are expected to grow by 1.6%
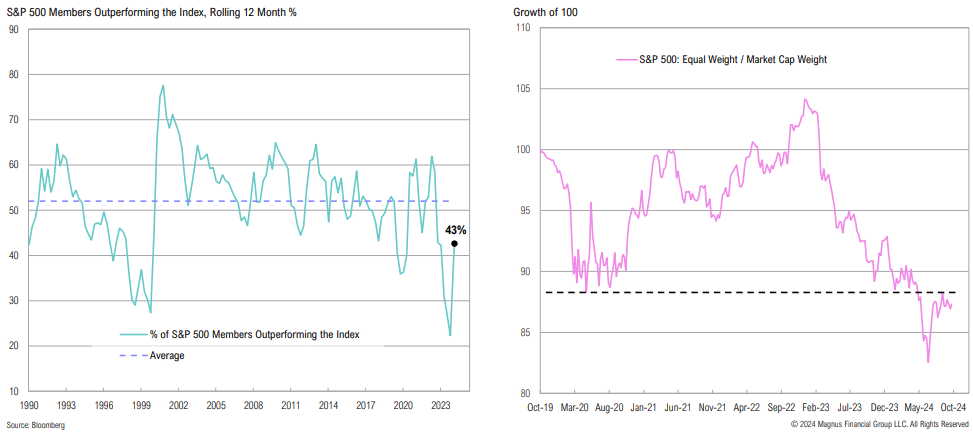
Market breadth continues to improve, with 43% of S&P 500 members outperforming the broader index and the equal weighted index outperforming since early July
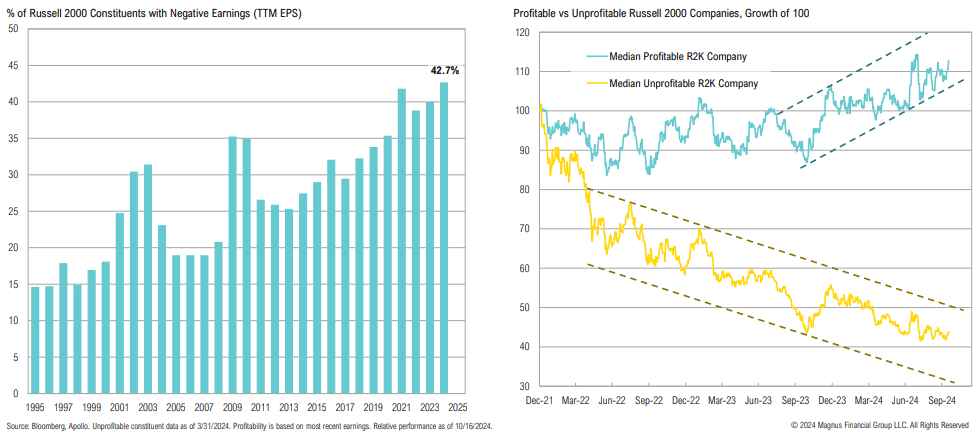
The market remains selective with U.S. small cap stocks: profitable companies are faring well, while unprofitable companies (~43% of the Russell 2000) continue to trend lower
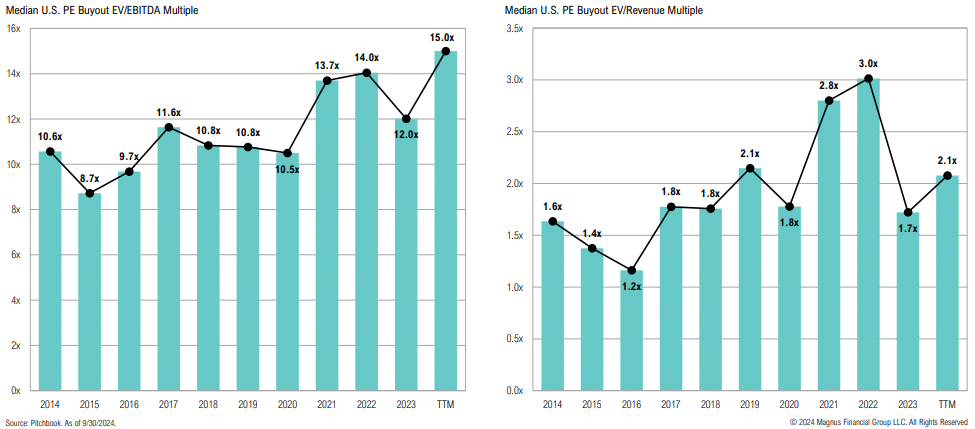
Buyout EV/EBITDA multiples are elevated, while EV/Revenue multiples suggest these companies are struggling with profitability
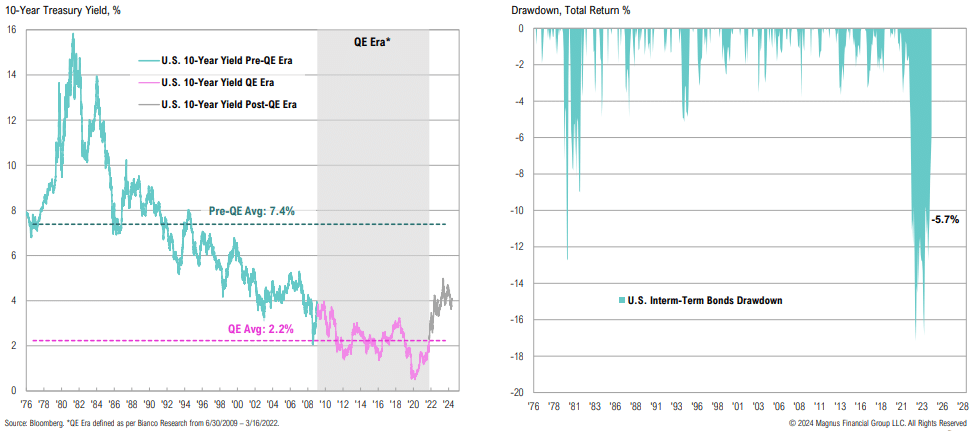
We are in the biggest bond bear market of all time; bonds peaked in August 2020 and have yet to recover
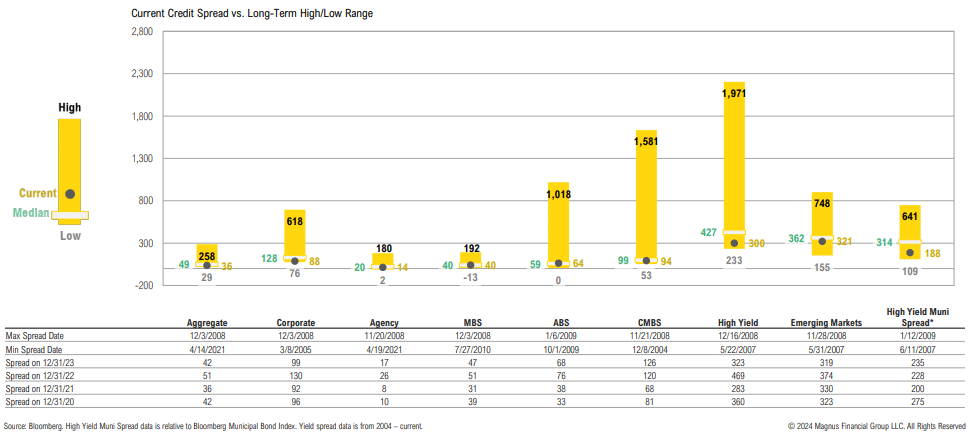
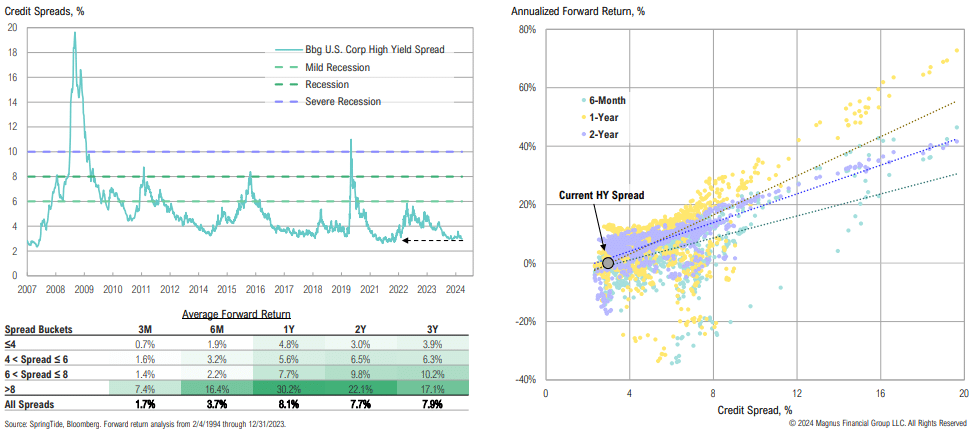
Credit spreads are near or below median across most sectors; high-yield bond spreads at current levels suggest that the economy may achieve a ‘soft landing’
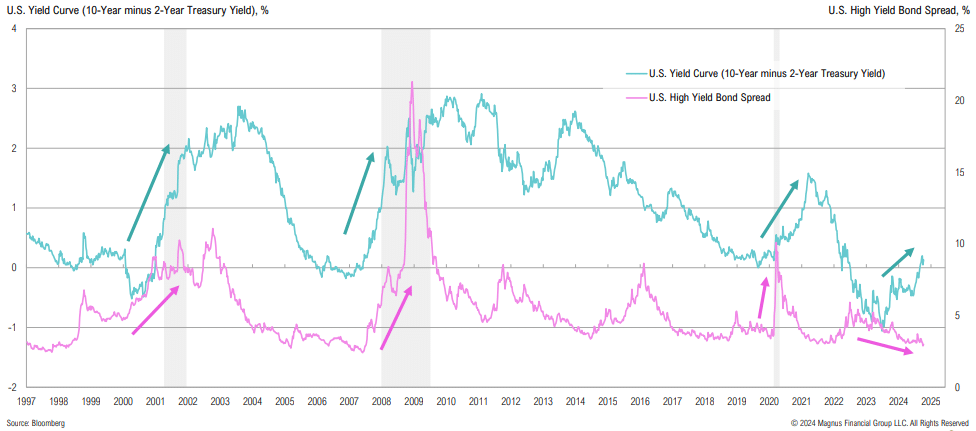
One of these cycles does not look like the others: credit spreads are at new cycle lows, while the yield curve is steepening
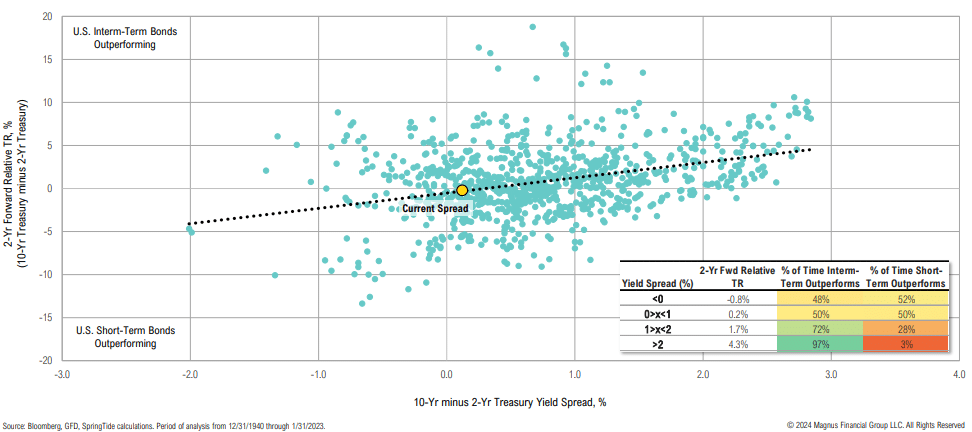
When the 2s10s spread is above 2%, investors should generally hold longer duration bonds; when it is between 1% and 2%, it is not a home run; and below 1% is a coin toss
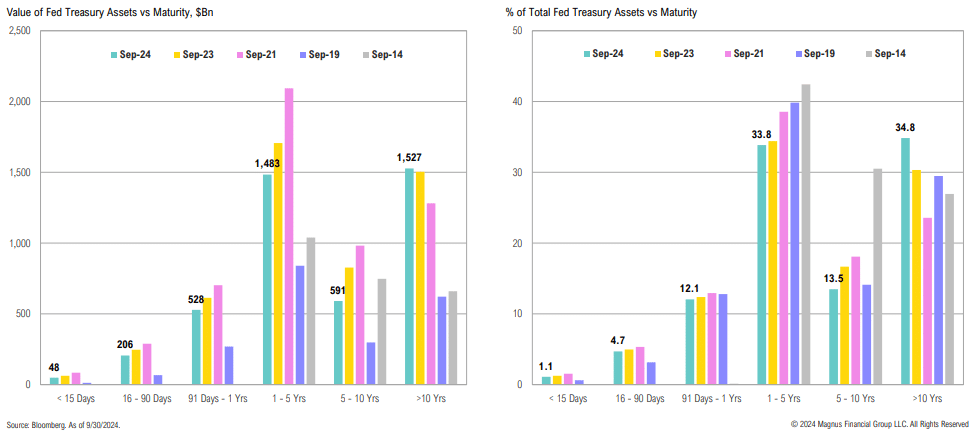
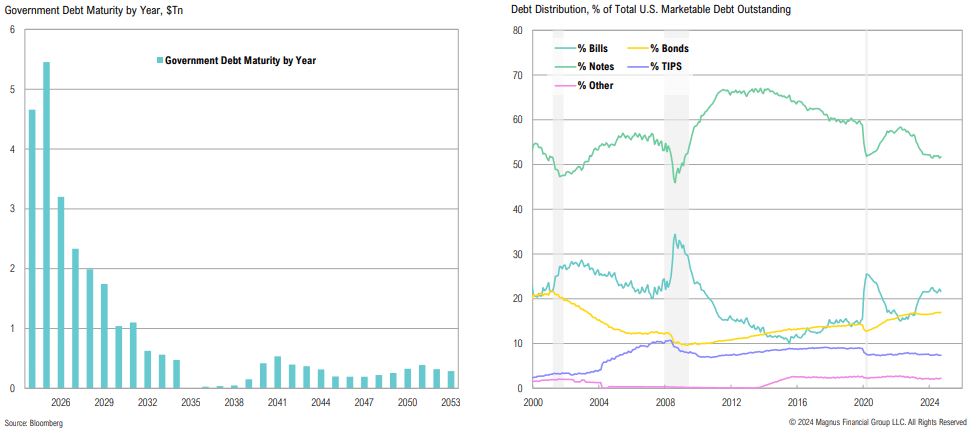
Over $10Tn in government debt will mature by the end of 2025 and be rolled at higher rates; bill issuance has plateaued with Treasury starting to increase bond issuance again
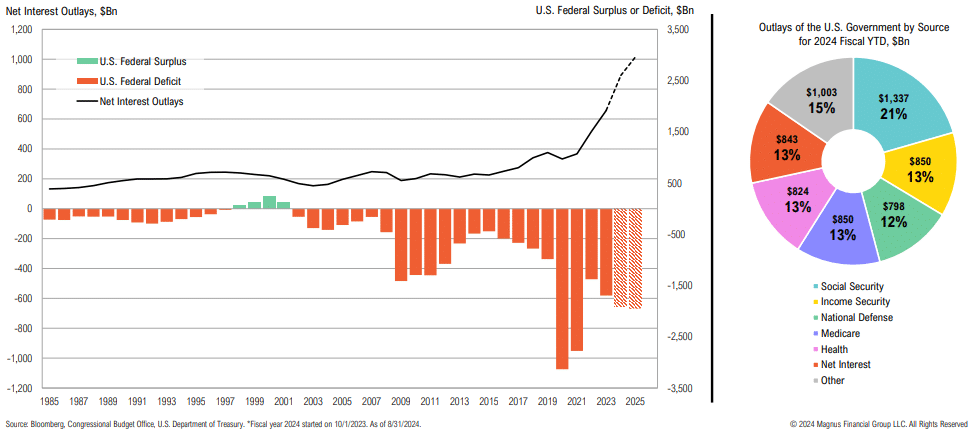
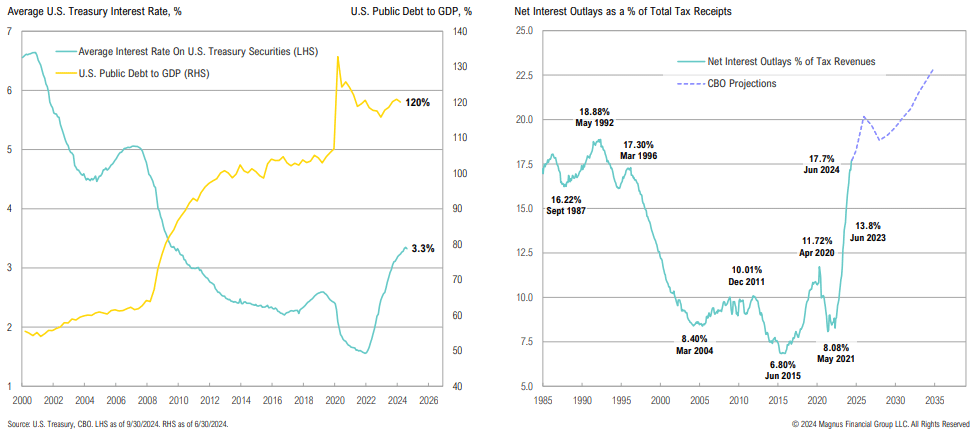
The average cost of Treasury debt outstanding has climbed to 3.32%, a level last seen when debt to GDP was ‘just’ 80%; tax receipts aren’t keeping pace, with nearly 18% of taxes going only to net interest payments
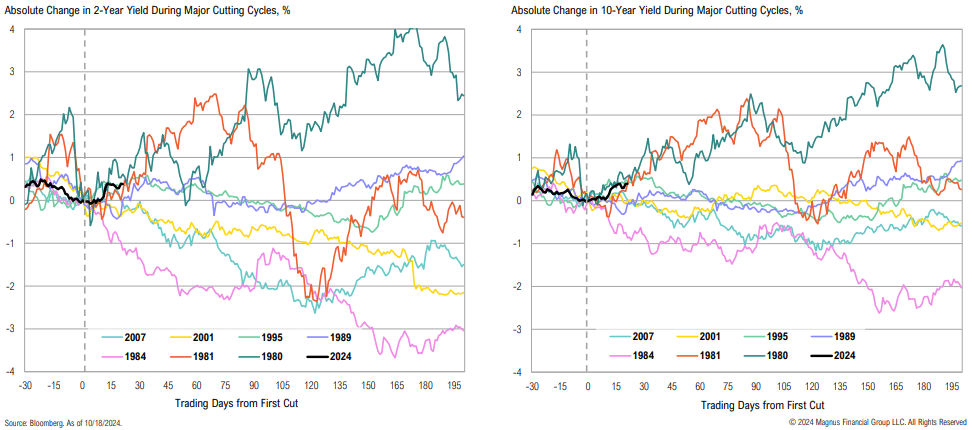
Yields rising following the first rate cut (as they are now) is reminiscent of what happened during the early 1980s (albeit when inflation was much higher at >10%)
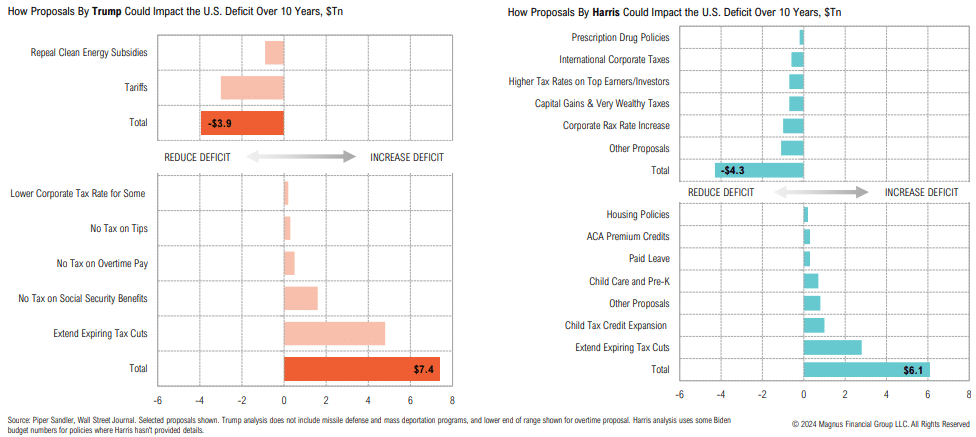
Historically, long-term yields tend to follow nominal GDP; pro-growth policy that drives up nominal GDP may have implications for bond yields
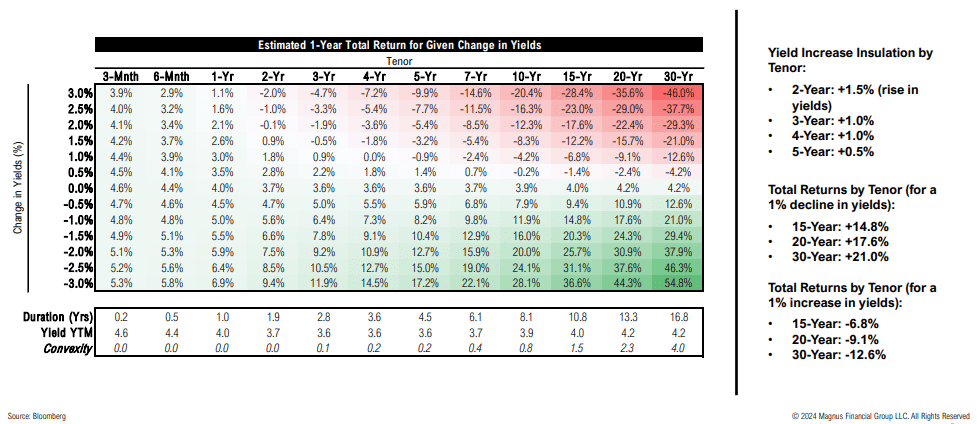
The 2–4-year part of yield curve has an attractive risk-reward profile—yields could rise 1.0% in the next year and total returns would still be positive
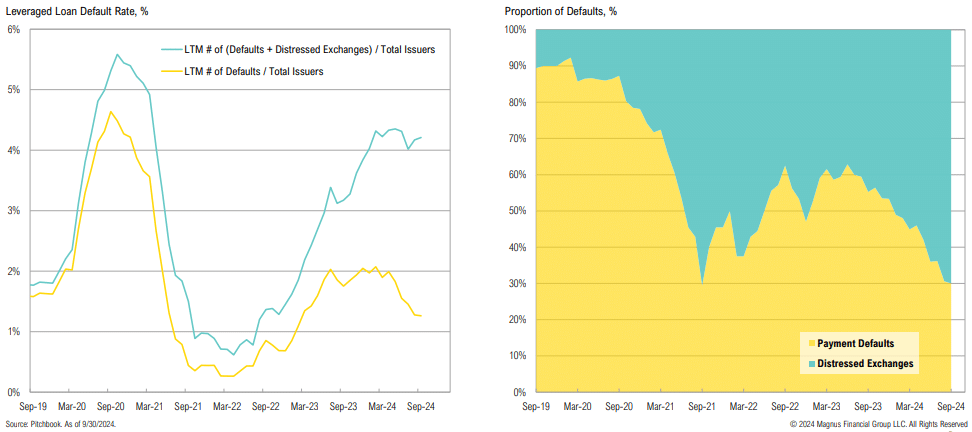
Distressed exchanges are replacing traditional defaults, masking issues
Not attractive: at ~298bps, credit spreads are in line with pre-COVID lows; low credit spreads continue to suggest runway for the economy (i.e., a ‘soft landing’)
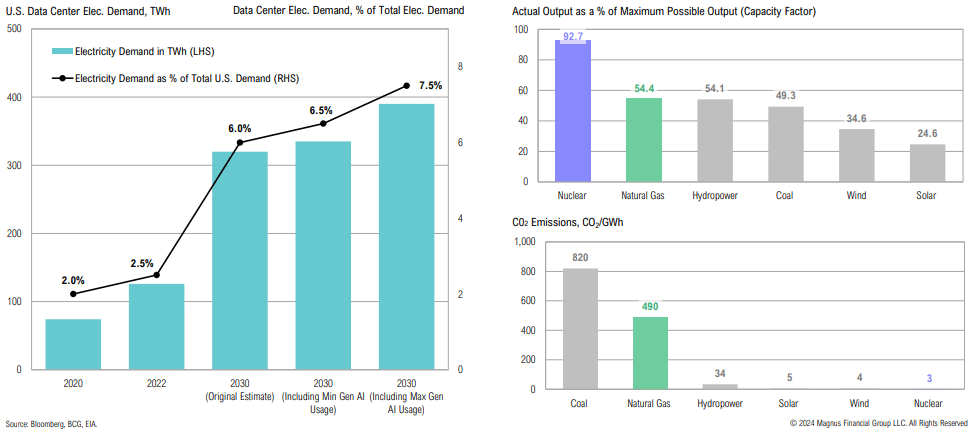
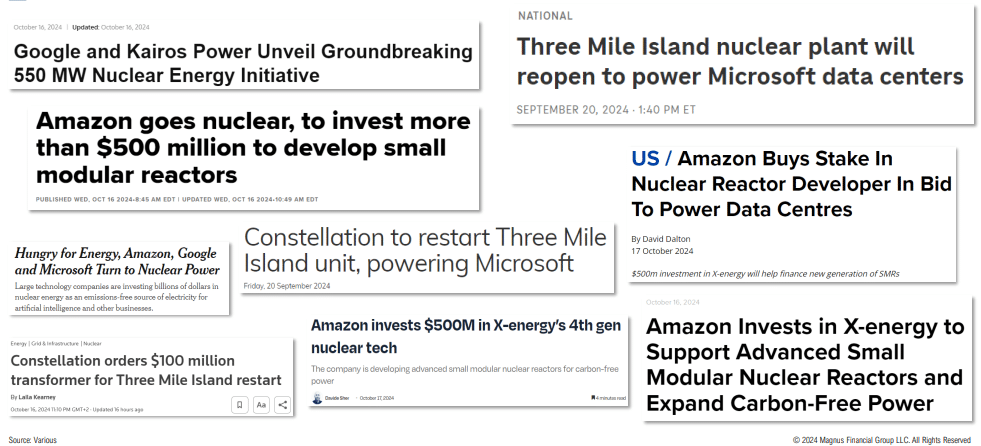
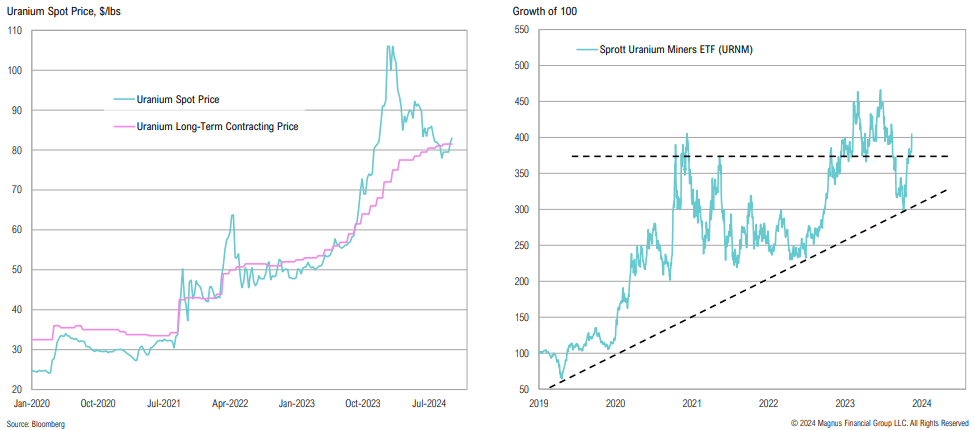
AI and data centers are expected to be key drivers of future U.S. power demand; given consistent output requirements for data centers, natural gas and nuclear are the best energy sources to meet demand
Uranium prices have been recovering, while long-term contracting prices (the prices negotiated between utilities and miners) continue to move higher; uranium miners recently broke through key technical resistance levels
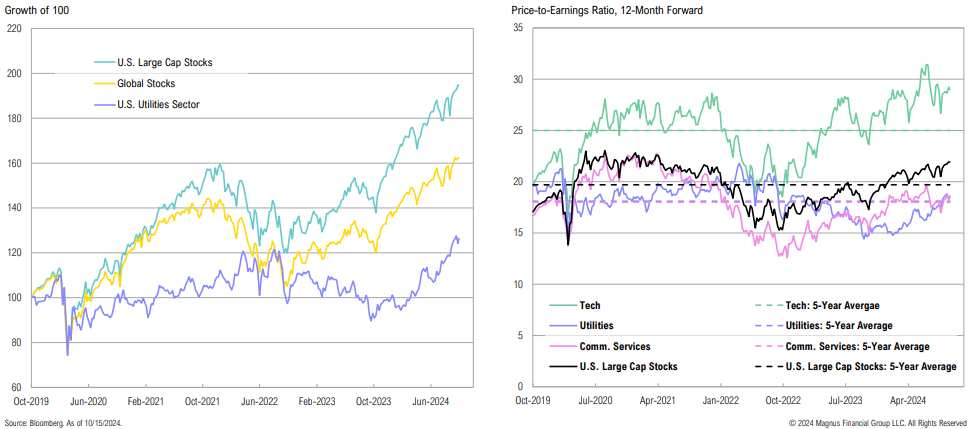
Despite the recent rally, U.S. utilities have notably lagged U.S. large-cap stocks and global stocks over the past five years; utility valuations are on par with their 5-year averages
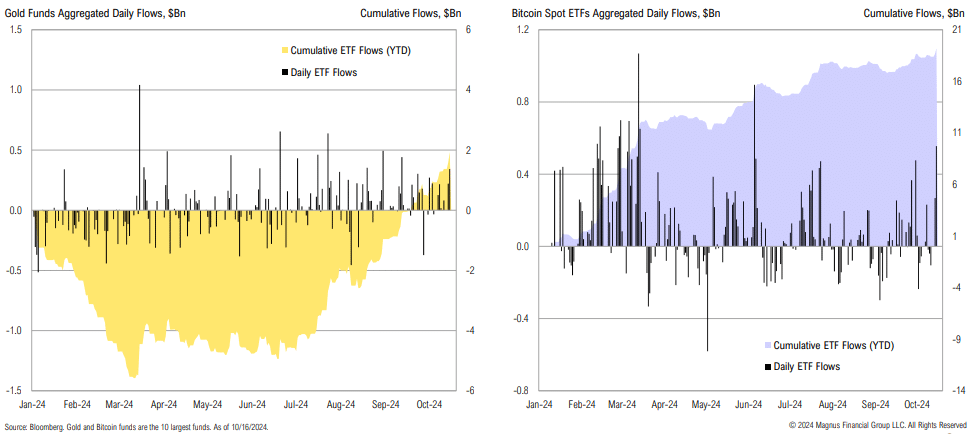
Gold fund flows have only recently begun to pick up; bitcoin flows have been more consistent and have recently accelerated
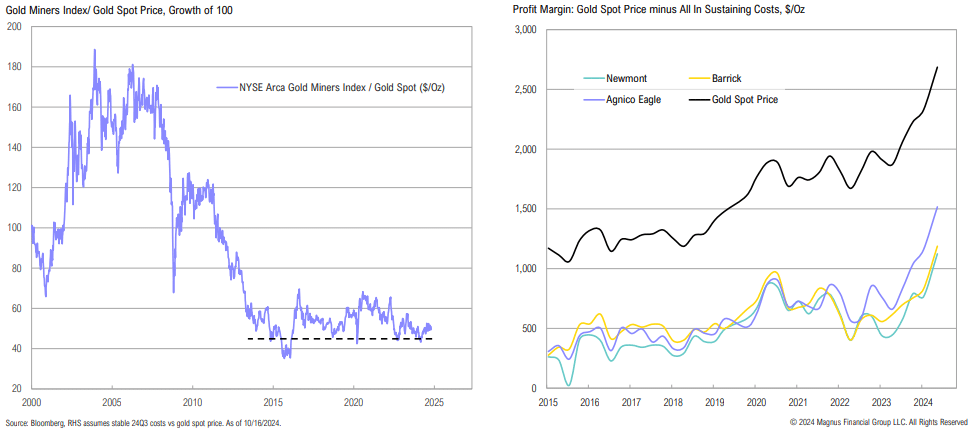
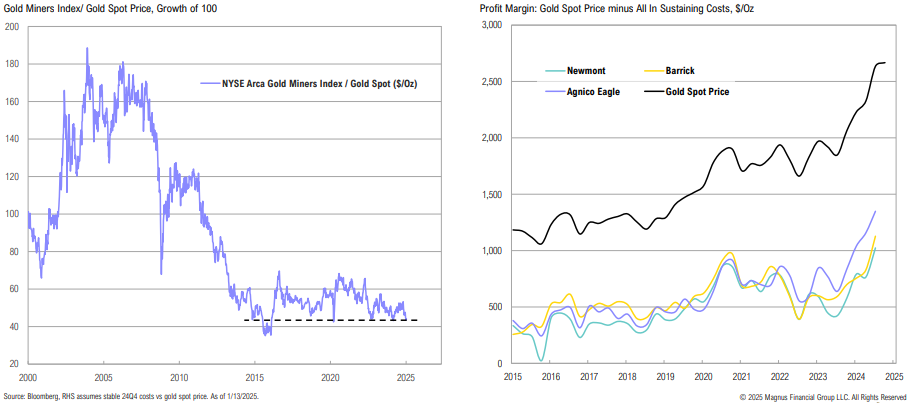
Gold miners continue to look attractive vs. physical, but miners have been plagued by rising costs, country-specific issues, and labor challenges, among other things
Geopolitical tensions in the Middle East continue
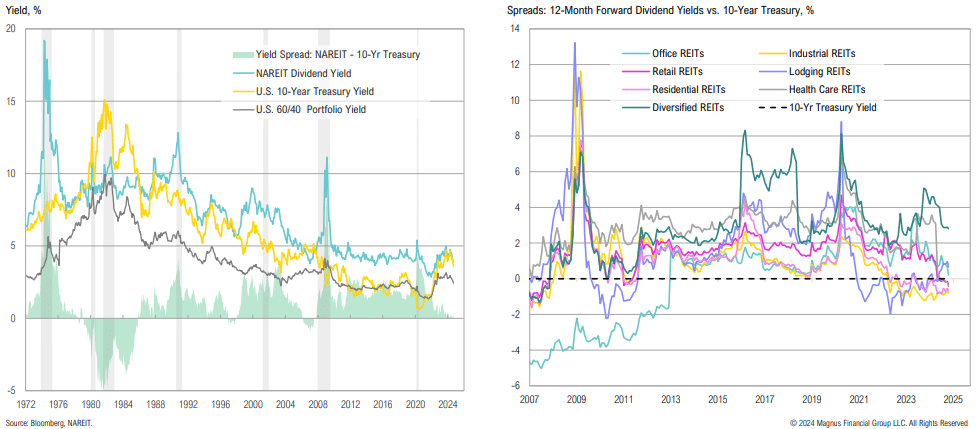
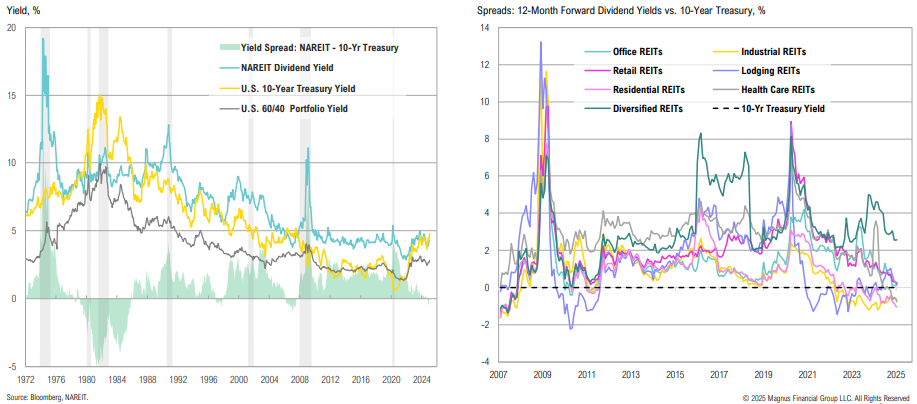
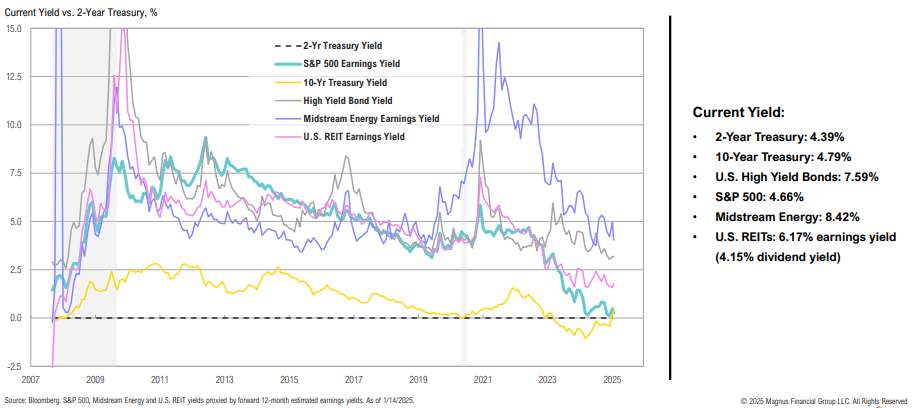
U.S. REITs have rebounded 26% from their April lows, as lower yields provided a reprieve for the asset class; despite the rebound, most REIT sectors still look wholly unattractive on a relative yield basis
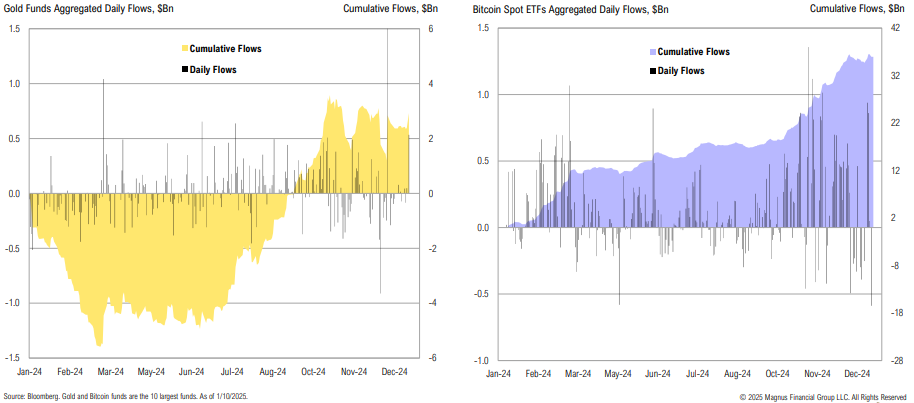
Gold fund flows started picking back up again in September; bitcoin flows have been more consistent and continue to rise as the price of bitcoin climbs
U.S. REITs are down >10% since the start of December, as higher yields have weighed on the asset class; despite the pullback, most REIT sectors still appear wholly unattractive on a relative yield basis
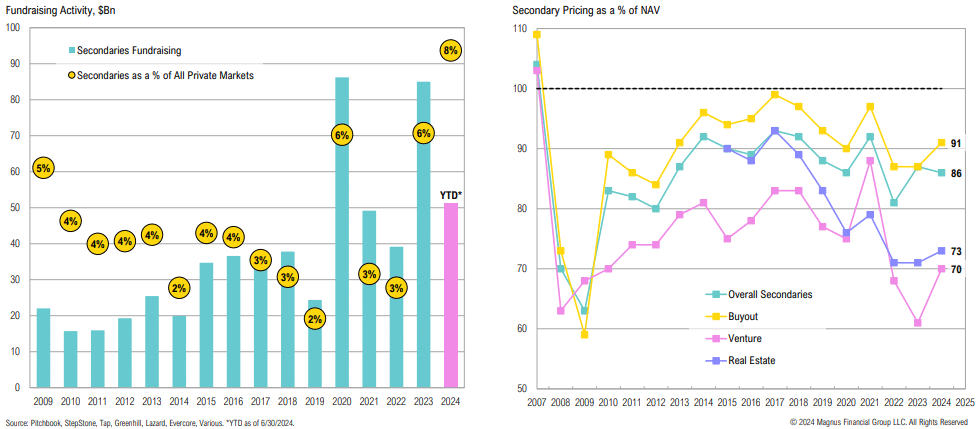
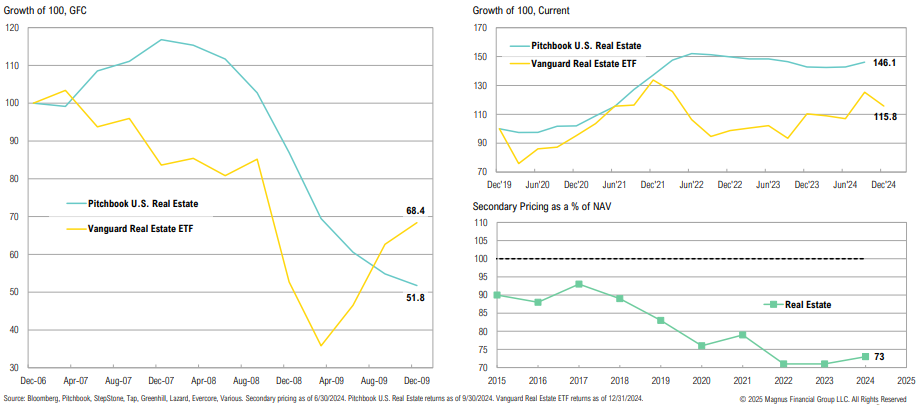
Private real estate funds have not marked down properties – while the gap has closed with public markets, secondary transactions remain at deep discounts
The relative yield case for high-yield bonds and REITs has been eroded by spread tightening/ higher Treasury yields
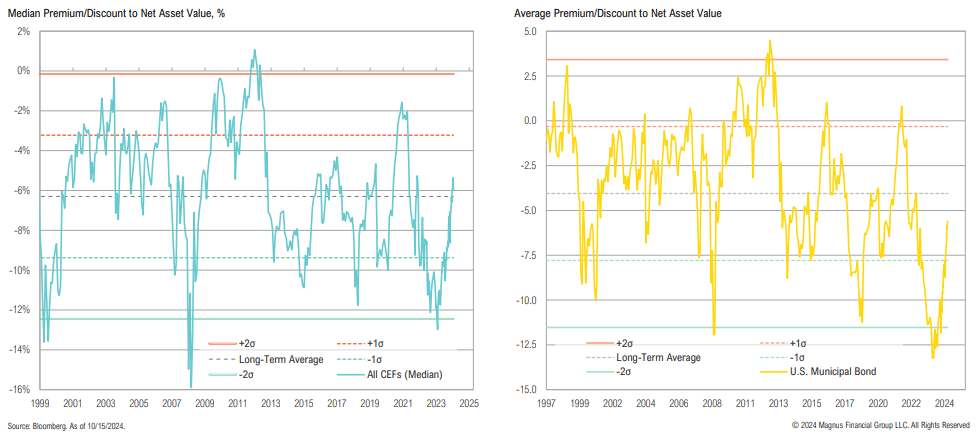
Median CEF discounts have been widening since last October and are now back below average levels; U.S. Muni CEF discounts are also more enticing, having widened from -5.3% to -9.1%
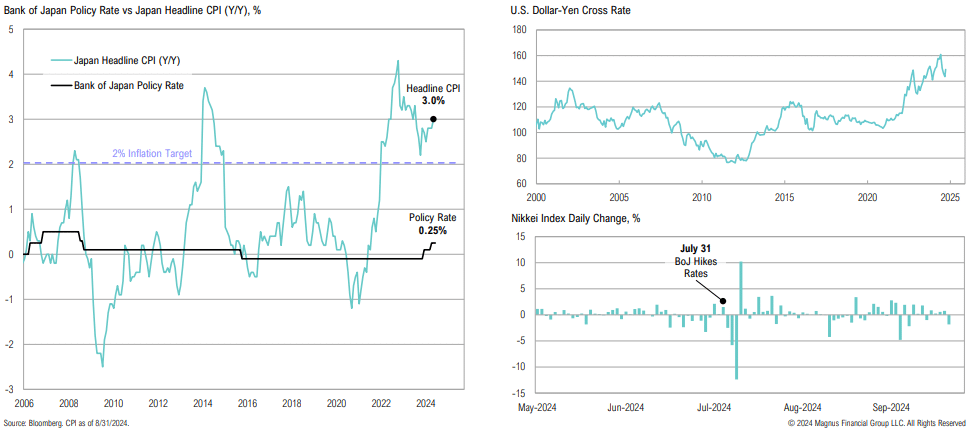
Japanese stocks have recovered from the early August yen carry trade unwind meltdown; the Bank of Japan has signaled a willingness to hike rates further if economic data allows
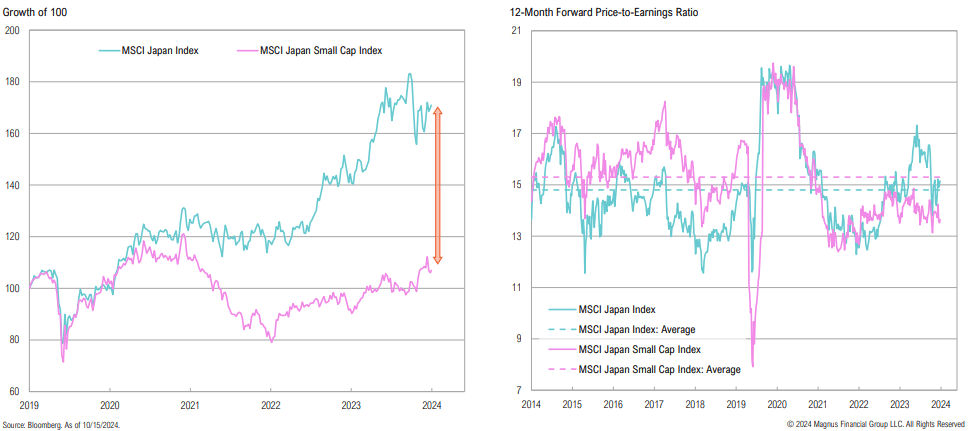
Japanese small cap stocks have lagged the broader index over the past 5 years; small cap P/Es have recently been trending lower, despite incentives from the TSE
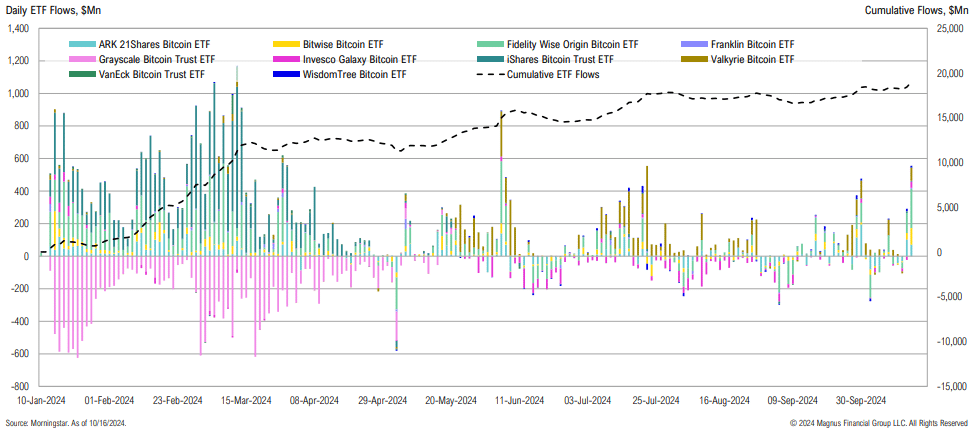
After accumulating nearly $19bn, flows into (and out of) bitcoin spot ETFs have stabilized somewhat
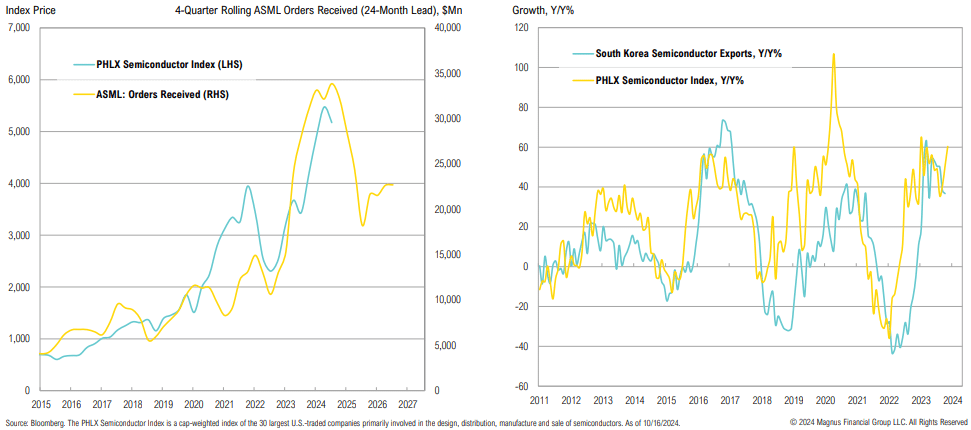
ASML’s new orders have been a leading indicator of semiconductor demand and are signaling a potential industry slowdown; South Korean semiconductor exports also appear to be rolling over
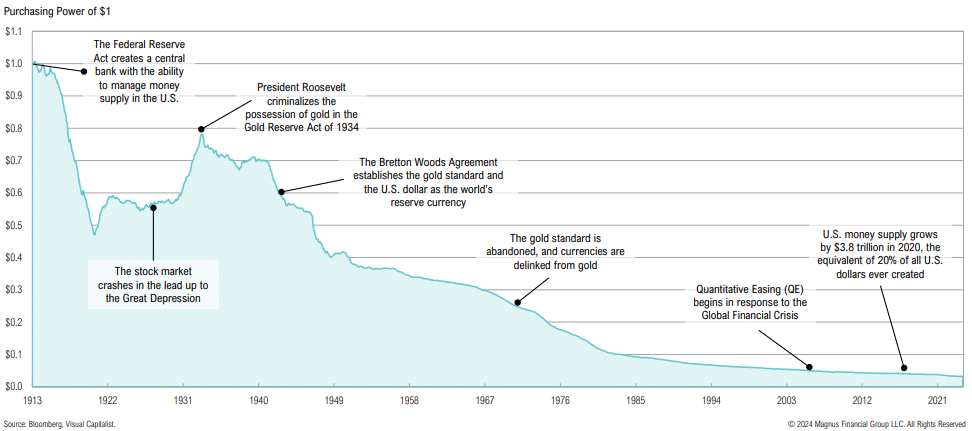
Over the last century, the purchasing power of the U.S. dollar has steadily eroded as a result of ongoing inflation
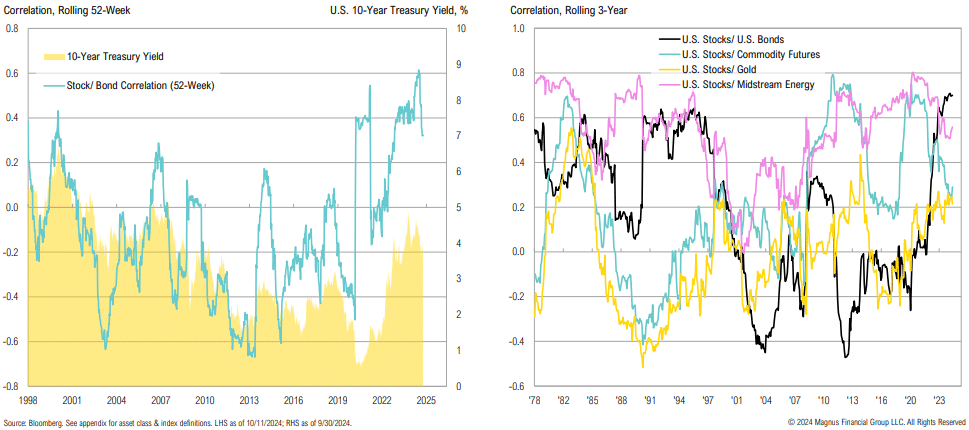
Bonds have recently provided less diversification benefits to stocks than other asset classes
Bonds have recently provided less diversification benefits to stocks than other asset classes
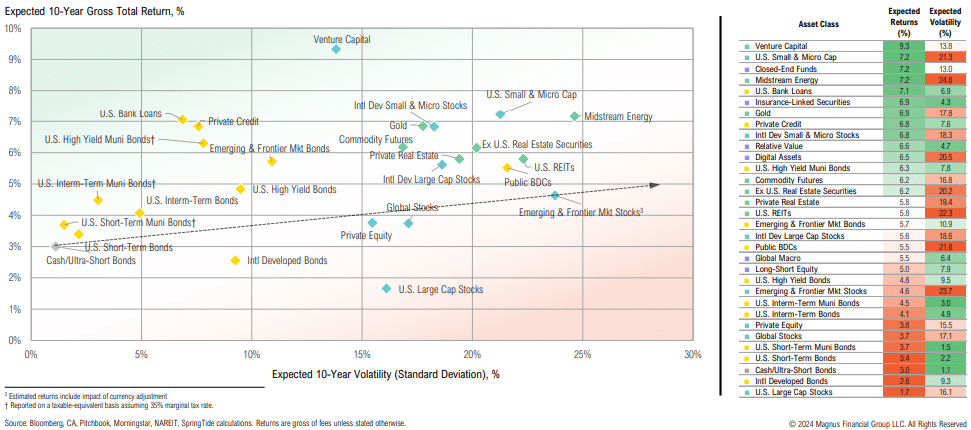
Expected returns for large cap stocks continue to decline, while small cap stocks look more attractive due to better fundamentals