Cartoon
Bubblicious
Market Commentary
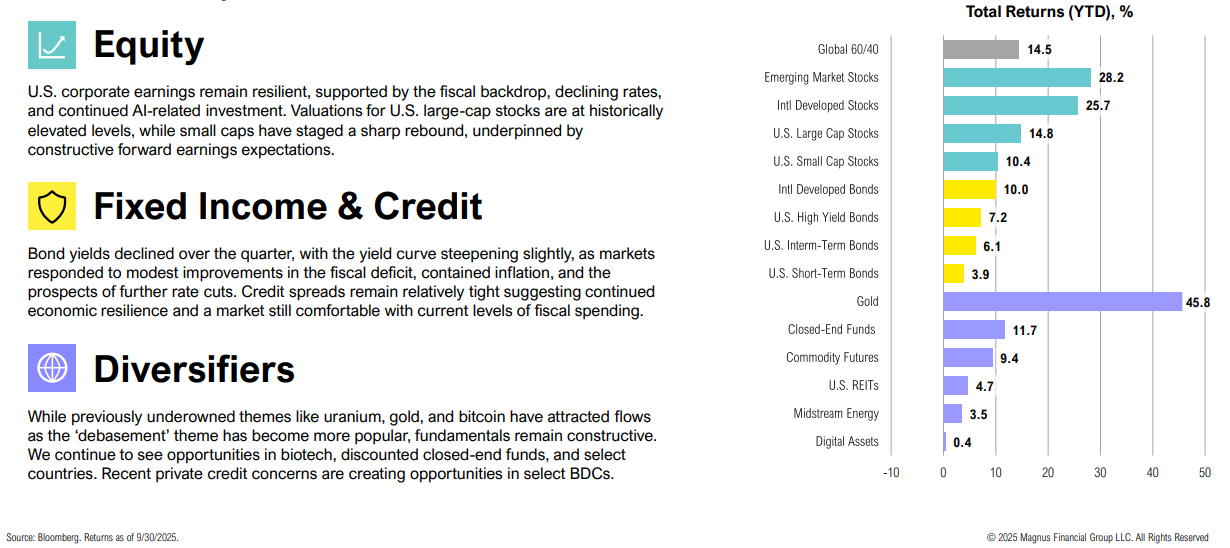
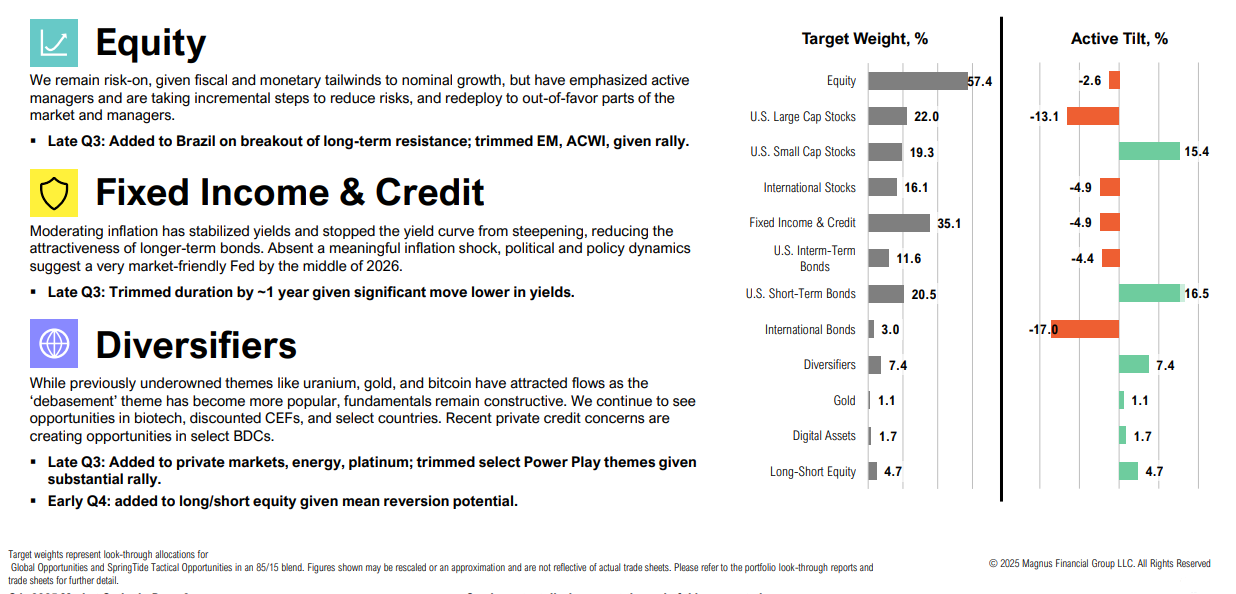
Positioning
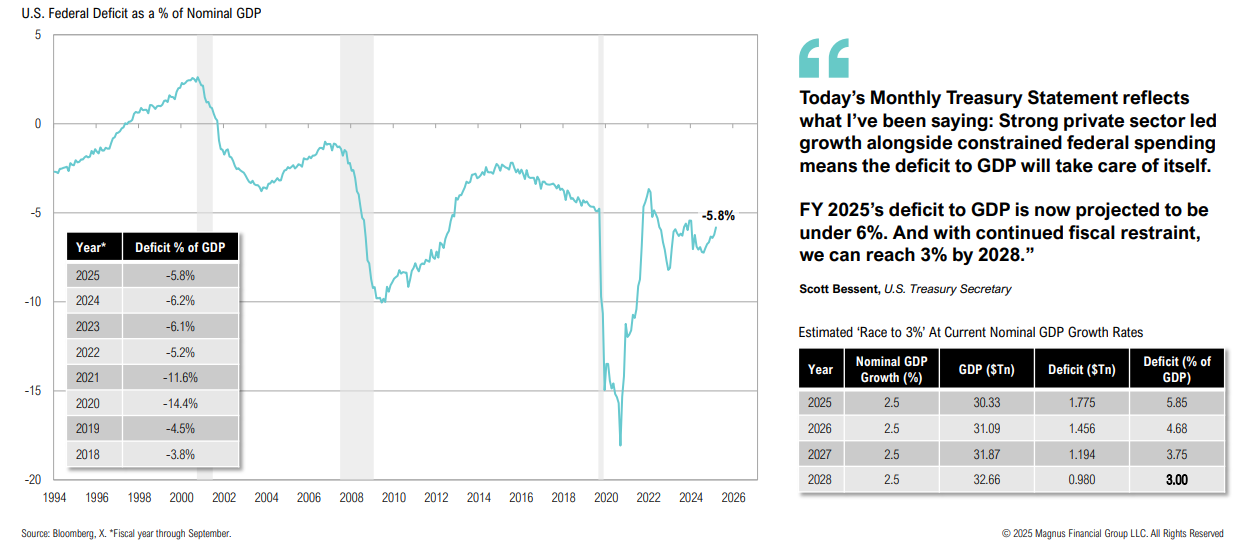
Fiscal Deficit
The fiscal deficit ended FY’25 at $1.78tn, less than the expected $1.94tn deficit, and a marginal improvement over FY’24
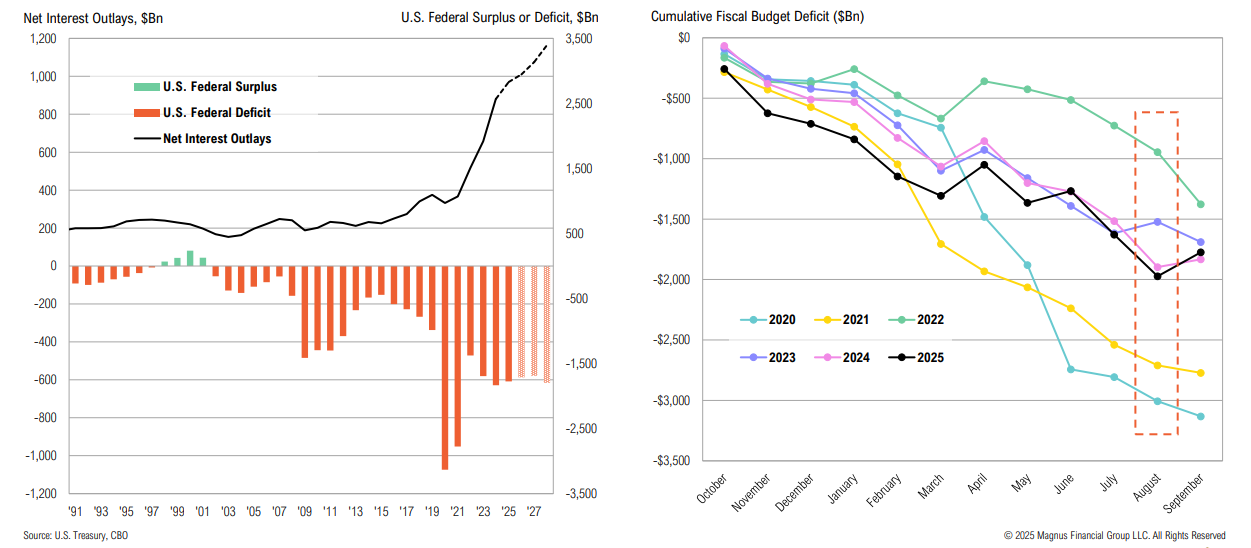
On a dollar basis, the U.S. is still running very large deficits, but as a percentage of GDP, it is starting to improve
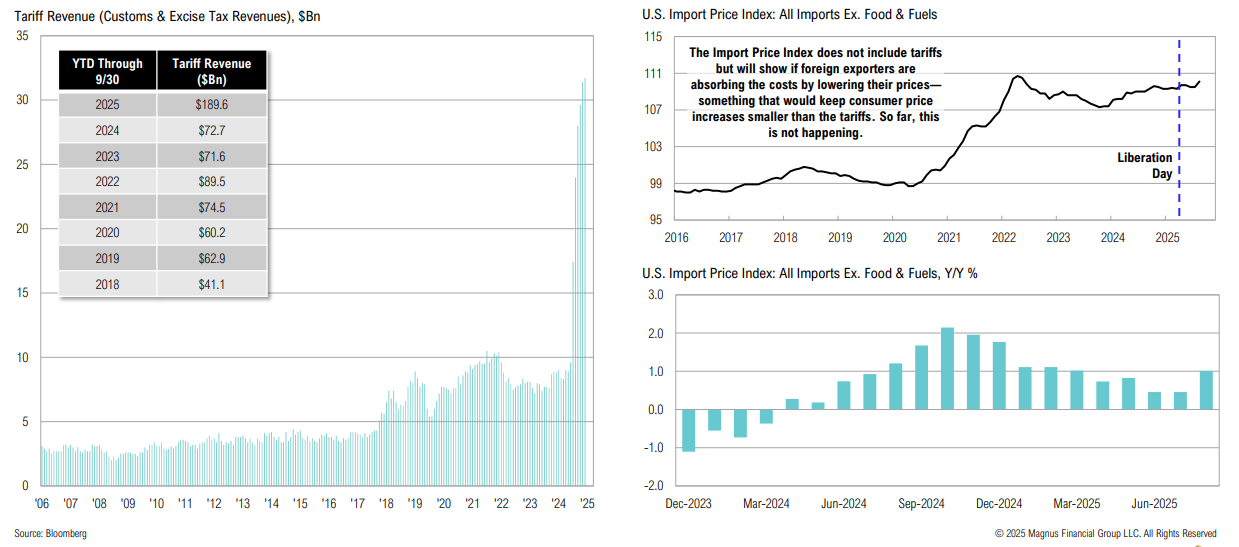
Tariff revenues contributed to the improvement in the U.S. fiscal deficit; the impact of tariffs on suppliers has been more manageable than initially expected
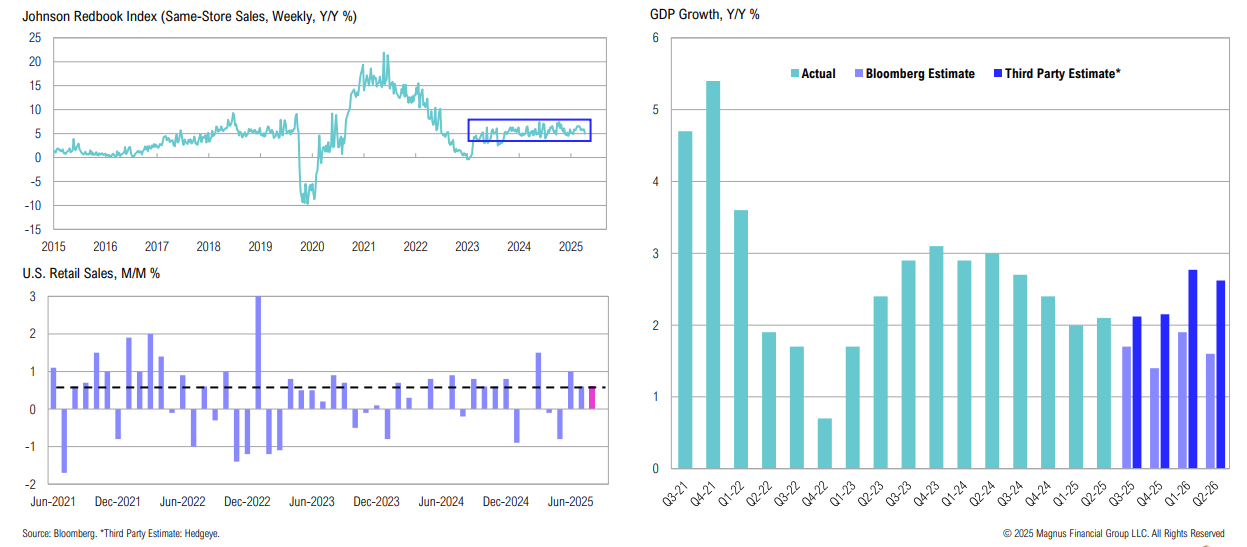
Economic Growth
Retail sales remain strong; estimates show economic growth improving in Q1’26
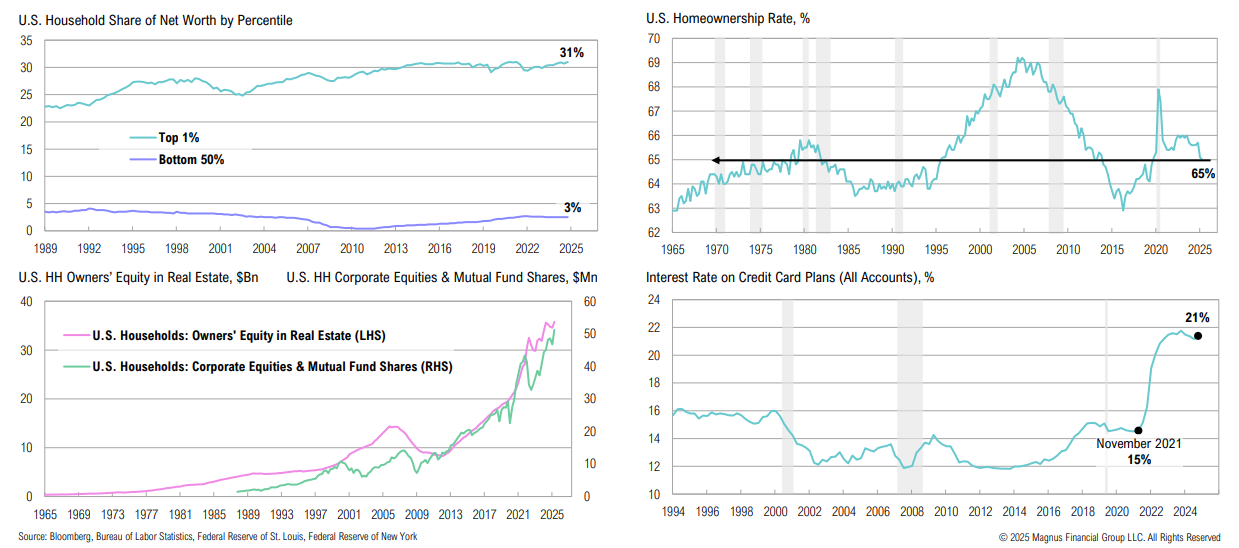
Consumer
The K-shaped economy: those with wealth tied to stocks and rising home values are doing well, while others are struggling with high rates and affordability issues
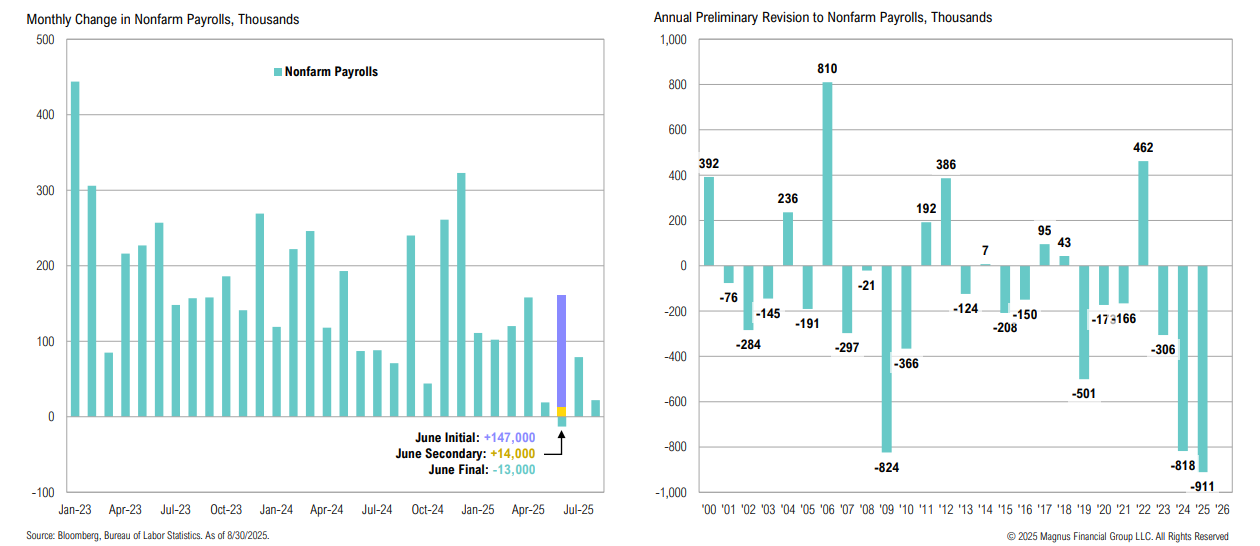
Labor Market
Recent notable downward revisions to labor market data (including the first monthly drop in employment since 2020) suggest the labor market is losing some momentum
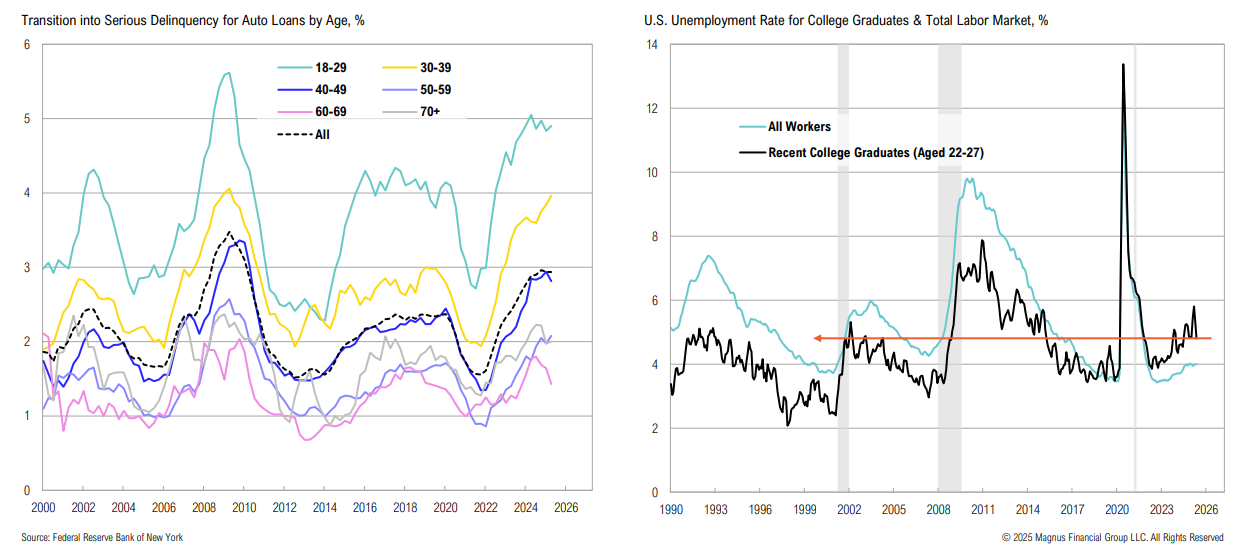
The collapse of First Brands and Tricolor highlights how rising auto loan delinquencies and weak consumer credit are rippling through the auto sector; delinquencies are highest among 18–29-year-olds, who also face elevated unemployment
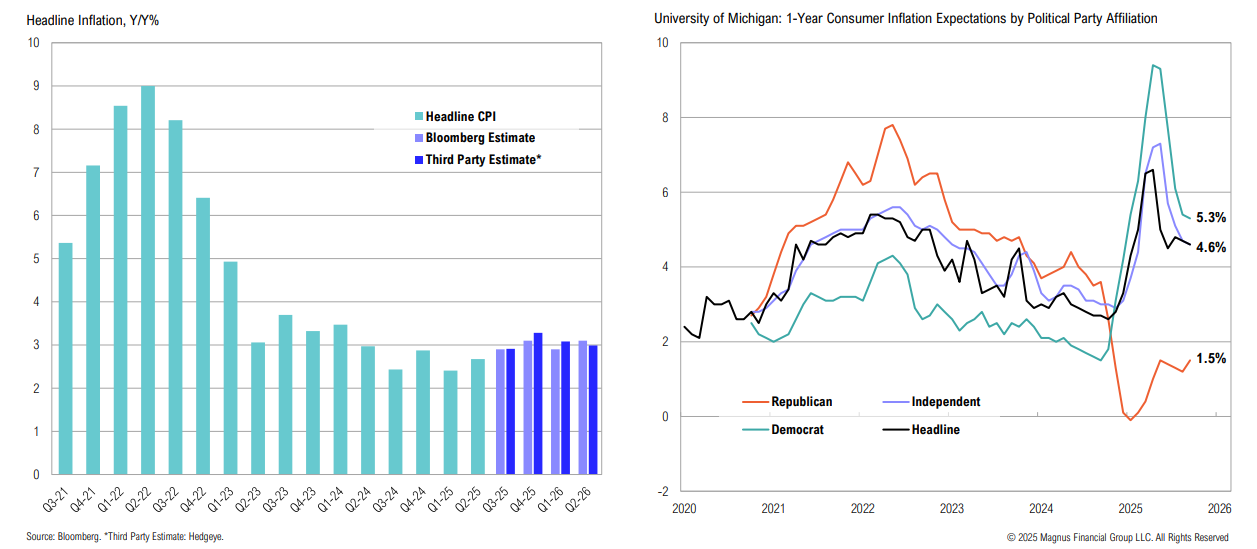
Fed Policy
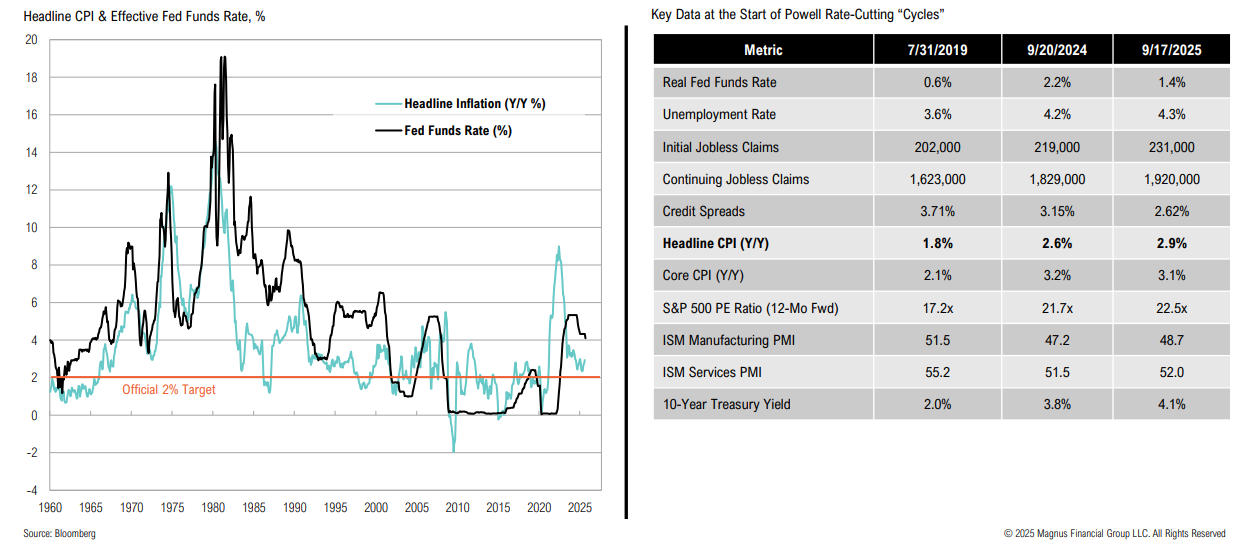
Inflation has been above the Fed’s official 2% target for 55 months and expectations are for it to remain there for the foreseeable future
The Powell Fed has cut rates twice with CPI >2%
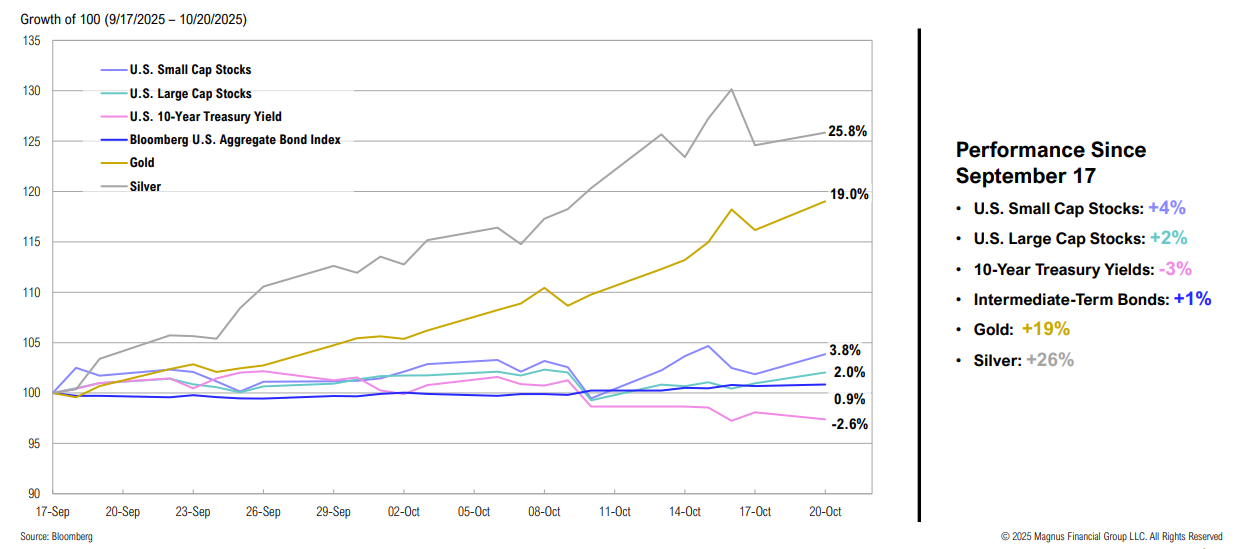
Since the Fed cut rates on September 17, markets have responded as if it were a meaningful pivot, with precious metals & small caps outperforming
U.S. Dollar
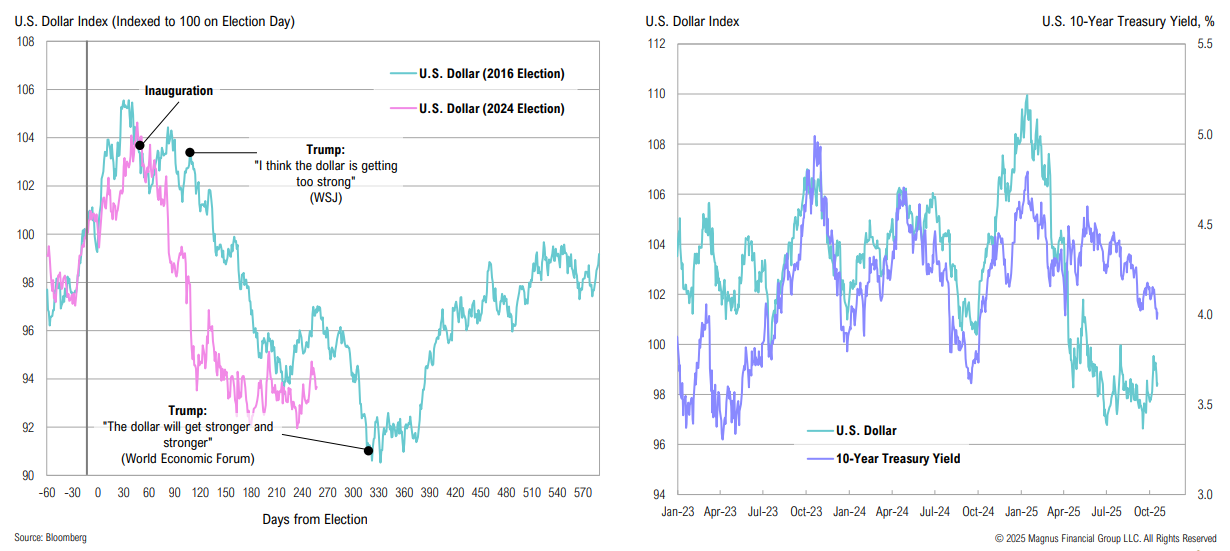
A weaker dollar is also part of Trump’s policy preference (boost U.S. exports, support domestic manufacturing); the U.S. Dollar Index reached a three-year low on September 16
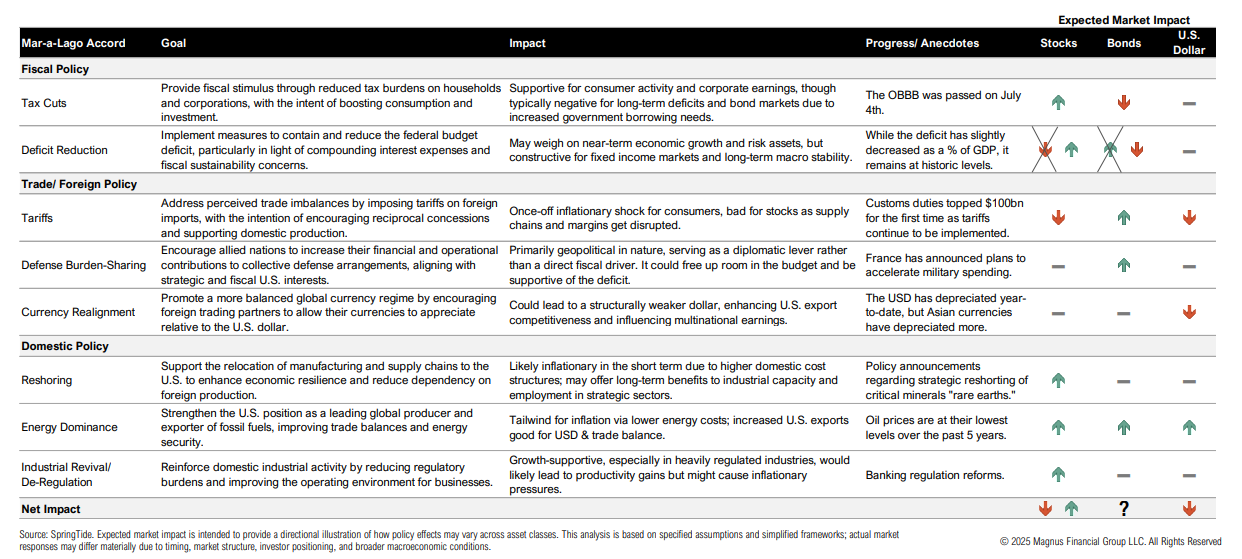
Mar-A-Lago Accord
Policy backdrop is mixed: several have the potential to be net positive for growth and risky assets over time, but almost all come with trade-offs and hinge on bond market ‘consent’
U.S. Large Cap Stocks
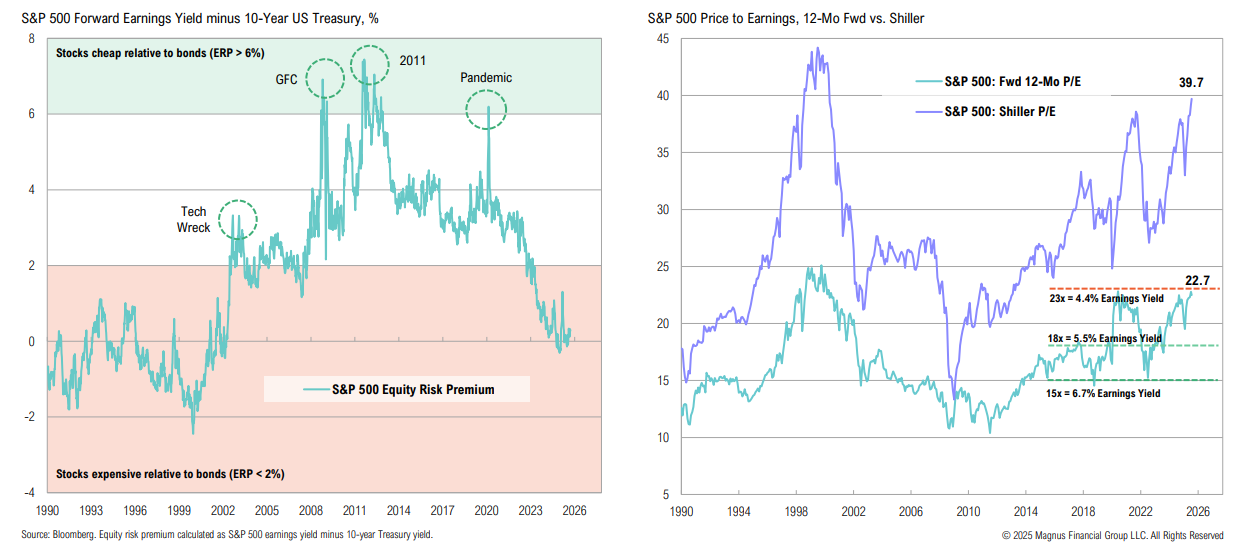
Using a simple yield-to-earnings yield comparison (ERP), U.S. stocks are less attractively priced vis-à-vis bonds than at any point since the 1990s; U.S. large cap valuations are nearing extremes
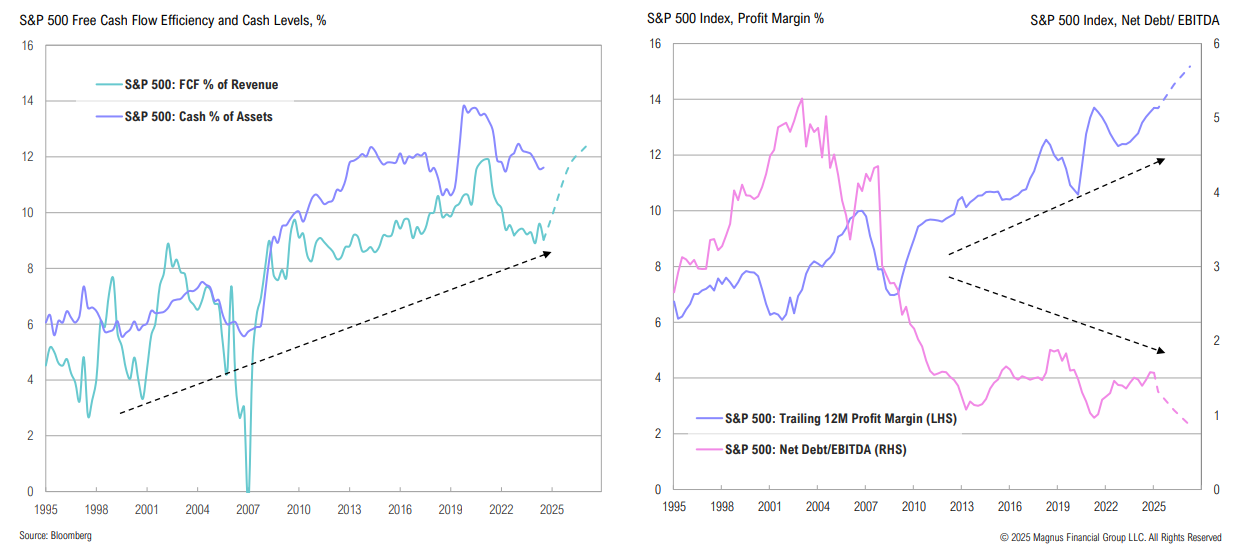
The corporate sector is strong by historical standards: capital expenditures, R&D, and tech investment have boosted scalability and efficiency, enabling improved margins and reducing debt
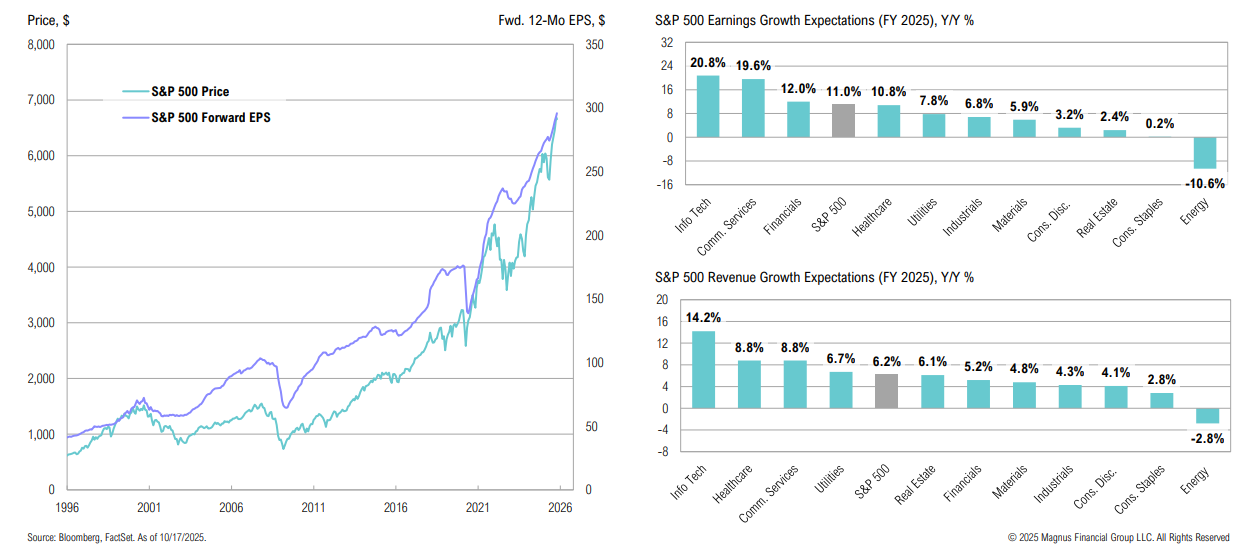
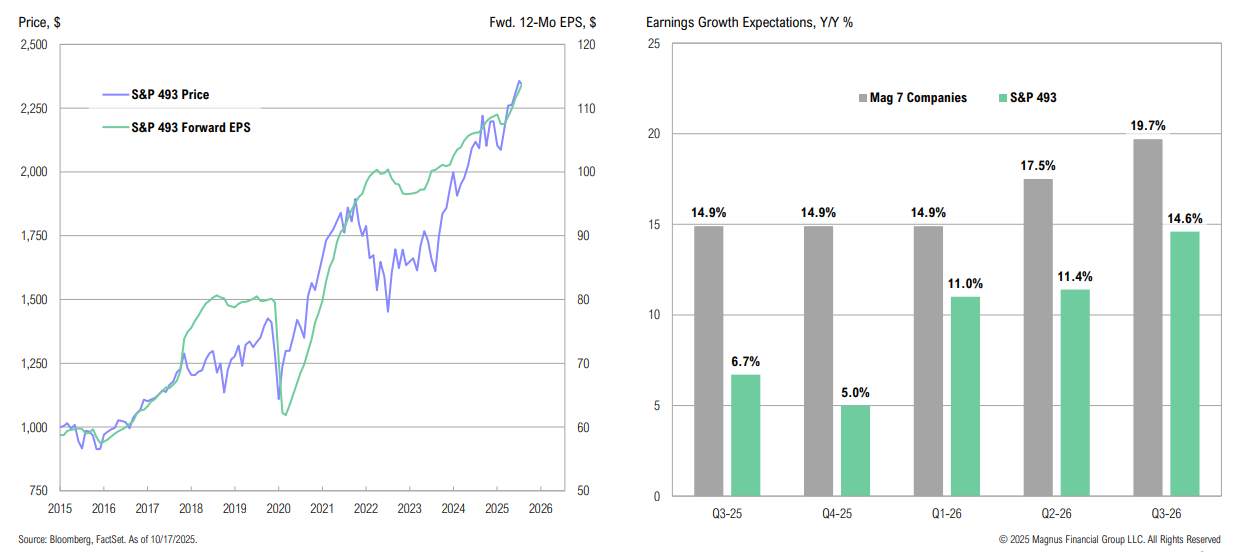
Stock prices tend to follow earnings—and both have been on an upward trajectory; strong earnings growth, particularly in tech, has been supported by revenue growth
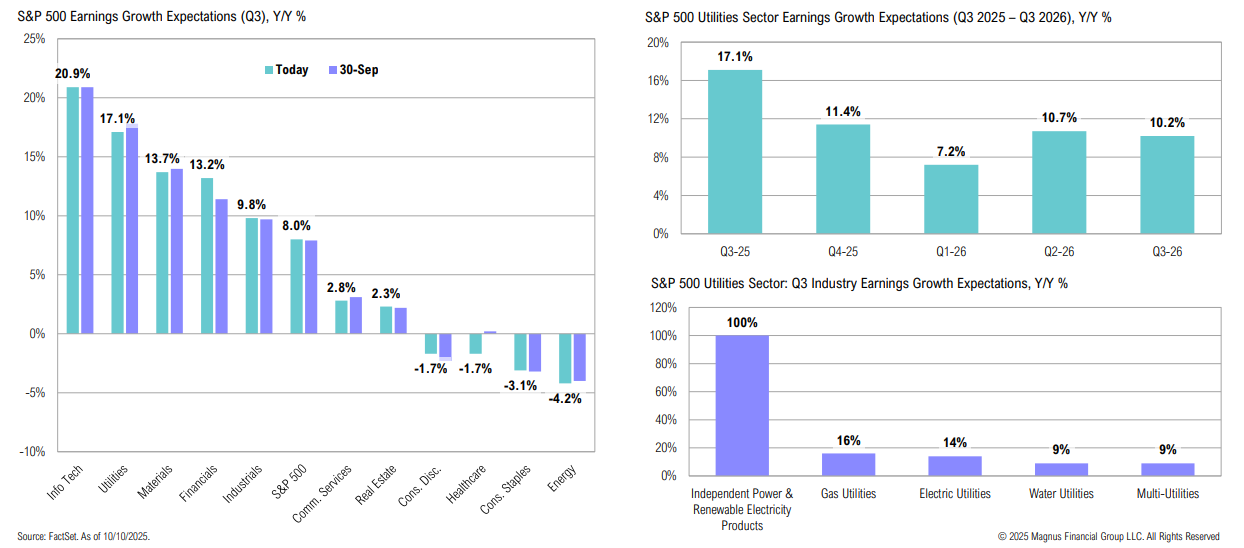
The utilities sector is expected to report the second-highest Q3 earnings growth rate (17.1%) of all 11 S&P 500 sectors, second only to tech
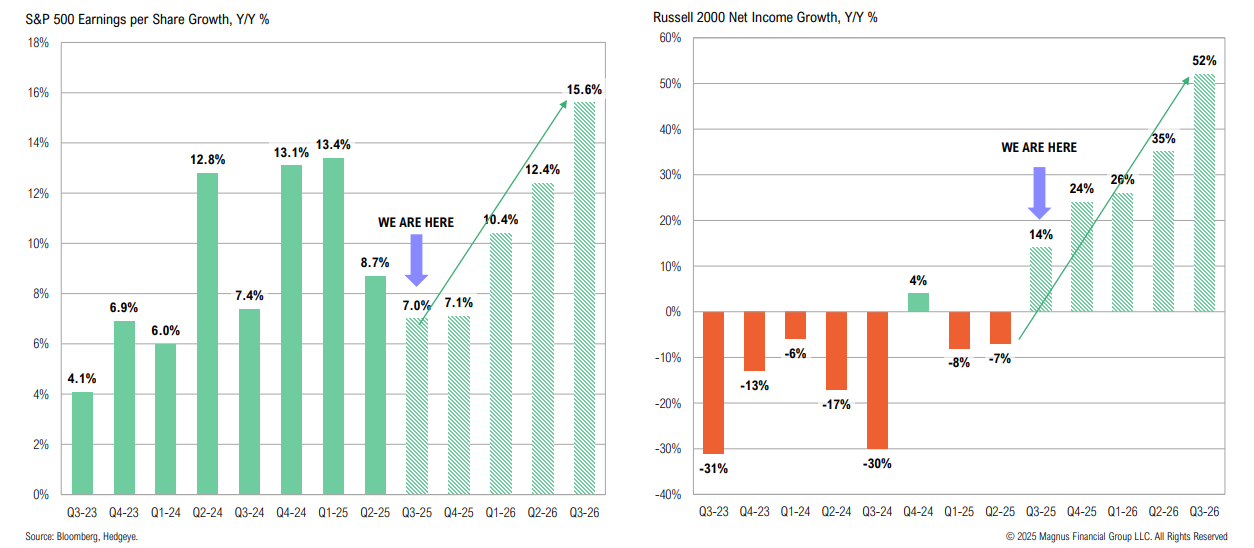
The Magnificent 7 remain key contributors to S&P 500 earnings growth, but their growth divergence from the rest of the market is expected to narrow into 2026
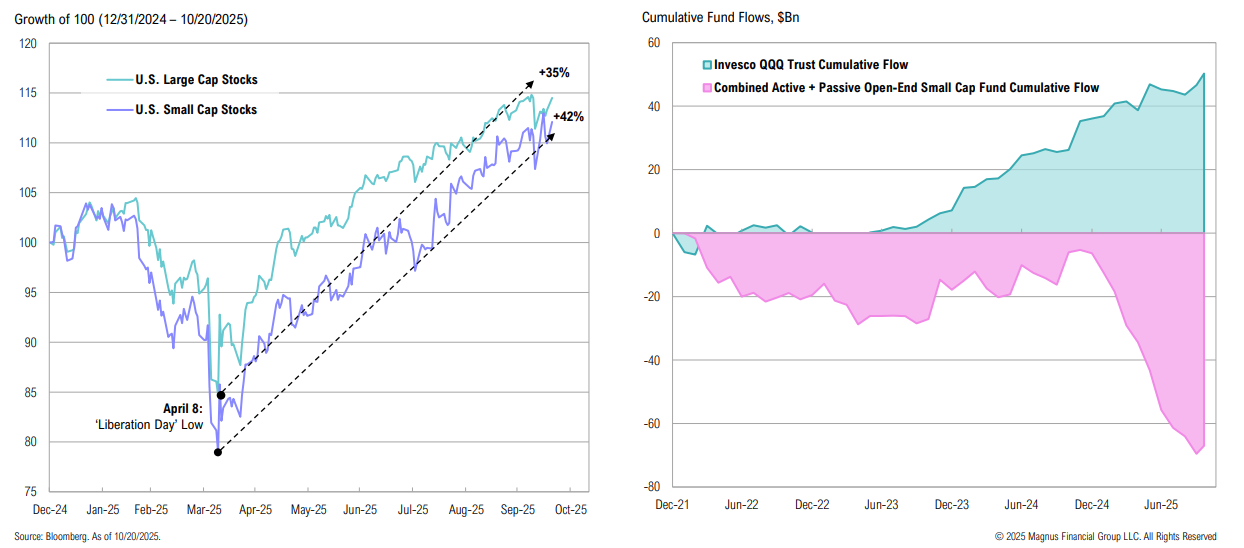
Is the stock market broadening just beginning?
Small cap stocks have outperformed large caps since the April 8 lows (by 7%); YTD, open-end small cap funds have seen $61Bn in outflows, while QQQ alone has seen $14bn in inflows
Innovation
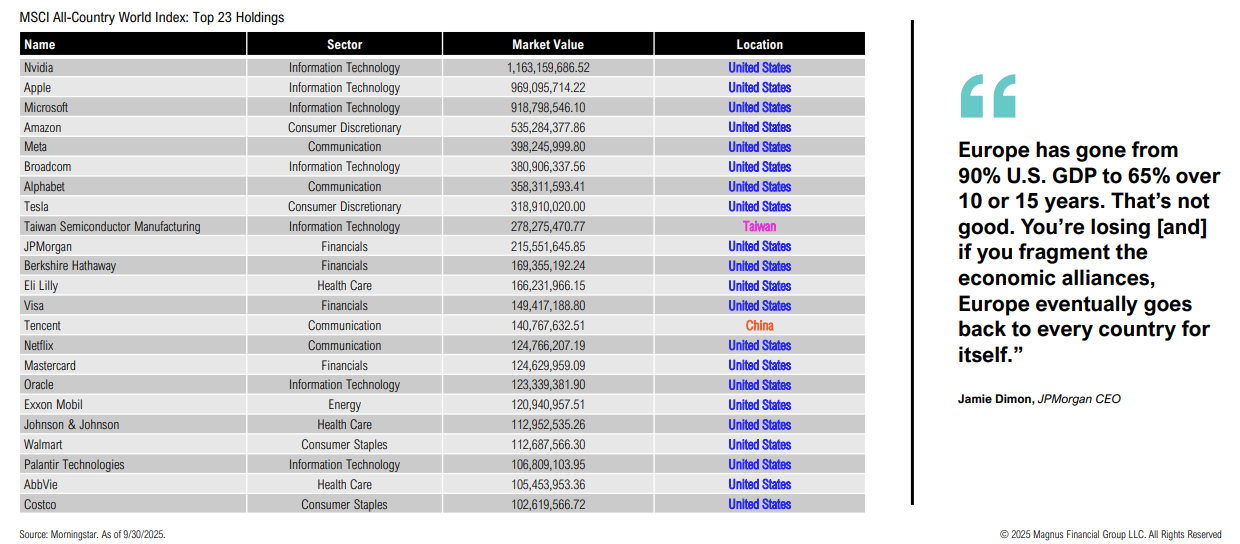
Capital flows to where it is treated best; the list of largest companies in the world is a reminder of where innovation is rewarded
AI
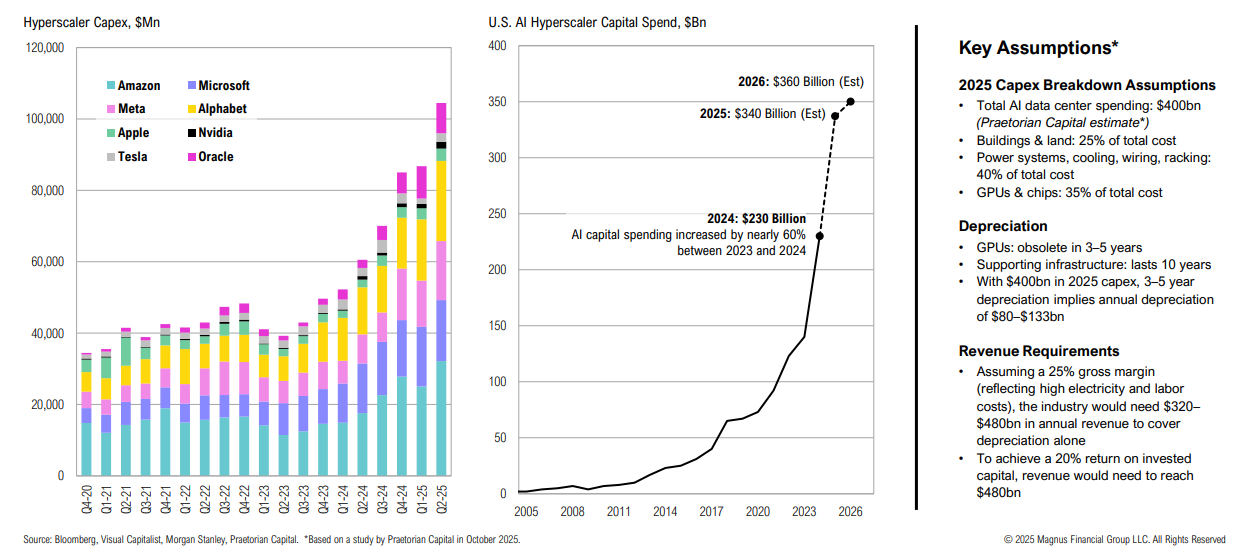
Estimates show the AI industry would need to generate $320bn or more in annual revenues for at least a decade just to break even on 2025’s capex investment—more than 10x current AI revenue levels
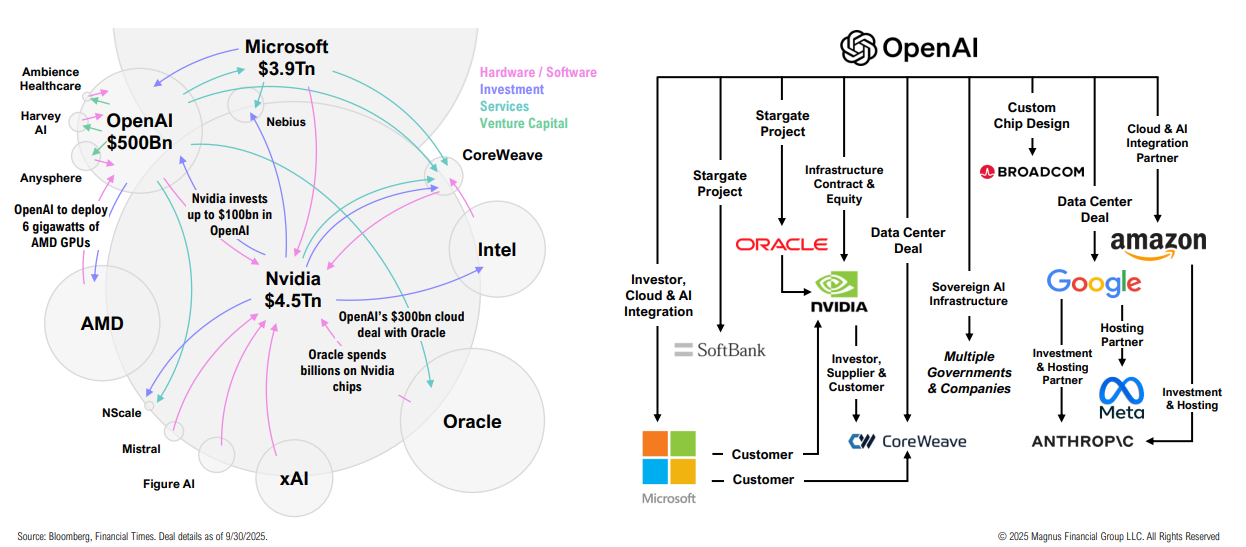
The circular nature of AI investments:
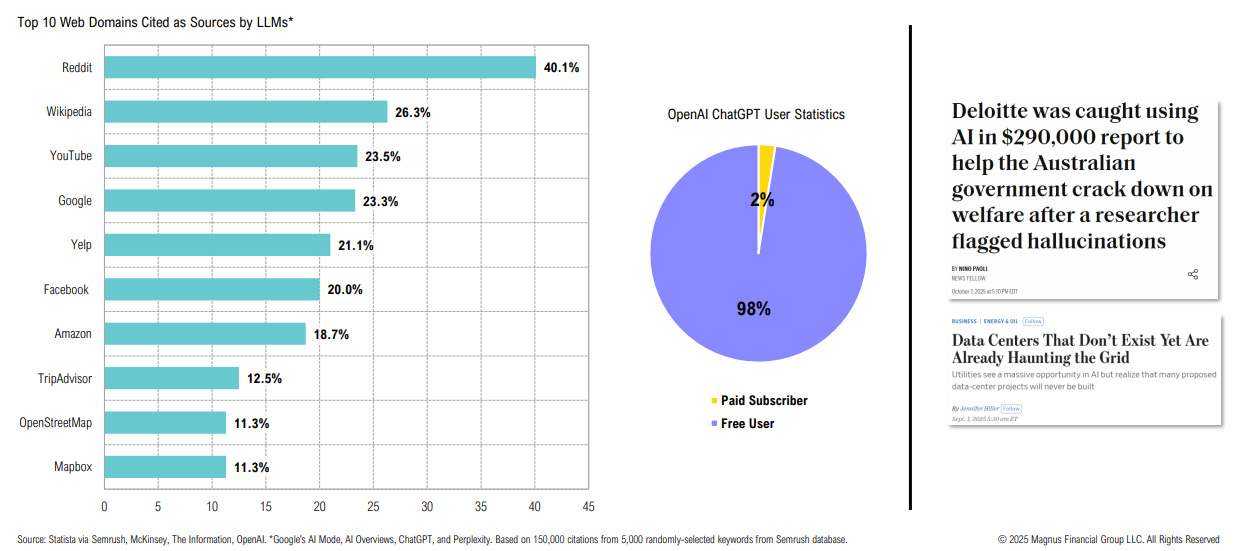
Despite the hype, there are some use concerns about LLMs such as ChatGPT (including source reliability); only 2% of all ChatGPT users pay for the service
Global Valuations
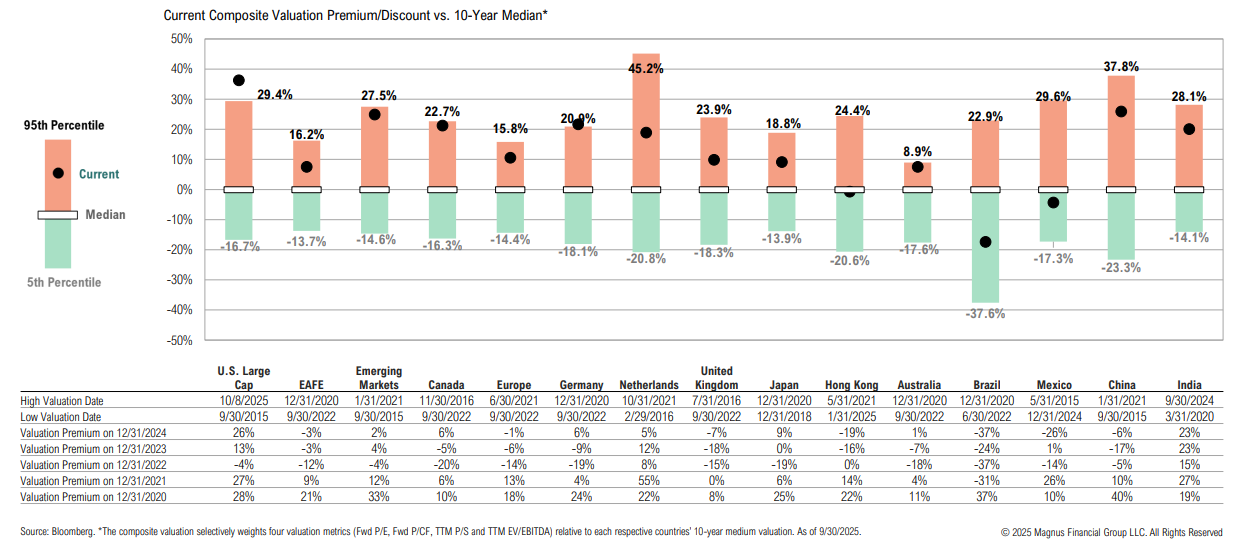
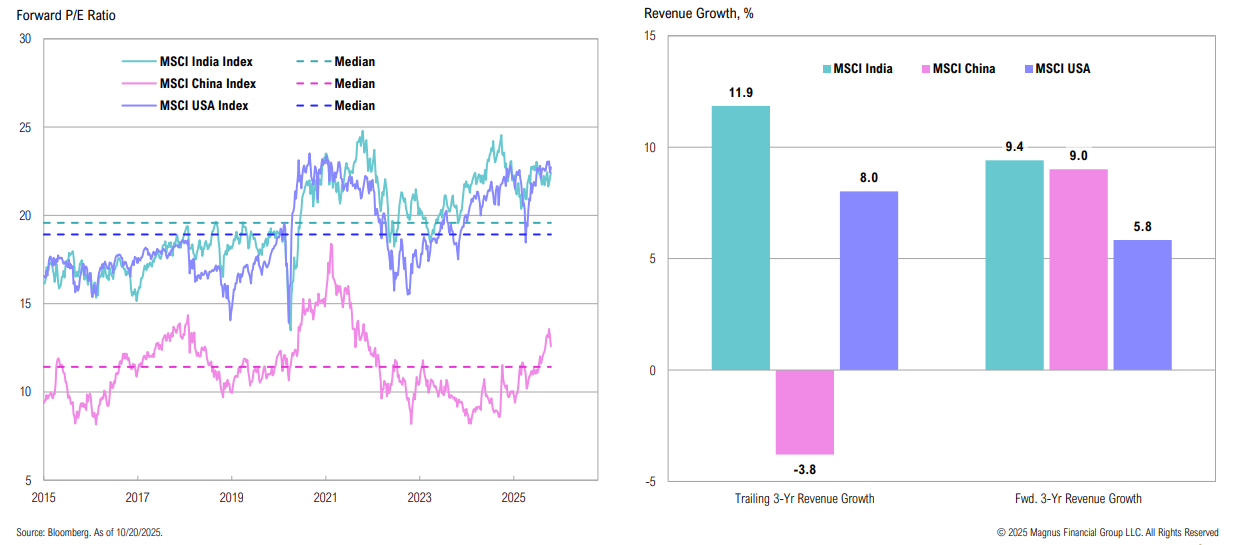
U.S. large cap stocks have reached a new 10-year high valuation; Brazil & Mexico are the only countries trading below median, with Hong Kong at median valuations
Emerging Markets
While India and China both trade above their 10-year average valuations, they remain attractive relative to the U.S., given stronger growth expectations in both regions
U.S. Healthcare
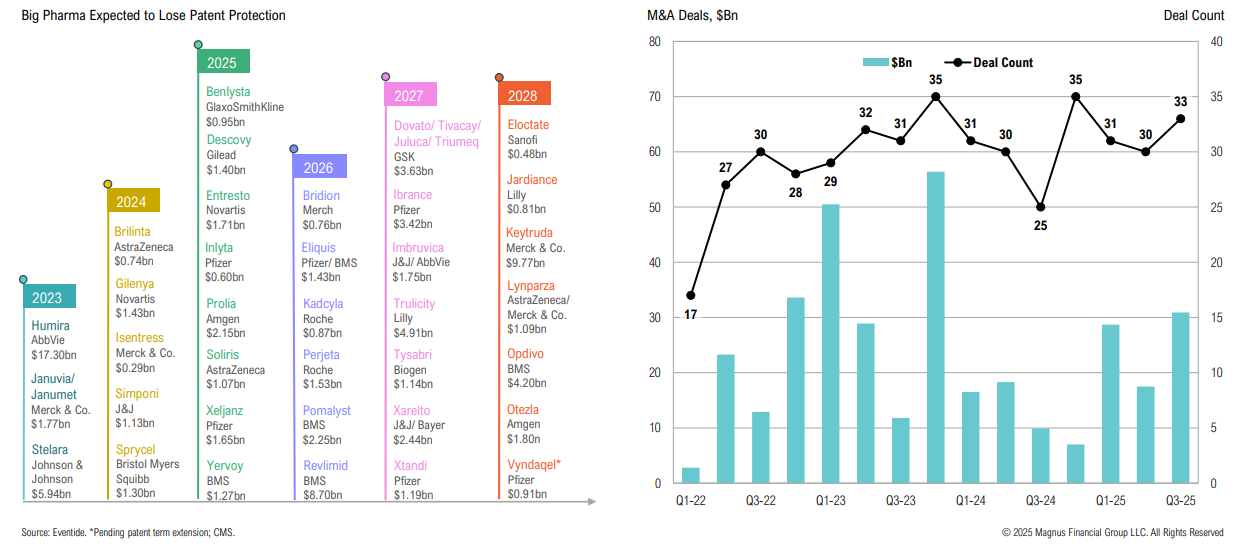
Big pharma faces a “patent cliff” which could impact more than $200Bn in annual revenue by 2030, which could position the biotech sector for further M&A activity
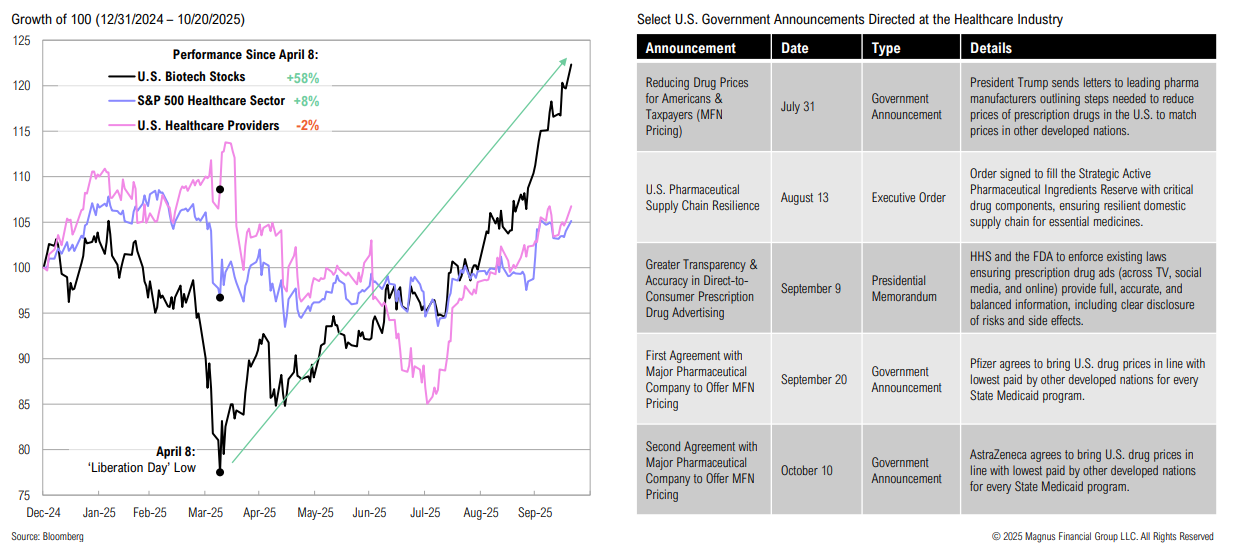
Biotech stocks have gained nearly 60% since the April 8 lows, far outpacing the broader healthcare sector, which continues to face pressure amid regulatory and market developments
Leveraged ETFs
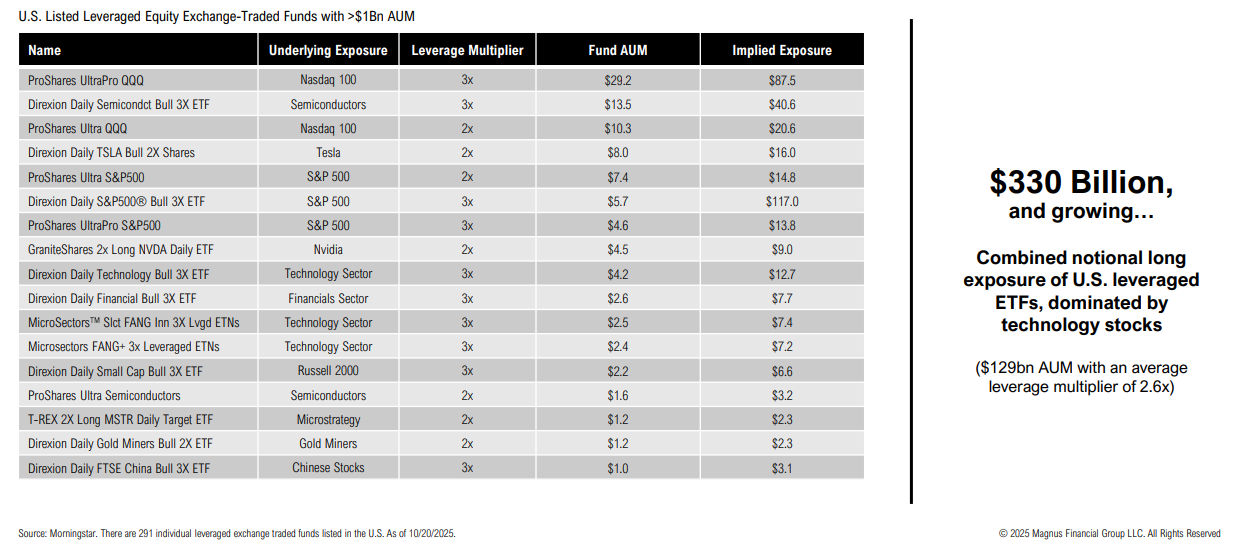
Key risk: leveraged ETFs have >$300bn in notional long exposure
Corporate Yields
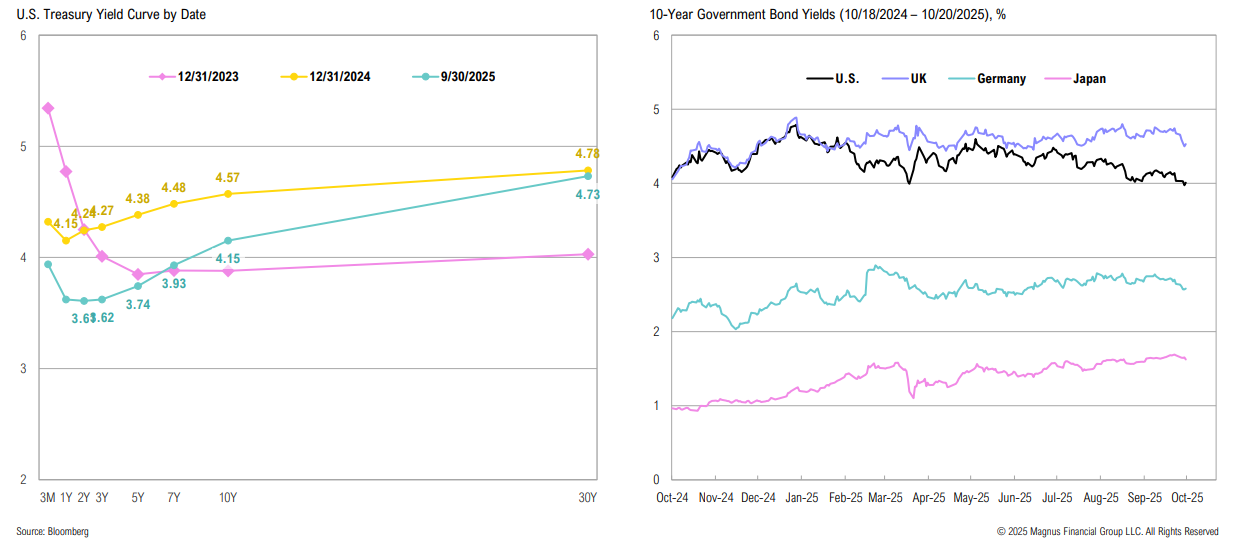
Since the start of the year, U.S. Treasury yields have fallen across all maturities; U.S. bonds are one of the few among developed markets with yields lower today than a year ago
Yield Curve
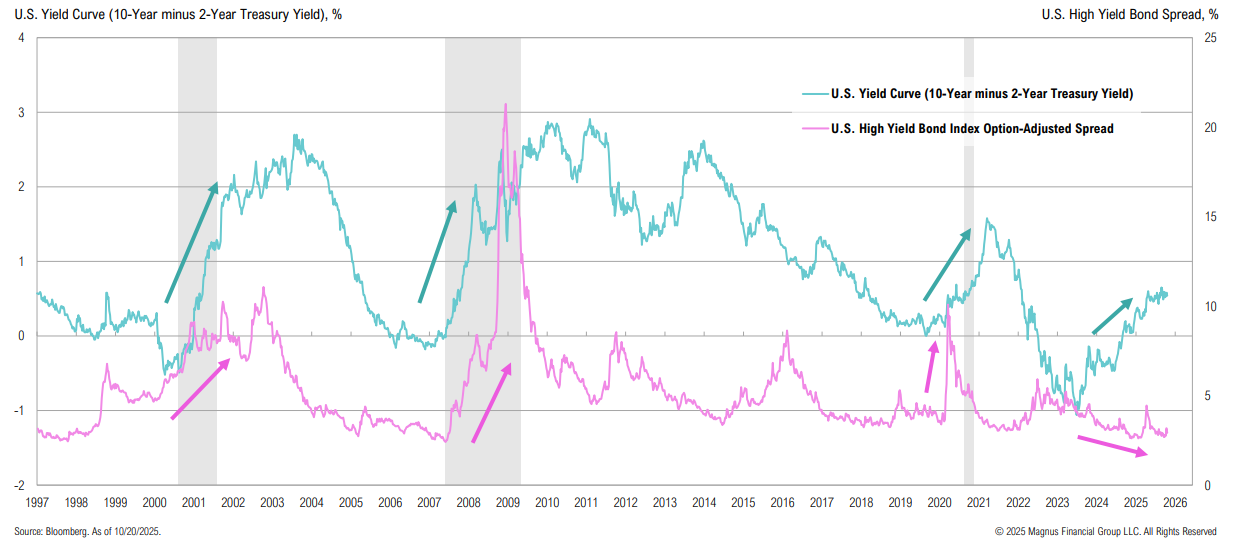
While the yield curve continues to steepen, credit spreads remain low by any longterm standard, even despite the recent uptick (driven by renewed trade war concerns)
SOMA Account
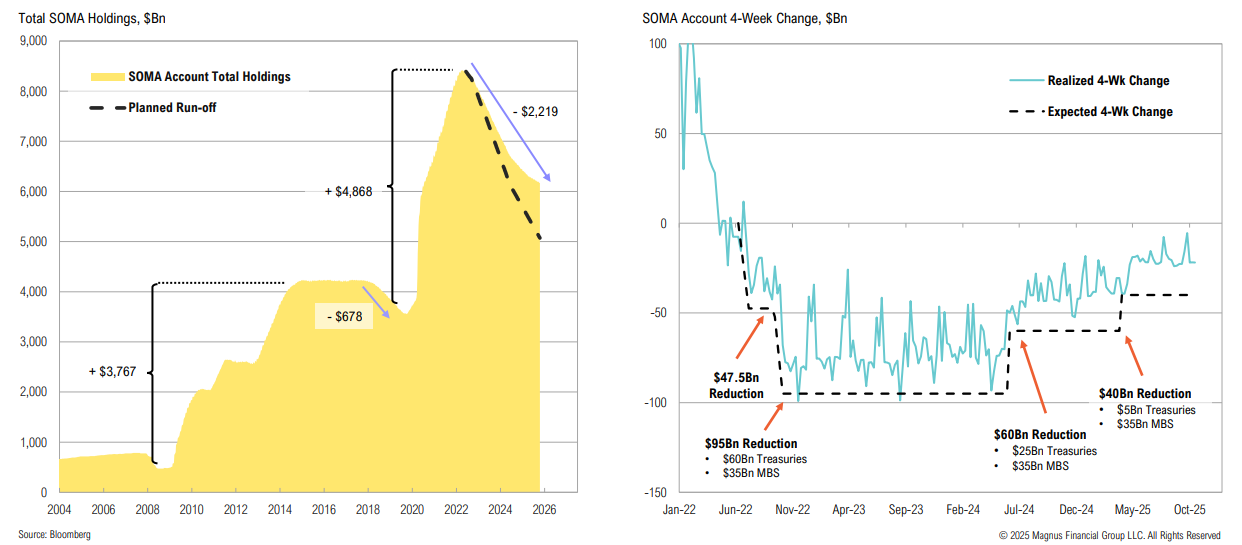
Since April 1, the Fed has slowed QT from $60 billion to $40 billion, with a maximum Treasury runoff of $5 billion per month
BDCs
Median discounts across the BDC universe widened over the quarter, providing compelling pockets of value
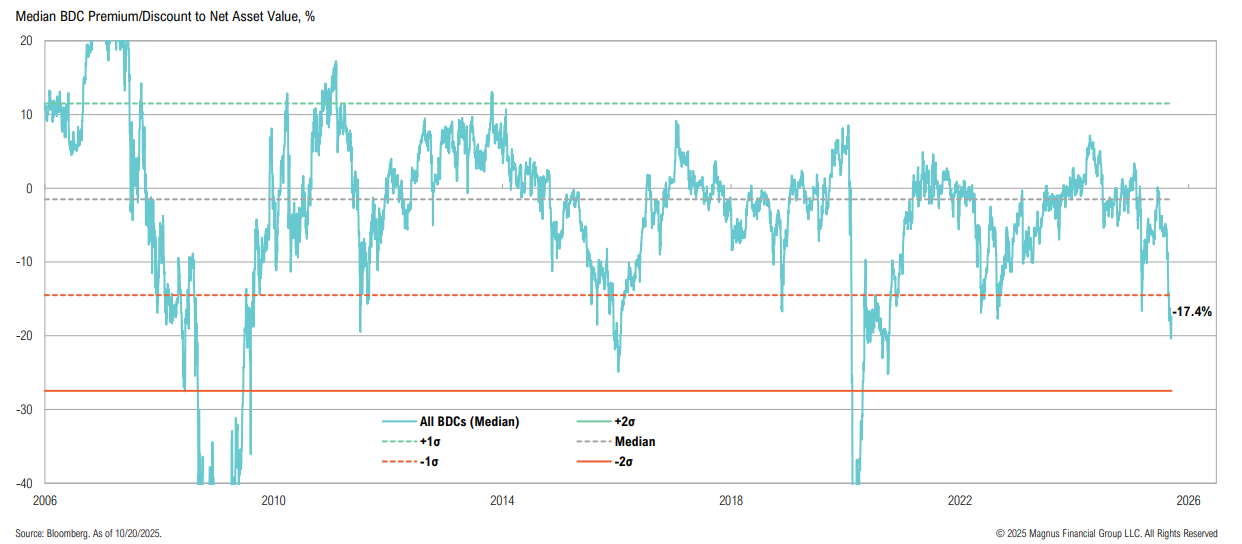
While BDC discounts have historically been more volatile than leveraged loan spreads, the current disconnect is unprecedented
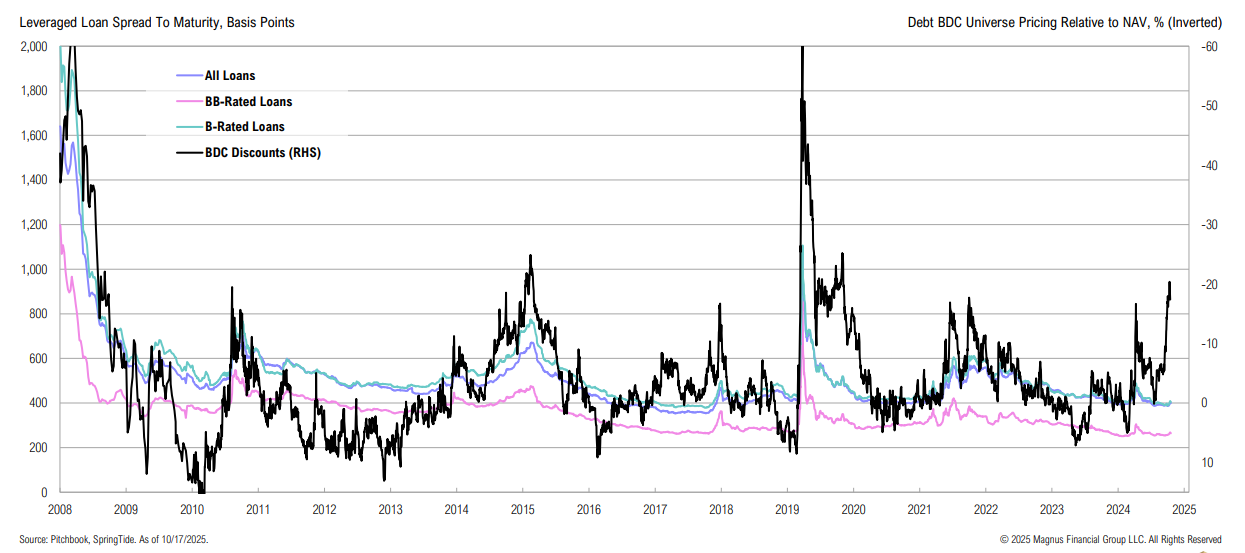
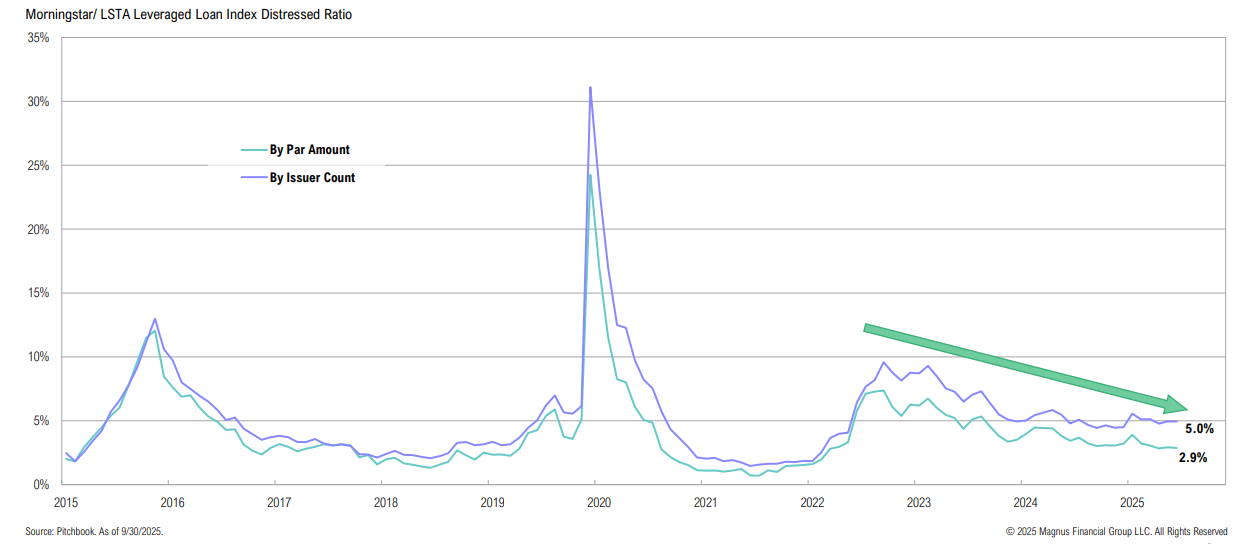
Granular data about the leveraged loan market suggests that credit appears healthy
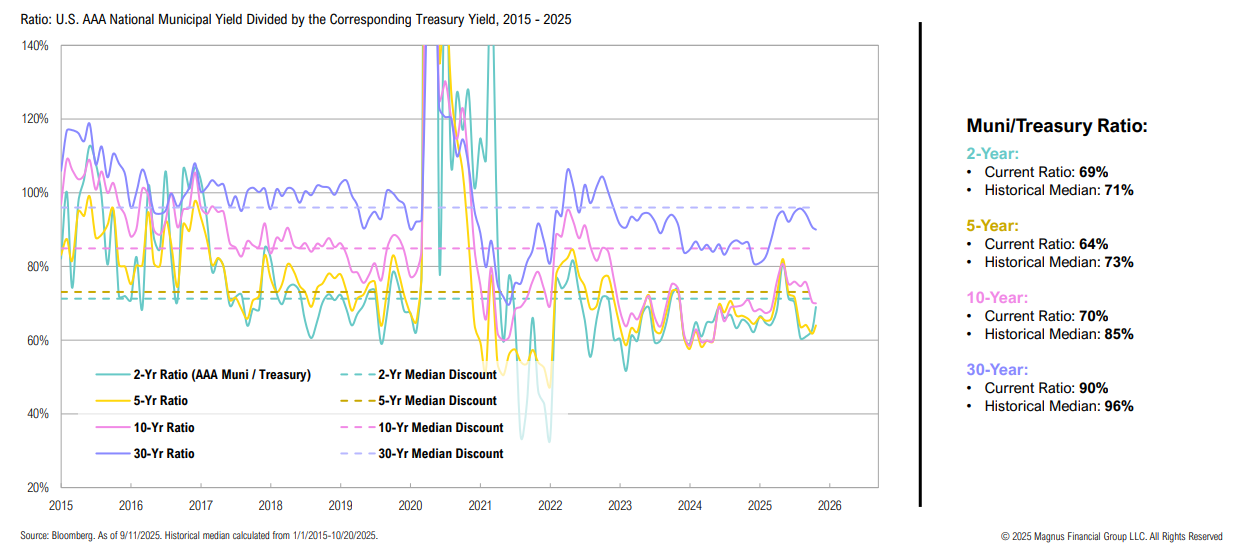
Municipal Yields
National municipal yield spreads to Treasuries are currently below their 10- year median levels but remain attractive on a tax-adjusted basis
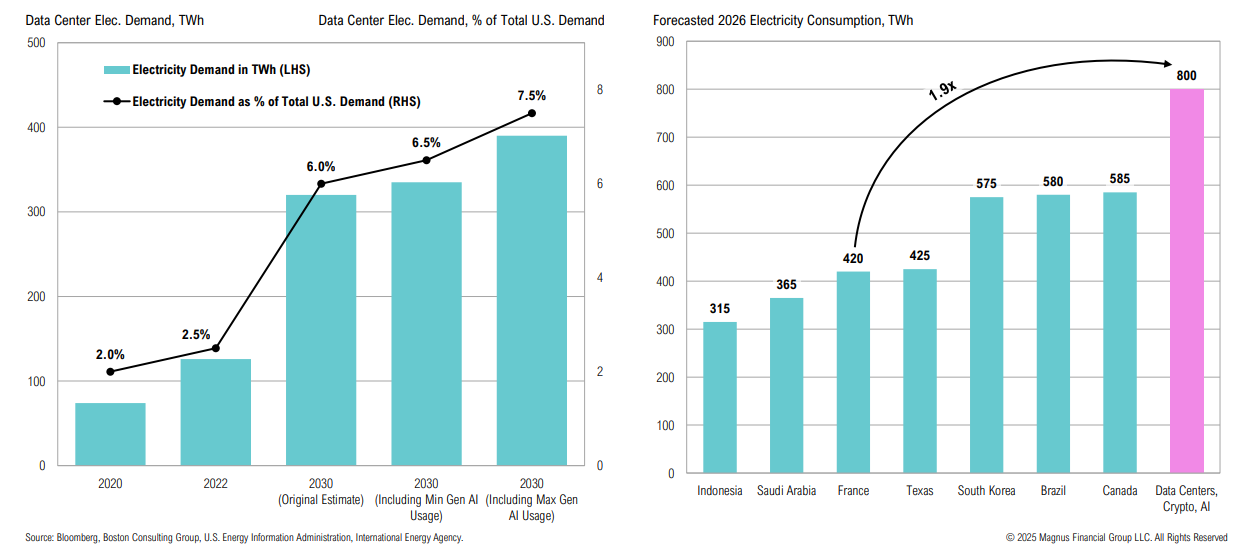
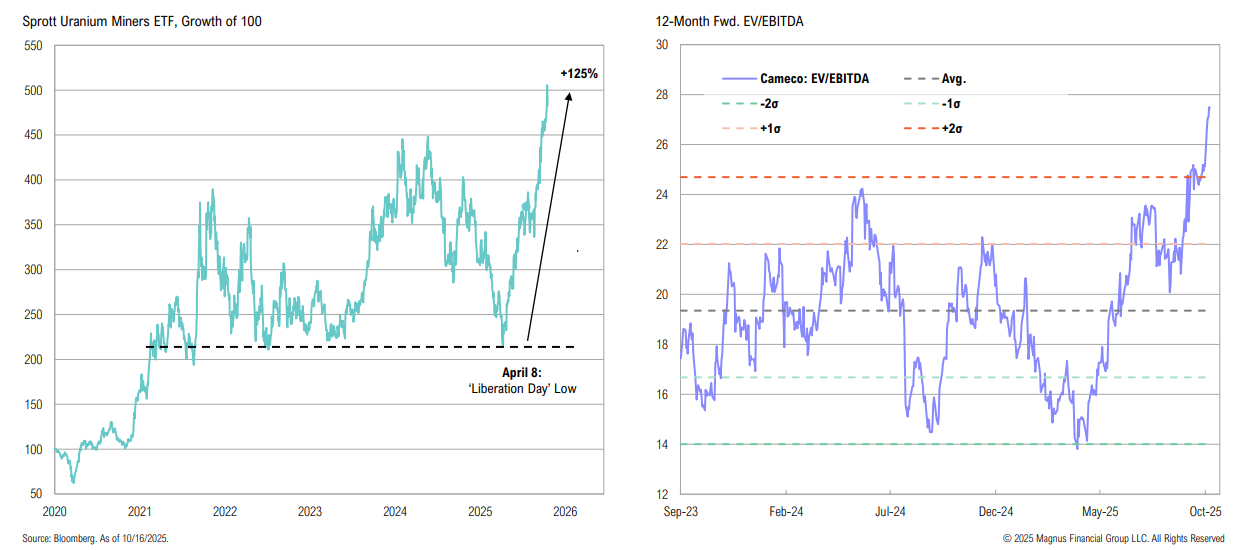
Power Play
AI and data centers are expected to drive U.S. power demand; in 2026, global data centers + AI + crypto energy consumption is estimated to be nearly double that of France
Uranium and nuclear stocks have rallied >125% from the “Liberation Day” lows, driven by strong sentiment, solid fundamentals, and ongoing policy support; while the long-term thesis remains intact, valuations appear stretched
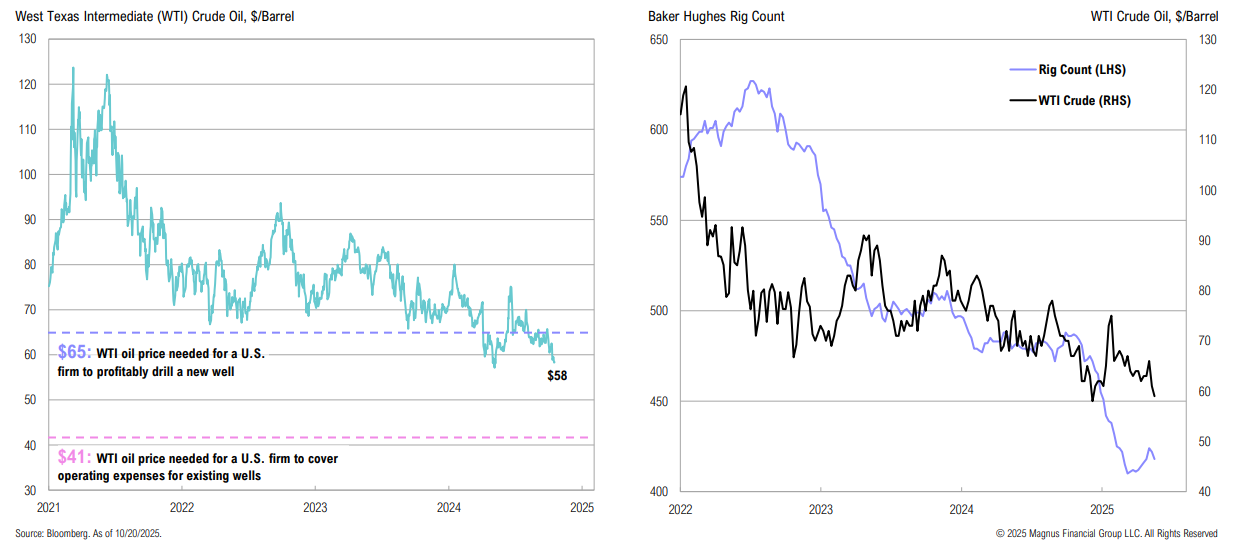
WTI Crude
At $58 per barrel, WTI crude is below the level needed for a U.S. firm to profitably drill a new well; rig counts are near the lowest levels in at least three years
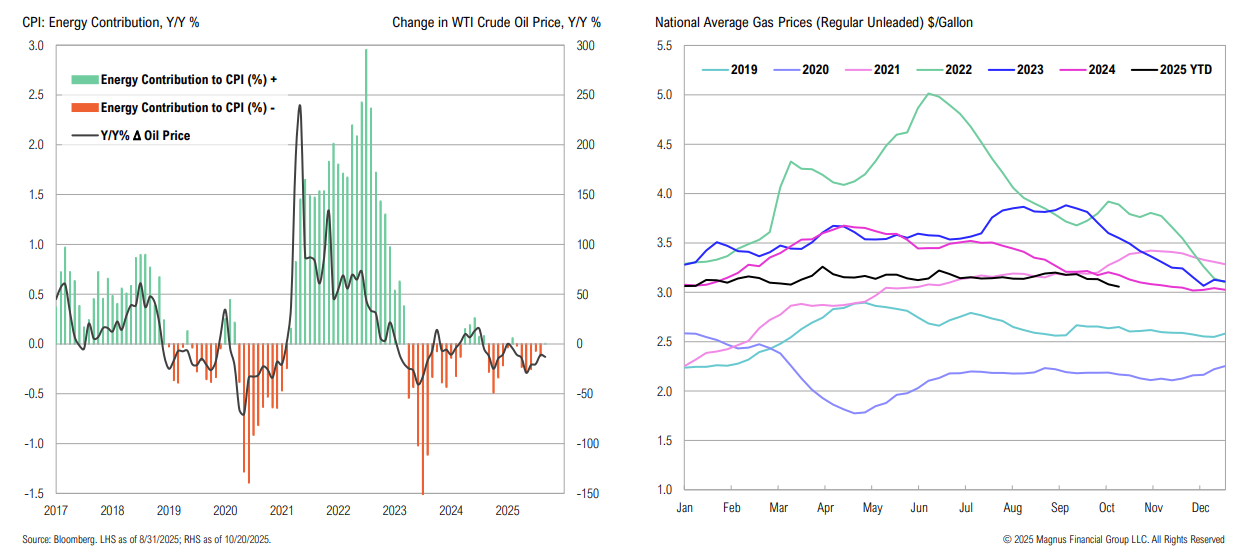
Low oil prices = lower gas prices; lower energy prices detract from CPI
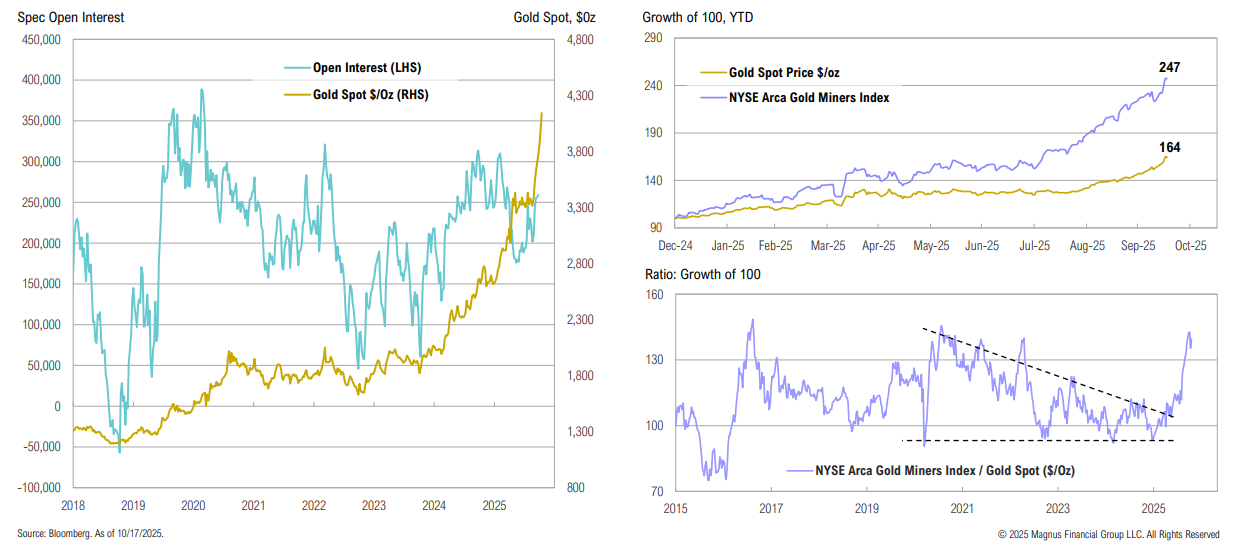
Precious Metals & Gold
Despite record gold prices, spec positioning remains below recent peaks (albeit no new data since the government shutdown); while gold miners have seen strong YTD outperformance, fundamentals remain constructive
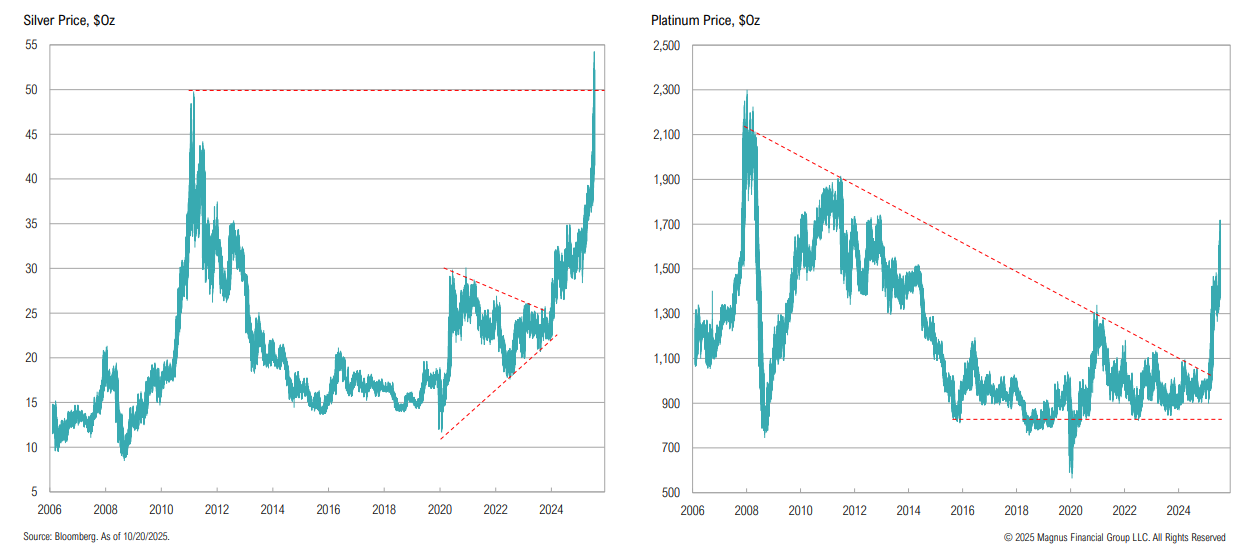
Both silver and platinum have experienced a major breakout; silver has broken through its 2011 high, while platinum remains 35% below the 2008 peak
Copper
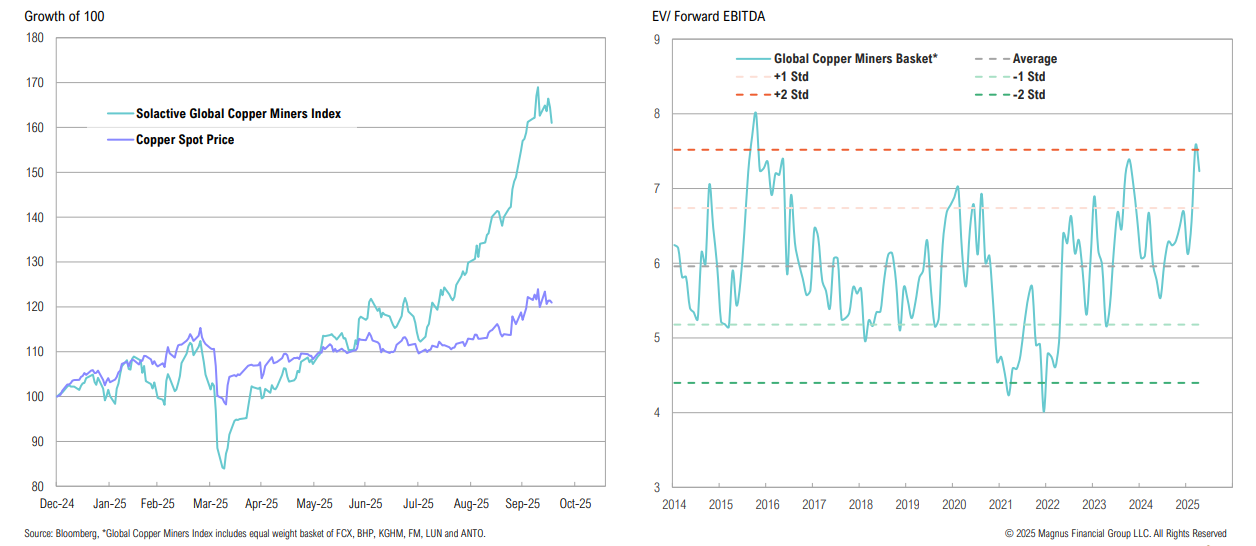
Copper prices are ‘only’ 20% higher since the start of the year, yet miners have rallied more than 60%; despite the constructive backdrop, copper miner valuations are looking stretched
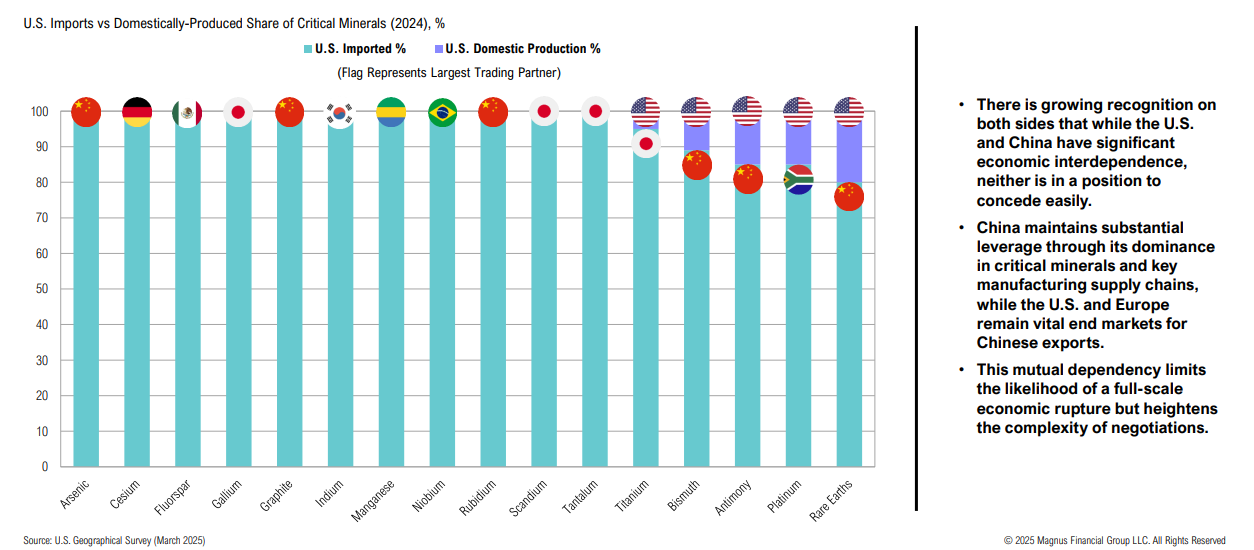
Critical Minerals
The U.S. government has been offering both policy support for the domestic critical minerals industry and taking strategic stakes in various businesses in efforts to reshore the domestic supply chain
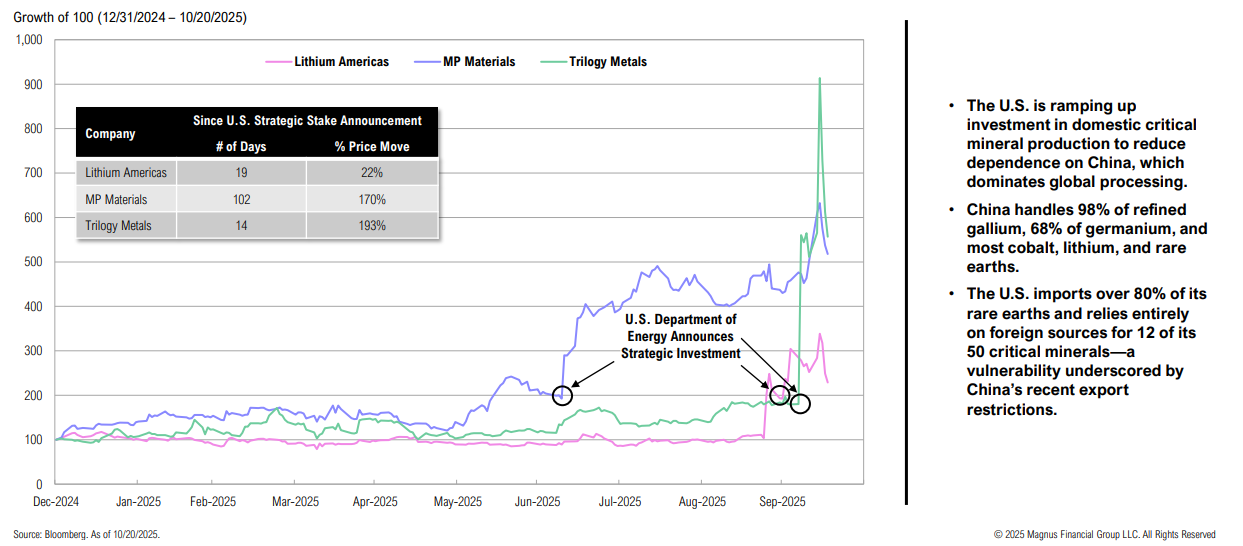
President Trump and Chinese President Xi Jinping are expected to meet at the end of this month to seal a ‘fair’ trade deal; critical minerals will be a significant part of the deal
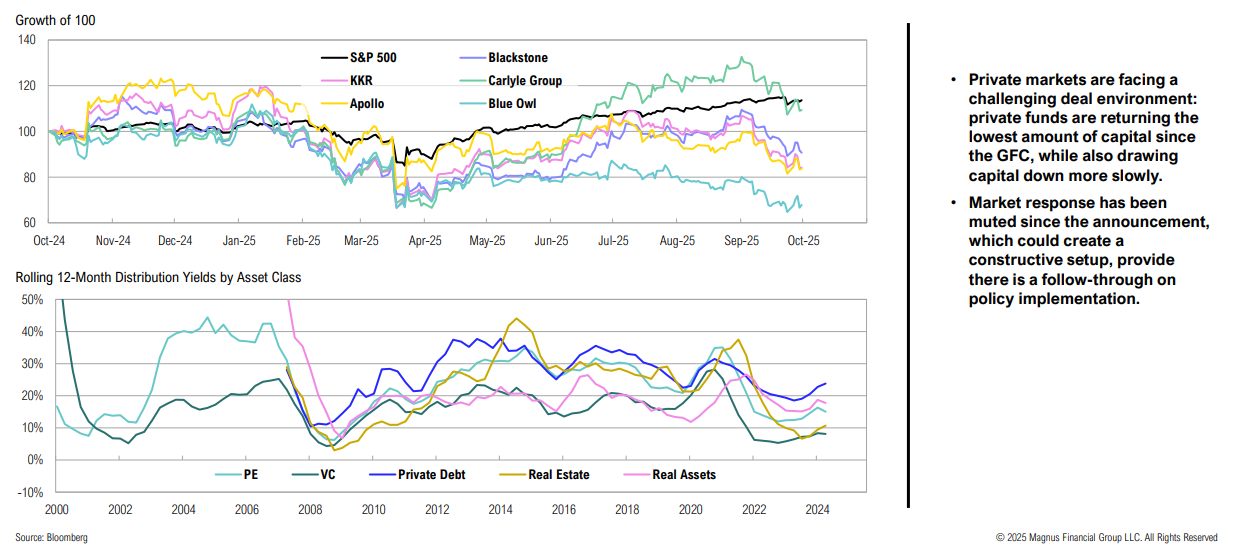
Private Markets
On August 7, 2025, President Trump signed an Executive Order aimed at broadening retirement investment options by easing restrictions on 401(k) plans to invest in alternative investments
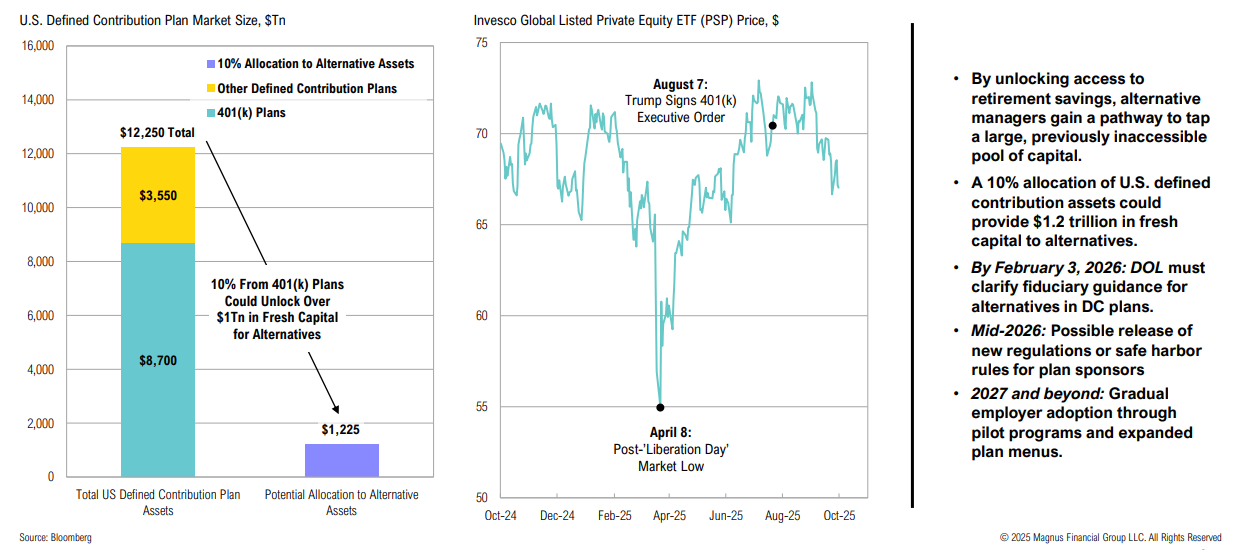
The executive order effectively opens the door for partnerships between traditional and alternative managers—a development that could help private markets
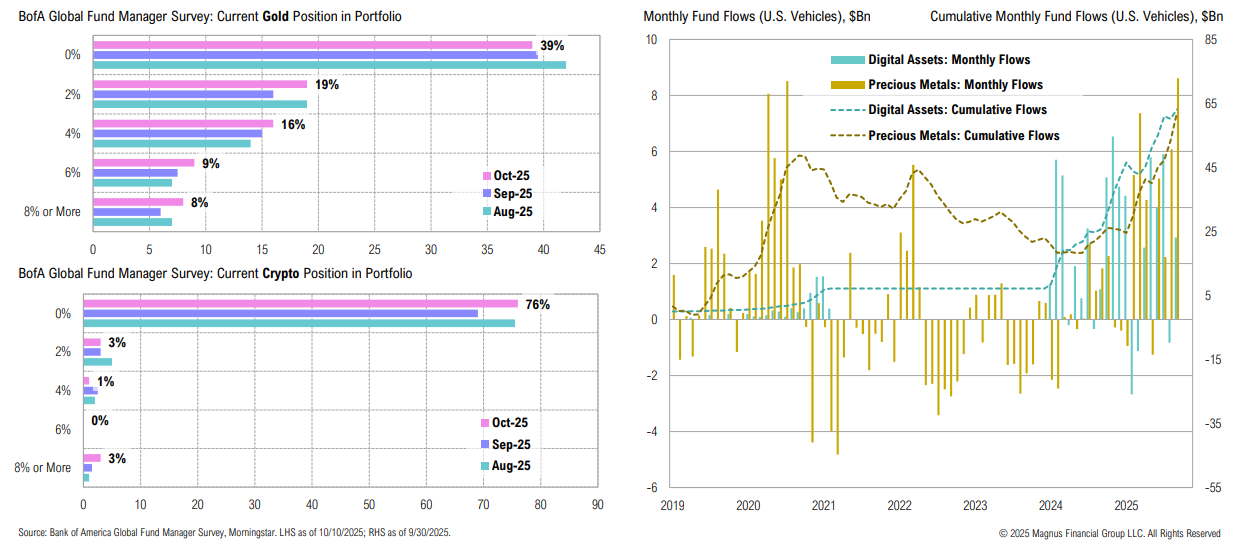
Gold & Bitcoin
Gold and bitcoin (which share several key characteristics) both continue to have limited allocations in portfolios, despite recent increase in ETF flows
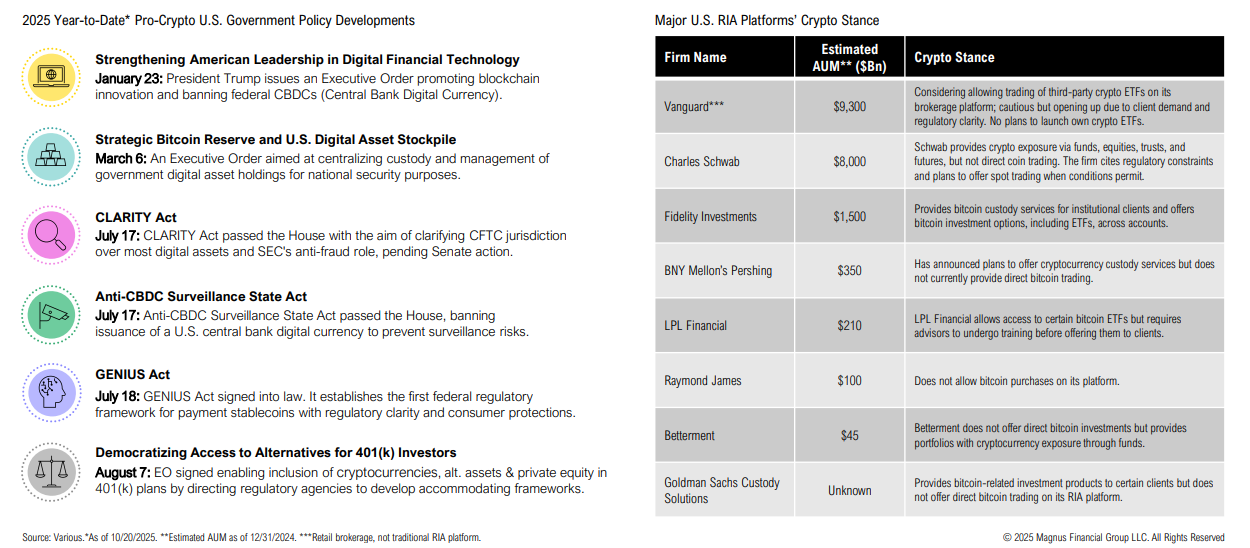
Cryptocurrencies
As the pro-crypto government advances clearer regulations, major U.S. RIAs and investment platforms have started to ease their stance on crypto
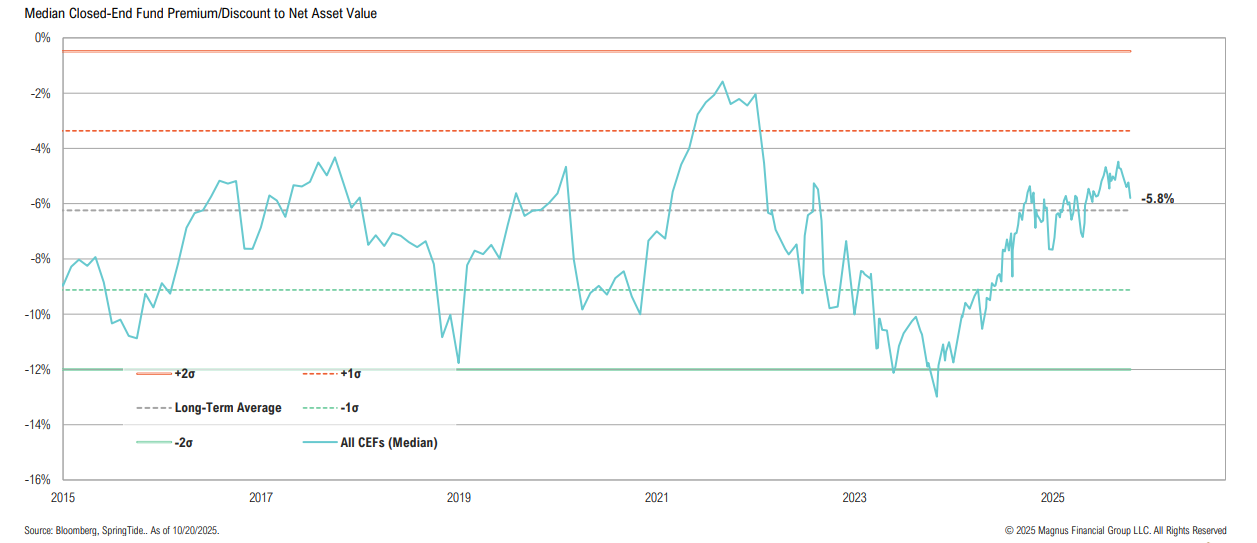
CEFs
Although median discounts across the closed-end fund universe remain relatively tight, we continue to find compelling pockets of value
CMEs
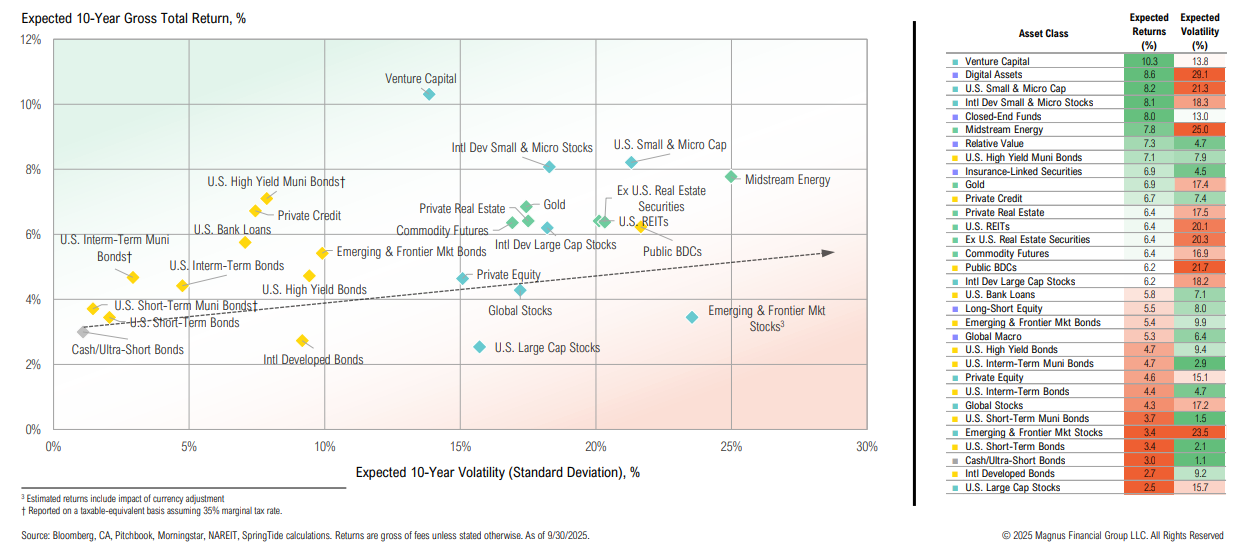
With equity valuations expanding and yields falling, longer-term U.S. return assumptions have declined marginally
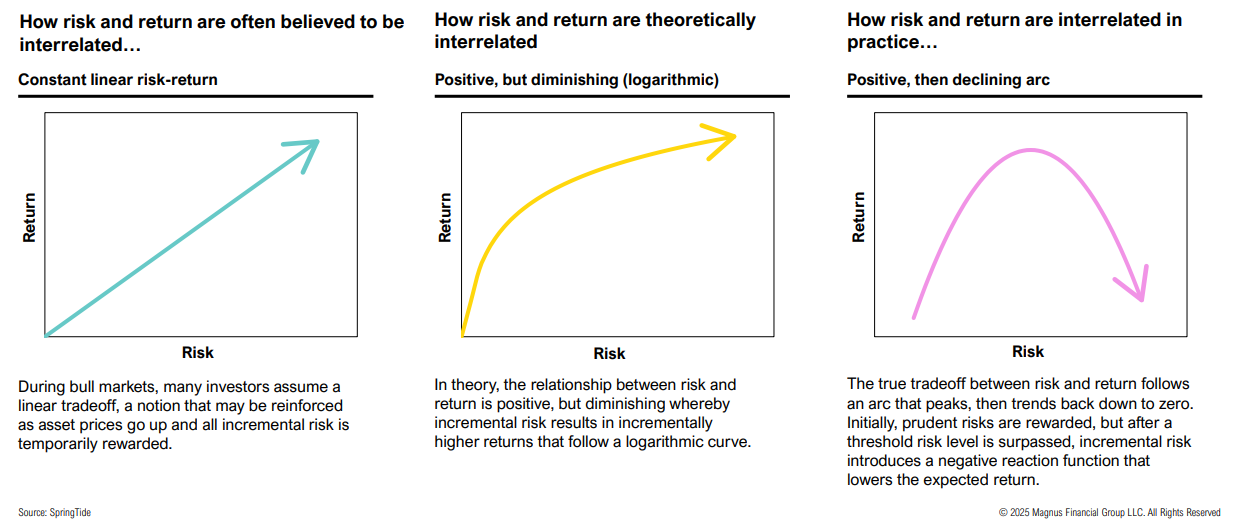
Education
Setting a strategic risk tolerance is about finding the optimal level of risk that can operationally and emotionally be assumed without incentivizing harmful behavior
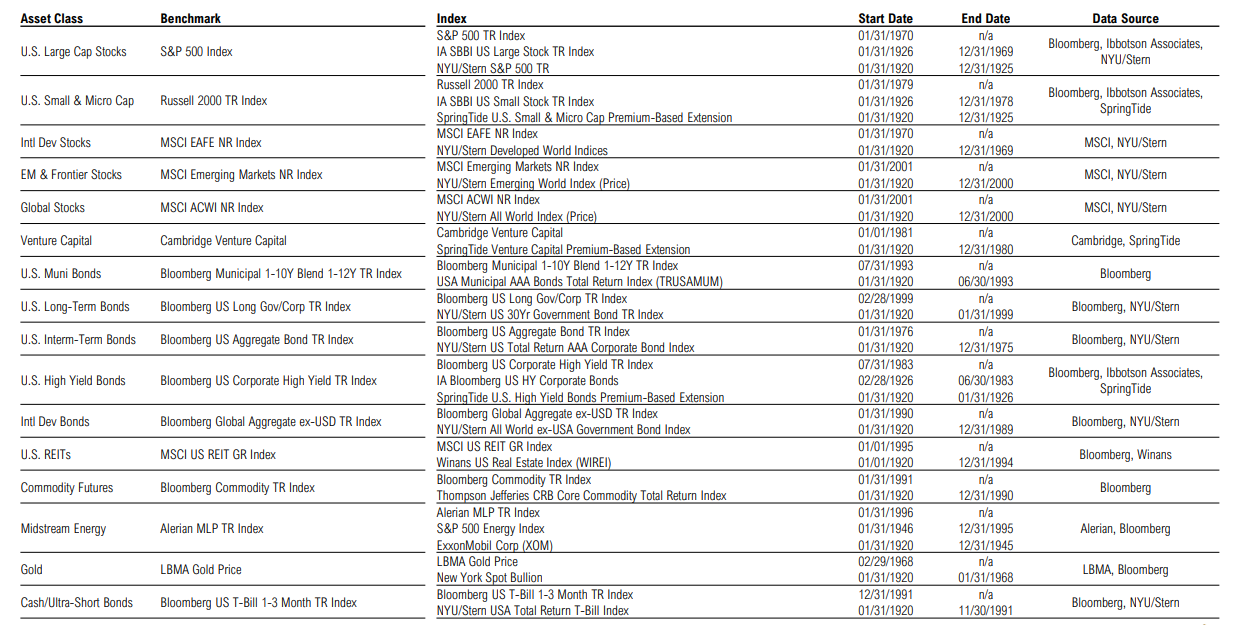
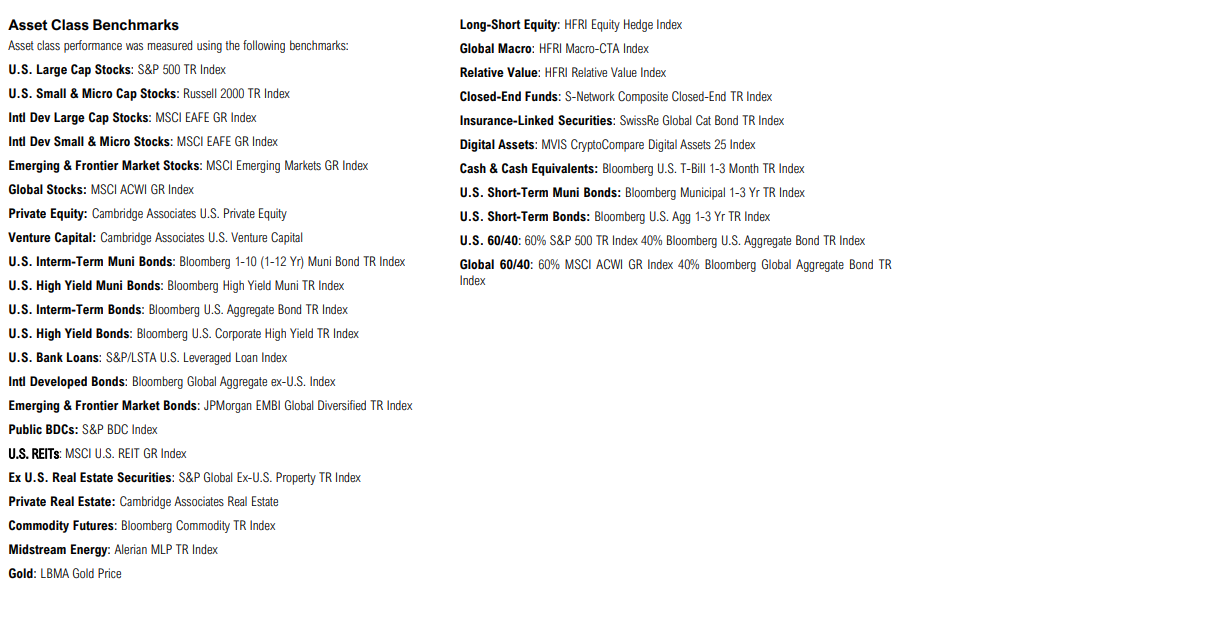
Appendix
Asset Class Definitions