The arithmetic makes it plain that inflation is a far more devastating tax than anything that has been enacted by our legislatures. The inflation tax has a fantastic ability to simply consume capital.
Warren Buffett, Berkshire Hathaway Chairman
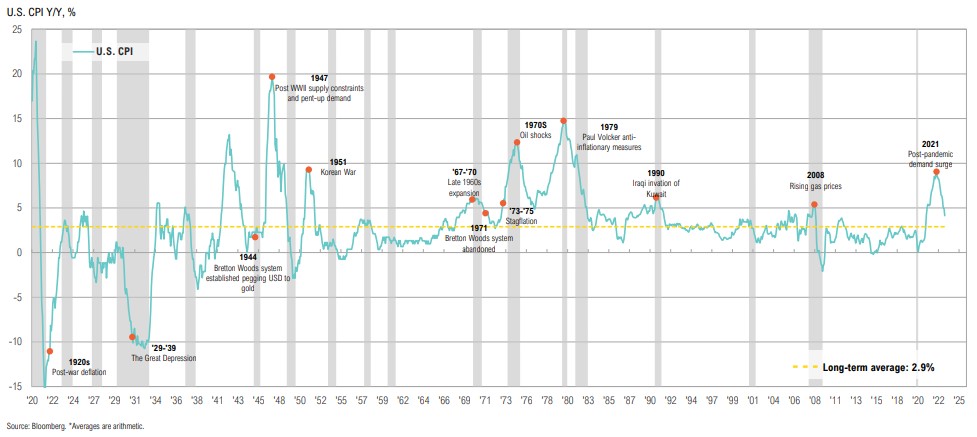
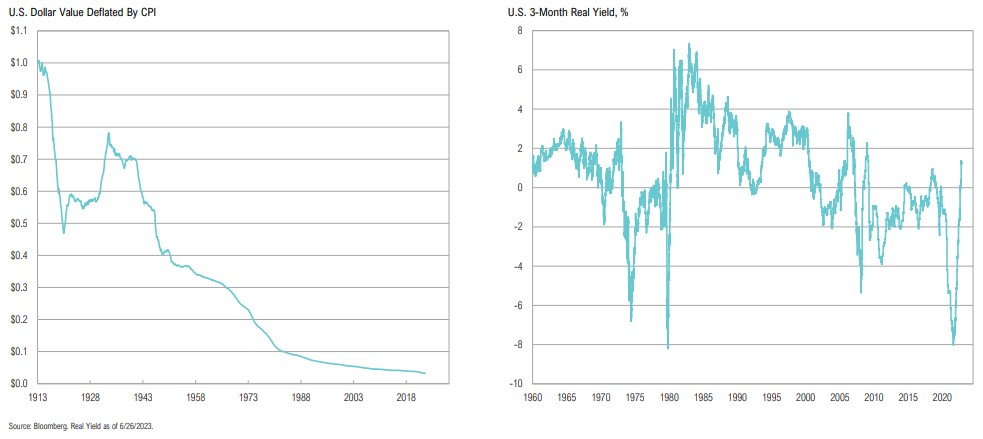
Long Term Inflation Trends
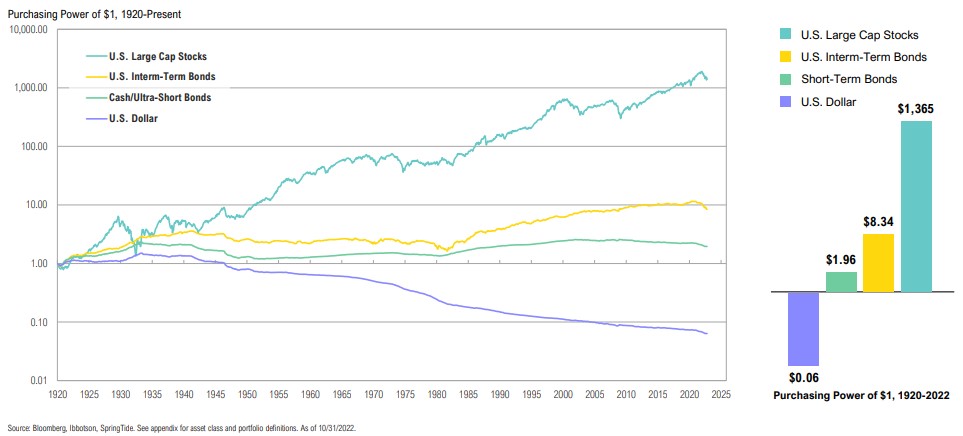
Over the long term, one of the biggest risks is never taking any risk at all; the highest priority is preserving purchasing power
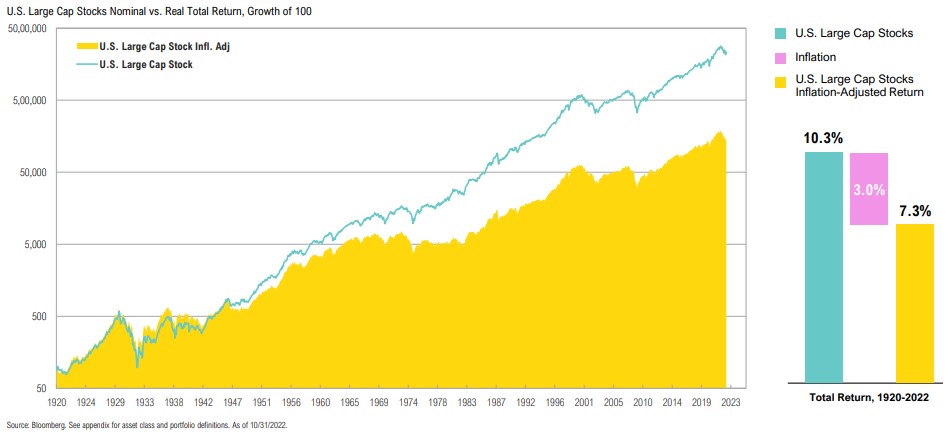
The declining value of the dollar due to inflation has been responsible for about 30% of the long-term return in stocks
Inflation—even at current elevated levels—is nothing new for markets, and is one of the most important considerations in any long-term investment strategy
Economic Backdrop
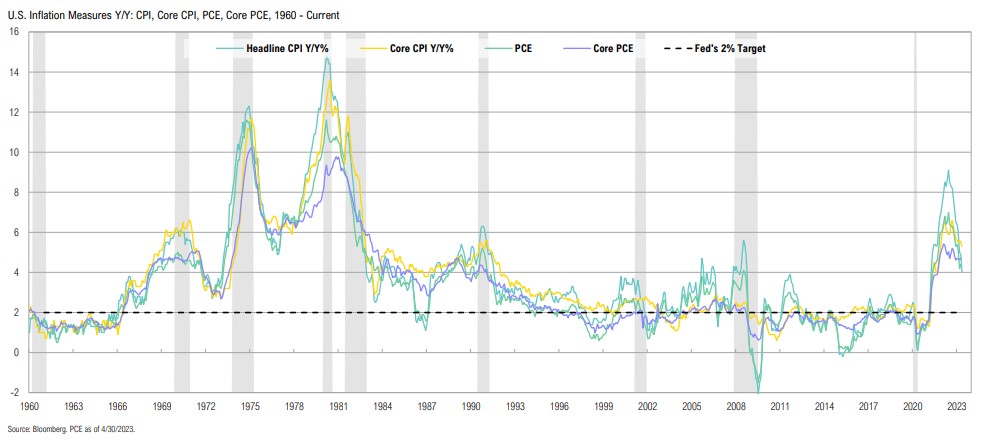
While headline inflation has rolled over from last year’s multi-decade high, core inflation persists well above the Fed’s 2.0% target
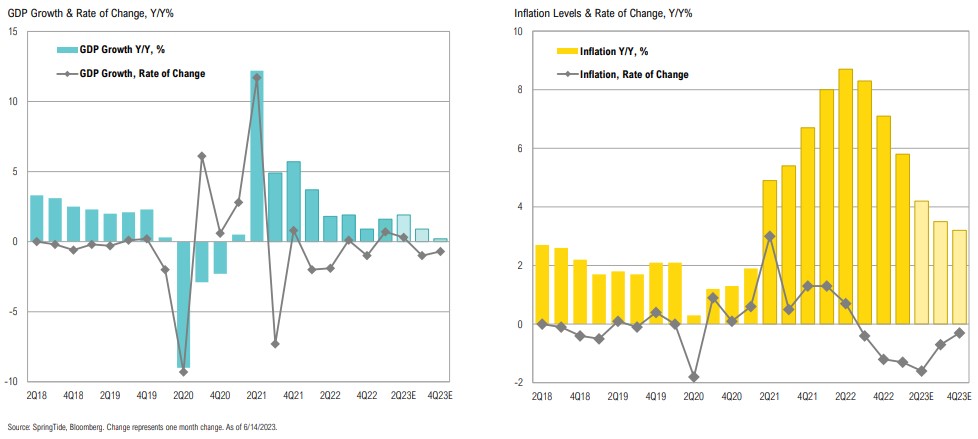
Stubbornly persistent inflation has eroded recent nominal growth; focus now shifts to the economic toll of the Fed’s efforts to slow inflation and how the Fed responds
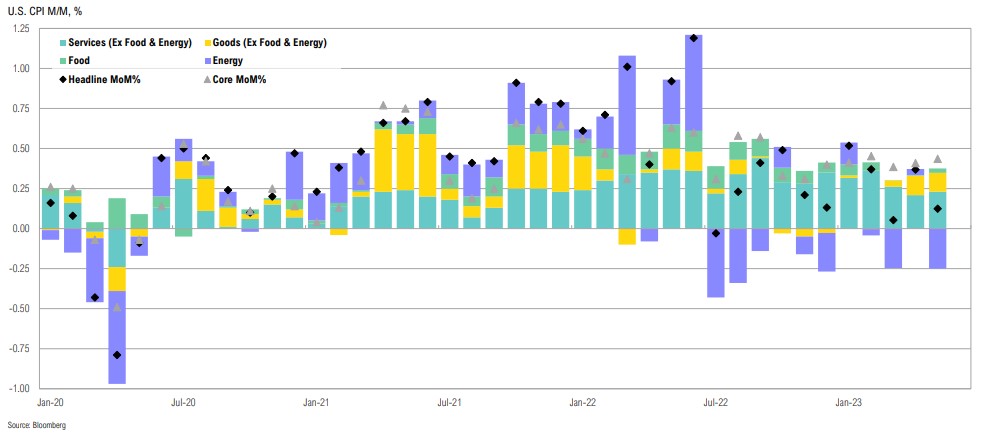
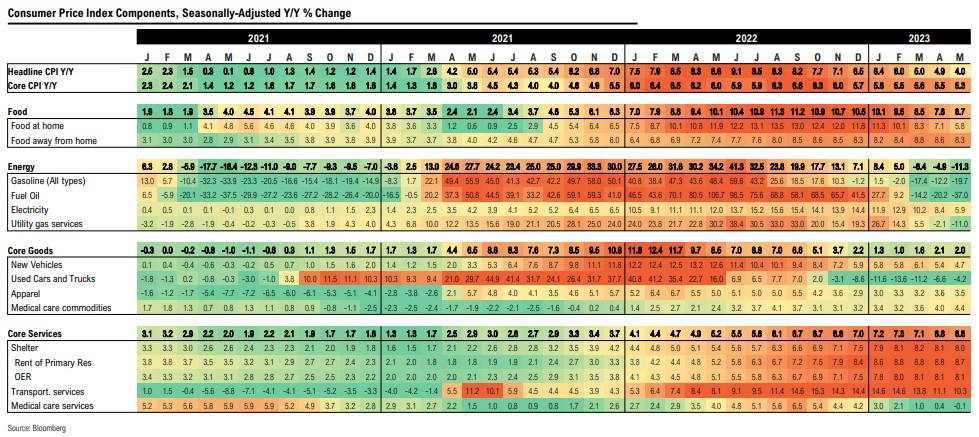
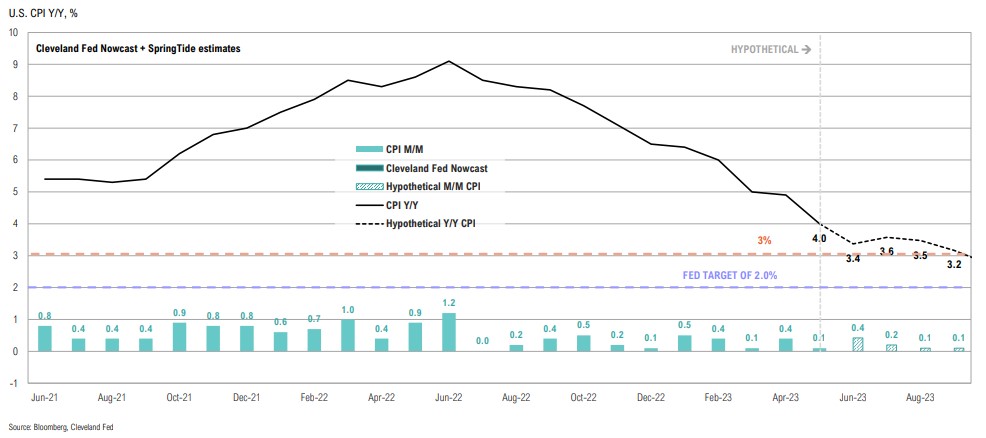
While still above 2.0%, monthly headline CPI prints have been surprising to the downside since Feb; but core CPI has declined just 0.4% YTD
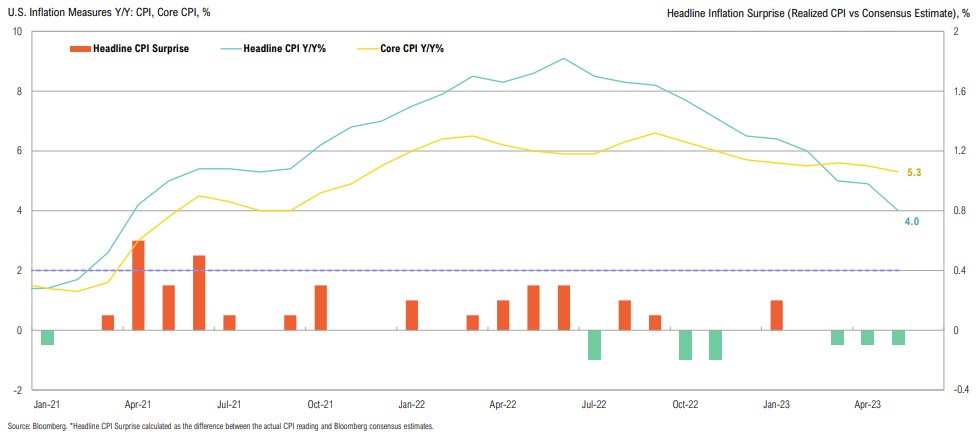
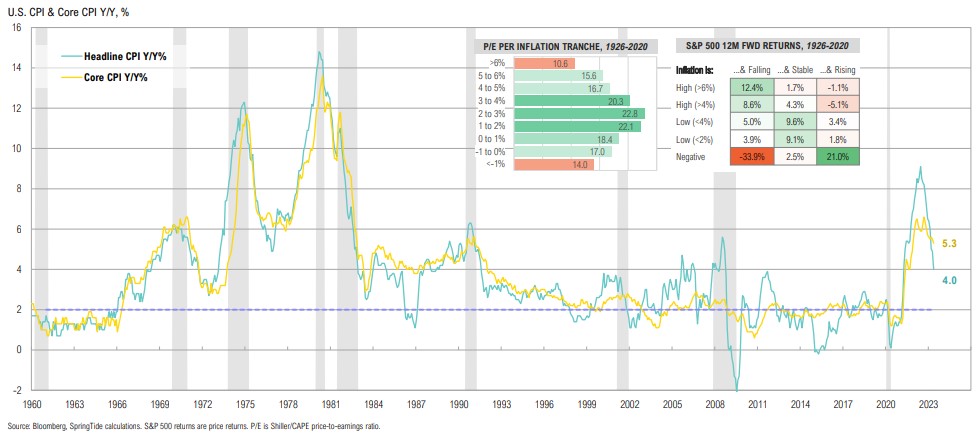
The divergence between core (+5.3% y/y) and headline inflation (+4.0% y/y) continues to deepen as core inflation remains sticky
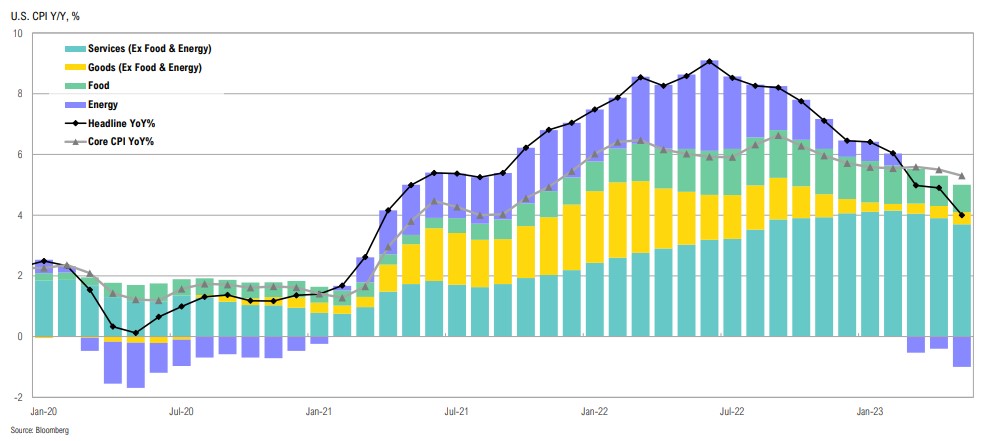
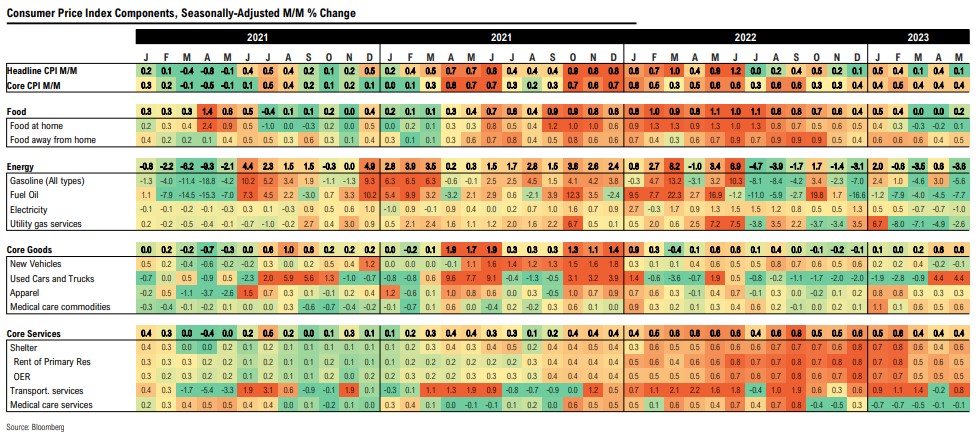
Core goods and services as well as food inflation accelerated on a month-over- month basis in May, while energy prices continue to pull headline inflation lower
Headline CPI fell 0.8% to 4.0% y/y in May, while core inflation only declined marginally to 5.3%; food and shelter remain the largest contributors
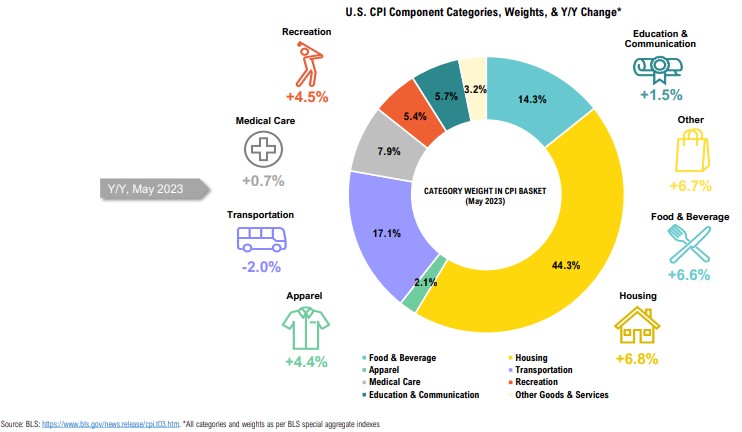
Inflation across categories is mixed; while most categories show inflation rolling over sharply, shelter inflation has only just started to decline (due to lagged effects)
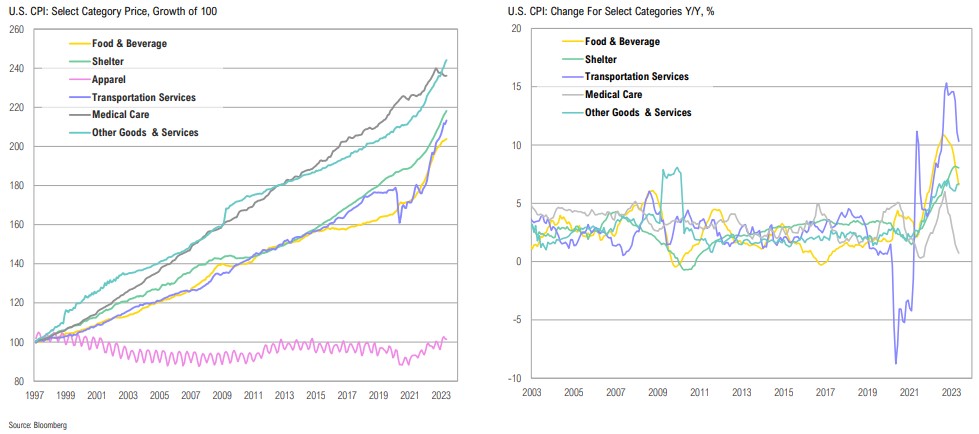
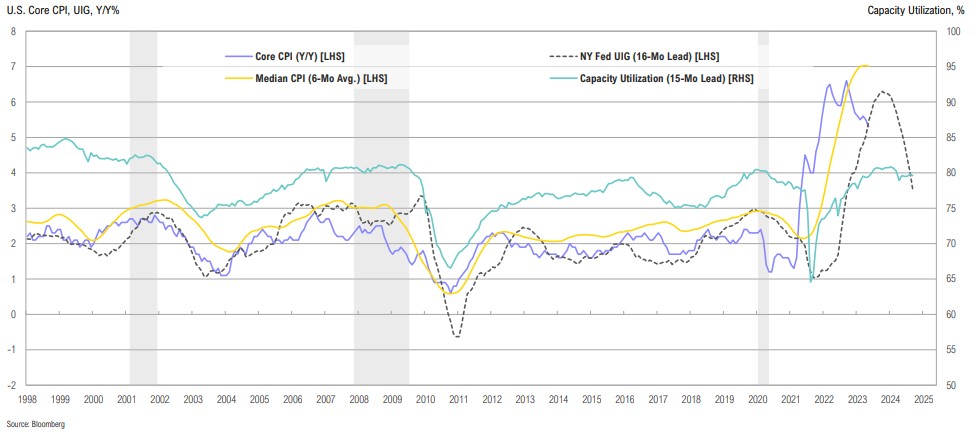
Core goods inflation has slowed since early 2022, but core services has yet to show meaningful signs of easing, largely driven by lags in the shelter component
On a month-over-month basis, elevated core services inflation driven by lags in the shelter component becomes even more prominent
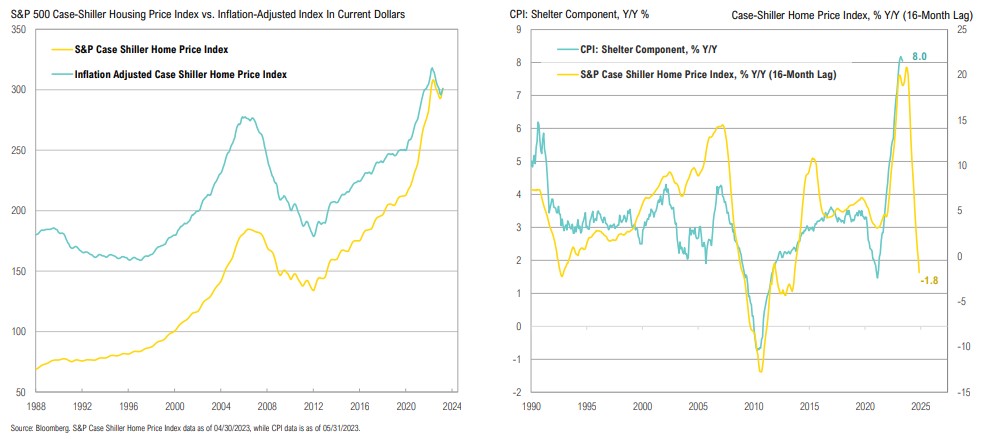
House prices have rolled over in both nominal and real terms as higher mortgage rates start to take their toll; shelter CPI has lagged home prices by 16 months, a sharp decline in the coming months is likely
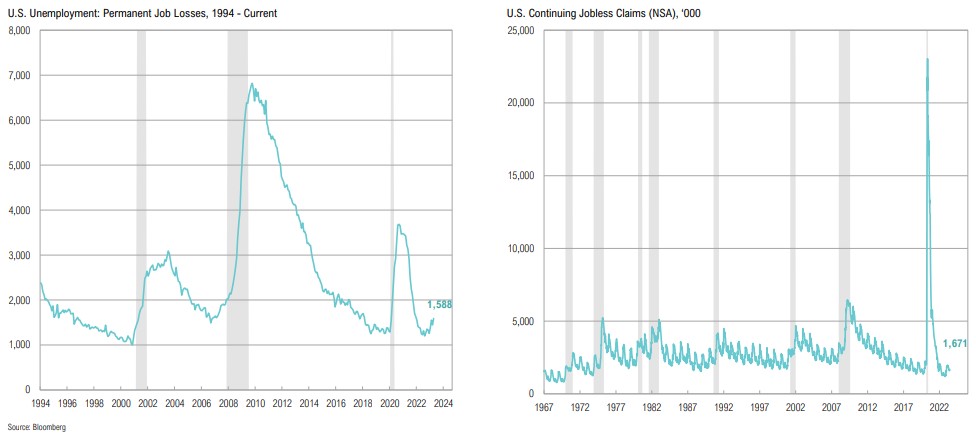
The labor market—a trailing indicator—remains tight but permanent job losses have started to tick higher since reaching pre-pandemic levels; continuing claims remain low
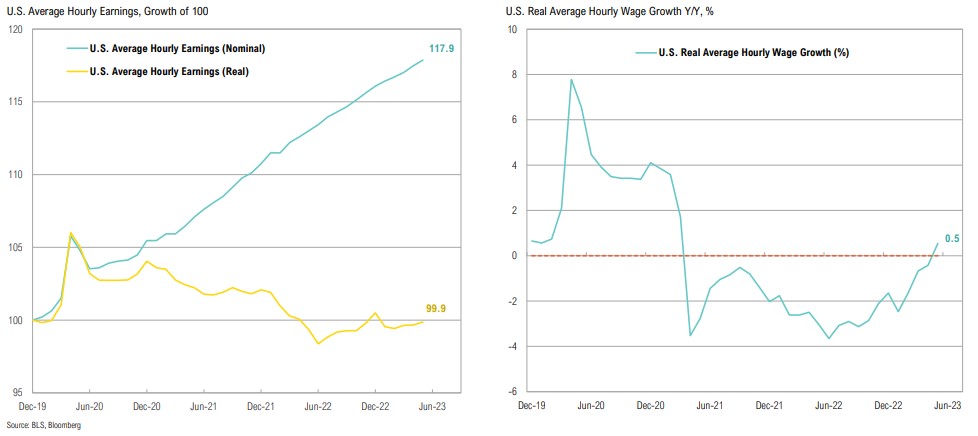
While wage growth has just caught up with inflation (first time since early 2021), the damage from post-pandemic overstimulation and accumulated inflation on real wage levels has been profound
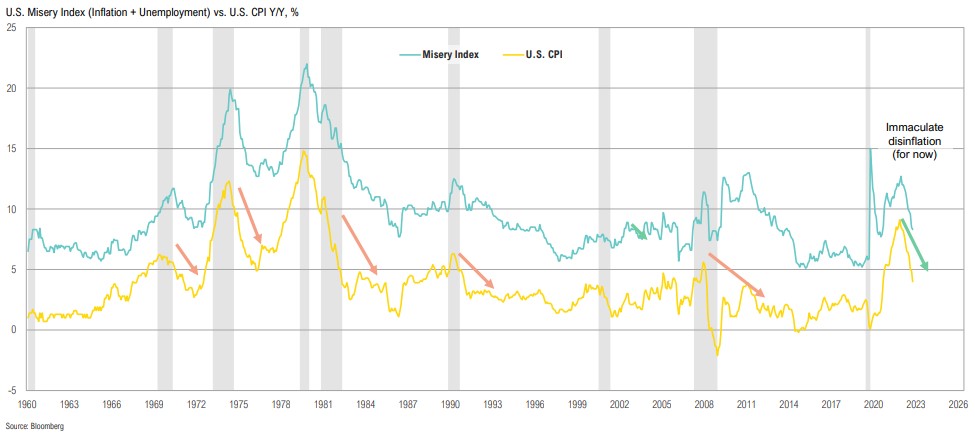
Immaculate disinflation: recession typically needed to beat inflation, however, recent y/y decline in CPI helped by easy base effects and, so far, has not needed labor market to break resulting in a huge improvement in Misery Index (inflation + unemployment), helping risky assets
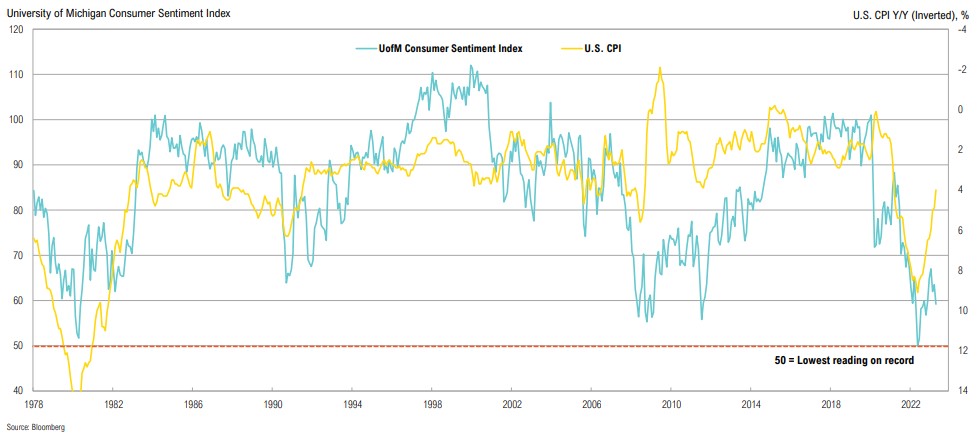
Consumer sentiment remains depressed, likely due to accumulated inflation, despite having bounced off the lowest readings on record in 2022
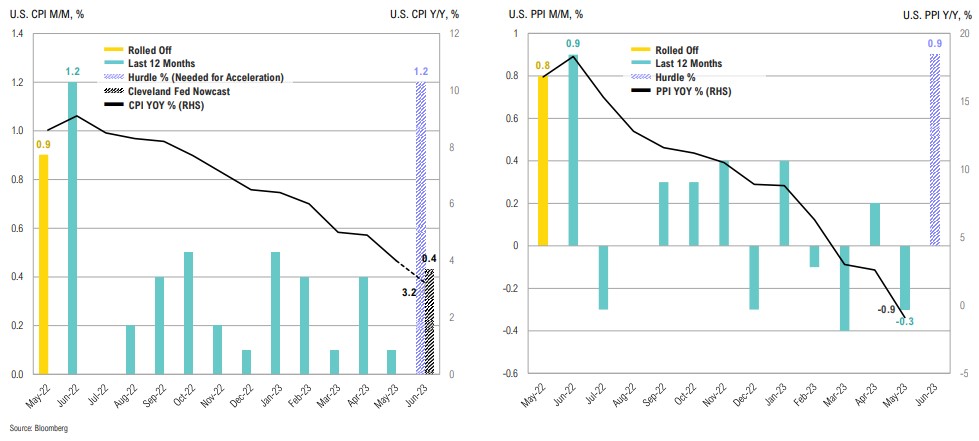
Headline CPI and PPI are expected to fall sharply in June due to base effects, but future months are more uncertain as there aren’t any more ‘outsized’ prints left to roll off
Inflation (CPI y/y) will likely stay above 3.0% through Q3 and is unlikely to reach 2.0% by year end without outright deflation in the second half of the year (which is possible, but at what cost?)
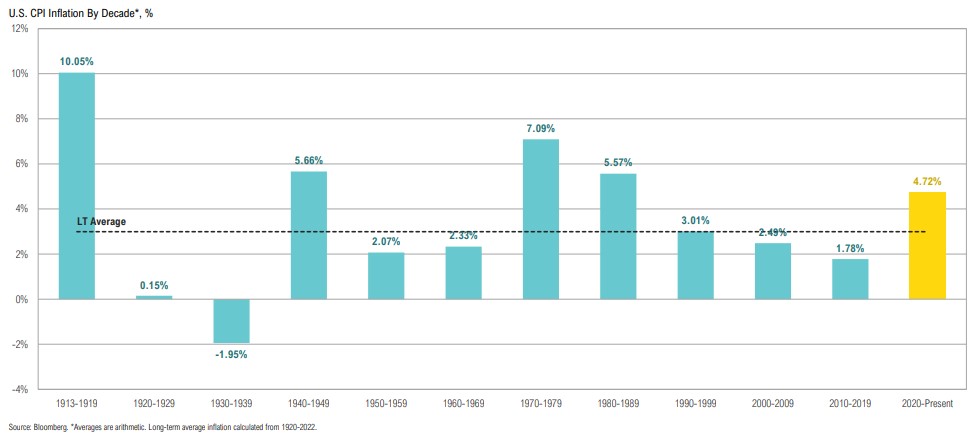
Relative to history, the recent overshoot in inflation is no further from “trend” (long-term average of 3%) than the undershoot last decade
Overly accommodative monetary/fiscal policy, COVID-19 and war-related supply shocks, and deglobalization, among other factors, all drove inflation higher; many of these are reverting back coupled with an unknown impact of AI
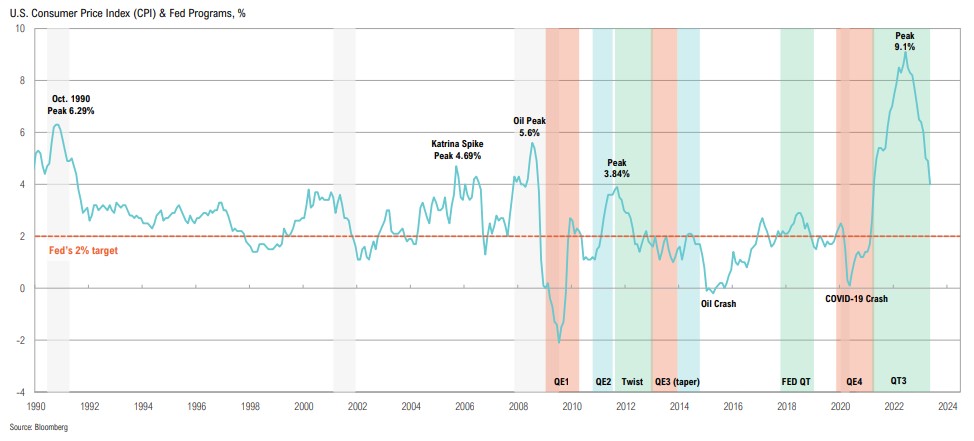
The pandemic, adding financial stability to its mandate, and the employment backdrop caused the Fed to overreact; they may now be making another ‘mistake’ in the other direction
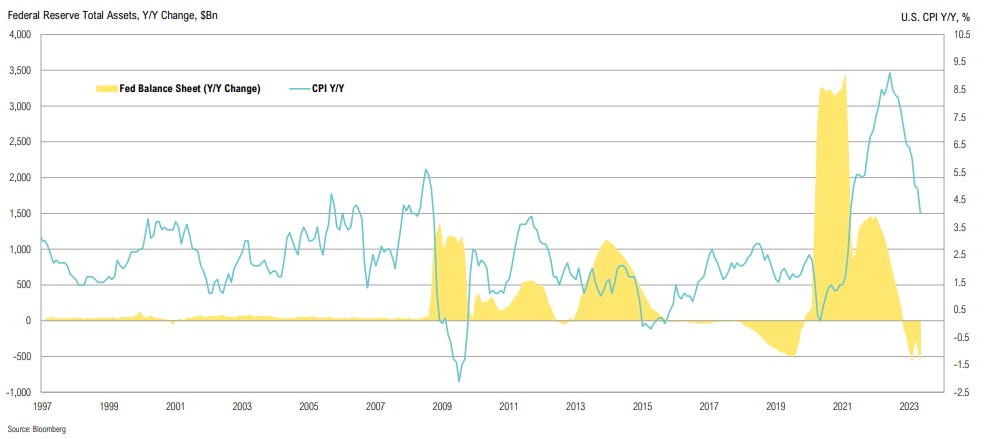
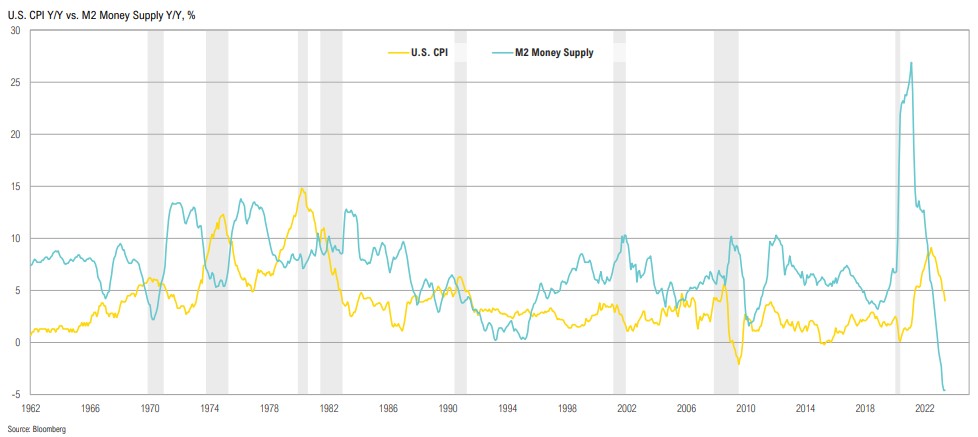
M2 money supply jumped as a result of fiscal response to pandemic, peaking at almost 30% year-over-year in 1Q21; pendulum now careening to the lowest levels on record
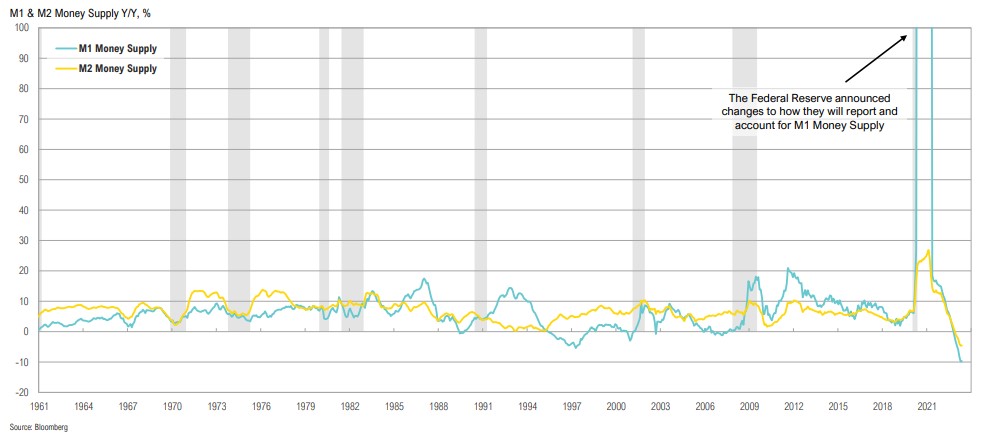
Inflation has declined largely due to base effects, but the fall in money supply has certainly played a role; looking ahead, monetary policy will remain tight, but for how long (and does something break)?
Inflation has peaked as both core and headline figures have declined since September last year; the speed and path of moderation vs. economic growth now shifts into focus
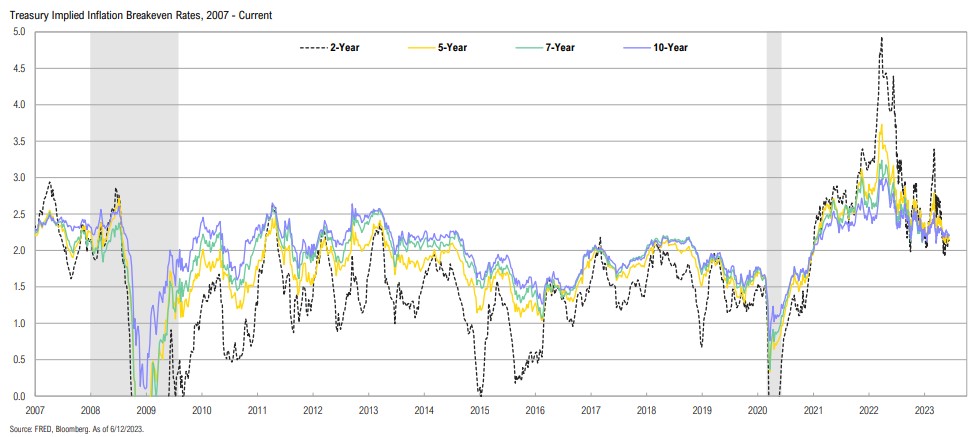
Breakeven inflation expectations dropped in May before rising slightly in the first two weeks of June; 2-year inflation expectations have dropped to 2.14%, near the Fed’s 2.0% target
The ‘good’ news for inflation should still be bad news for risky assets; still tighter financial conditions may be required to get inflation back to 2.0%
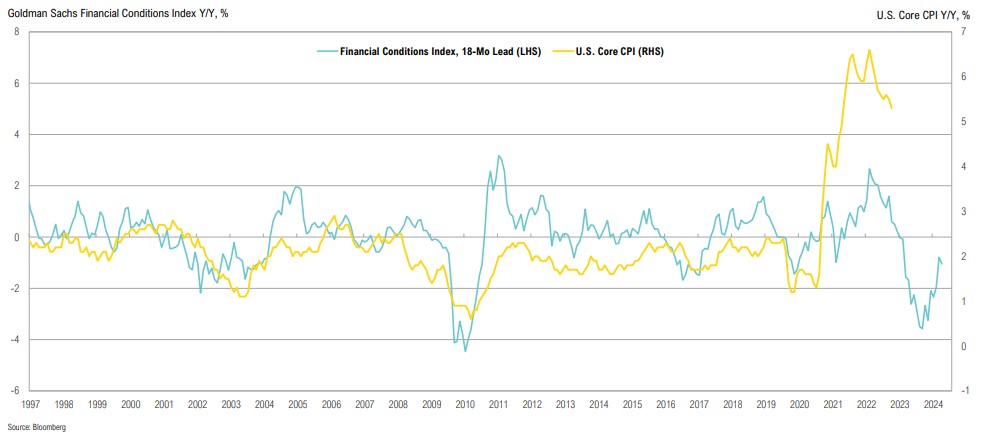
While equities seem to be signaling increased confidence, a successful soft-landing requires immaculate disinflation to continue, something the Fed hasn’t historically been able to do
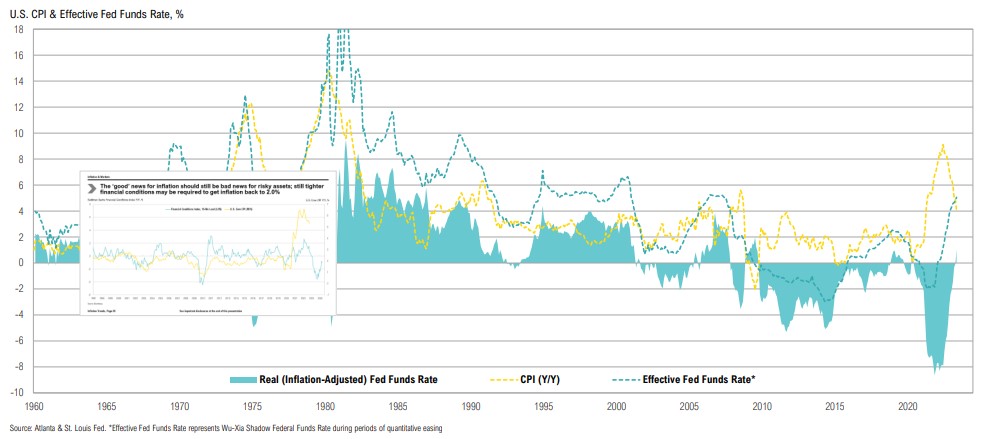
The Fed fell so far behind that they were forced to hike rates at the fasted pace in history and have only just brought the effective rate above zero; as inflation continues to fall, the current rate will become incrementally restrictive
Inflation is currently at decisive levels: Historically, falling inflation from elevated levels has been positive for stocks (as has recently been the case), but sticky inflation above 4.0% has been very negative
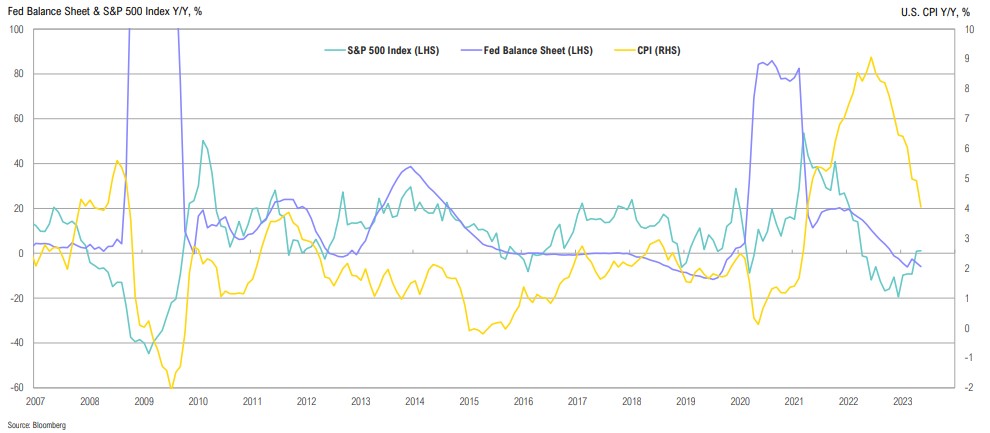
The extreme policy backdrop raised the risk of holding cash over the long term and created an epic incentive to take risk; are markets pricing in a return to that dynamic?
Most asset classes show very low correlation to inflation
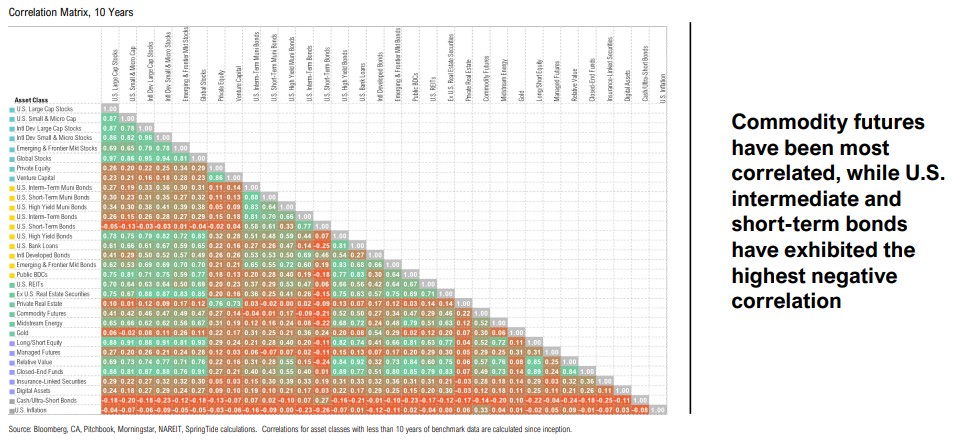
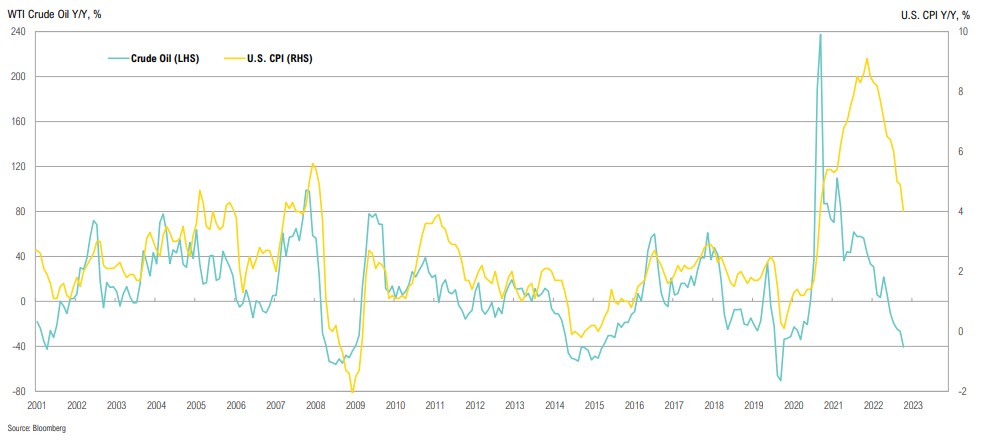
Crude oil and inflation have an extremely tight historical correlation for obvious reasons
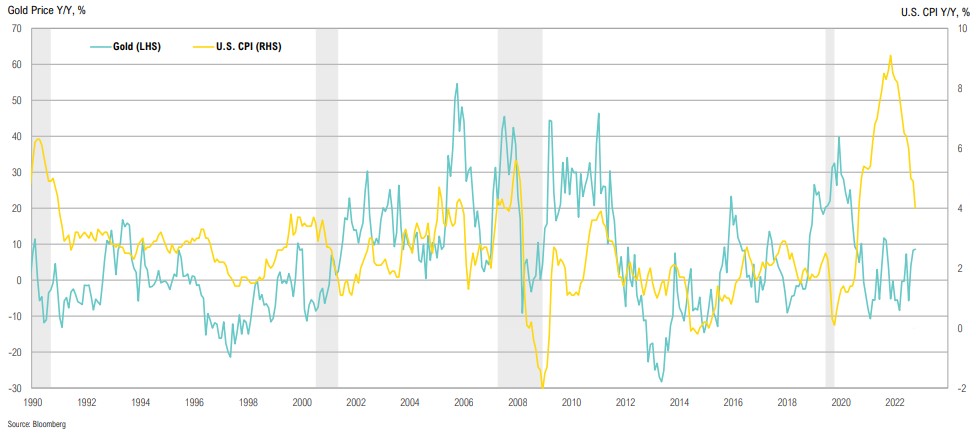
Gold has had a mixed relationship with inflation; the correlation between the two has been choppy since the start of the COVID-19 crisis