SUMMARY
“Make no mistake – for the majority of the investors today, this could very well be the most important event of your investing lives. Speaking as an old student and historian of the markets, it is intellectually exciting and terrifying at the same time. It is a privilege to ride through a market like this one more time.”
– Jeremy Grantham, GMO Co-Founder, Jan 2021

Q4 2020 Market Review
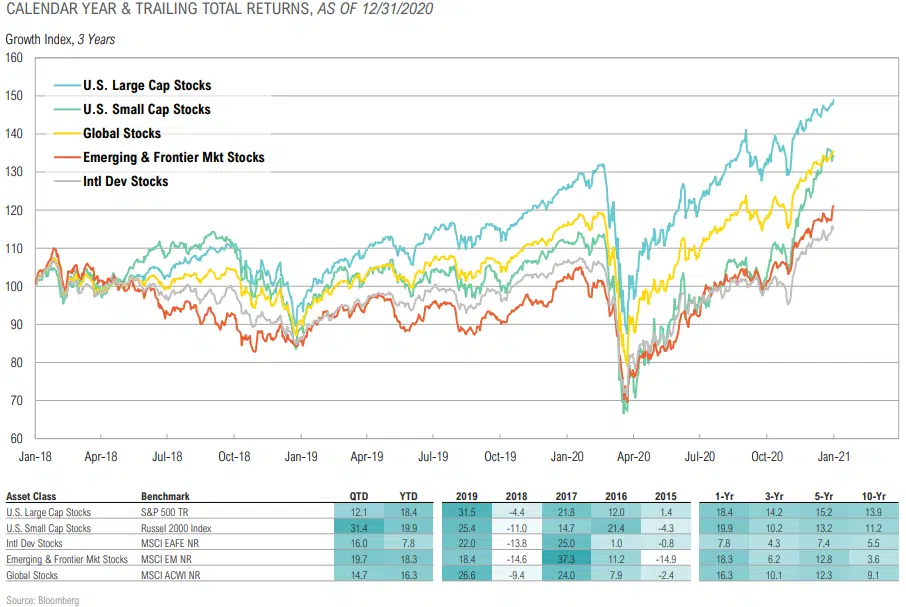
QTD & TRAILING 1-YEAR TOTAL RETURNS
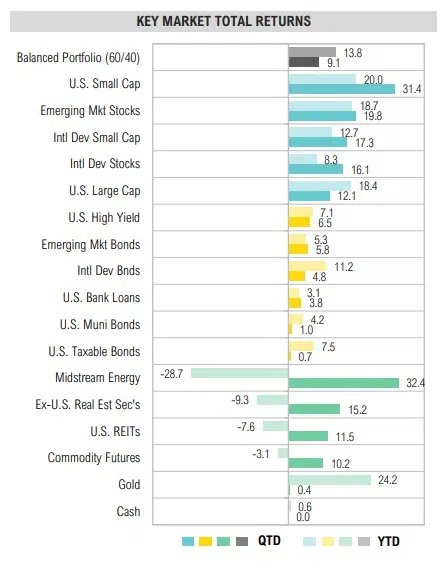
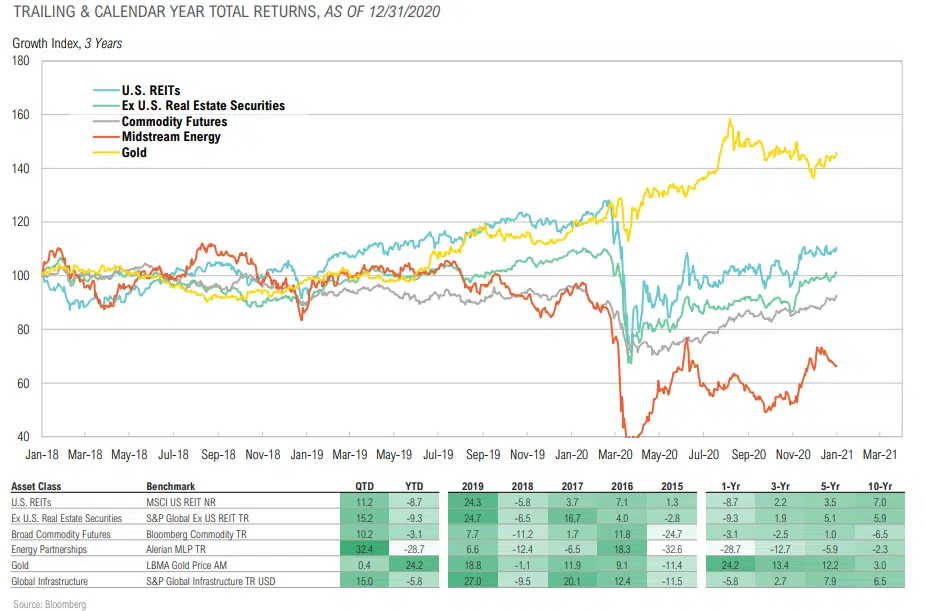
- Risky assets surged with S. small cap stocks (+31.4%) and midstream energy assets (+32.4%) being notable top-performers.
- U.S. large cap stocks, as measured by the S&P 500 Index, added 12.1% for the quarter, bringing year-to-date returns to 18.4%.
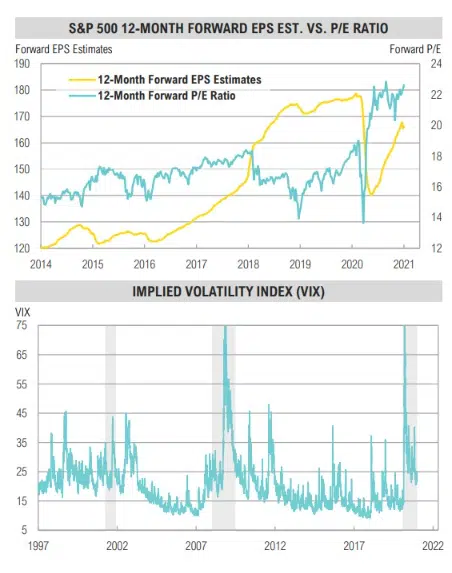
- The 12-month forward P/E ratio for the S&P 500 Index is currently 4x, near its highest level since 2000.
- Despite a strong rally in Q4, the energy sector was the worst- performing U.S. equity sector, dropping 7% for the year. Energy remains out of favor due to an anemic demand backdrop that kept oil and gasoline inventories above their 5-year ranges for most of the year, but the market should stabilize as demand returns.
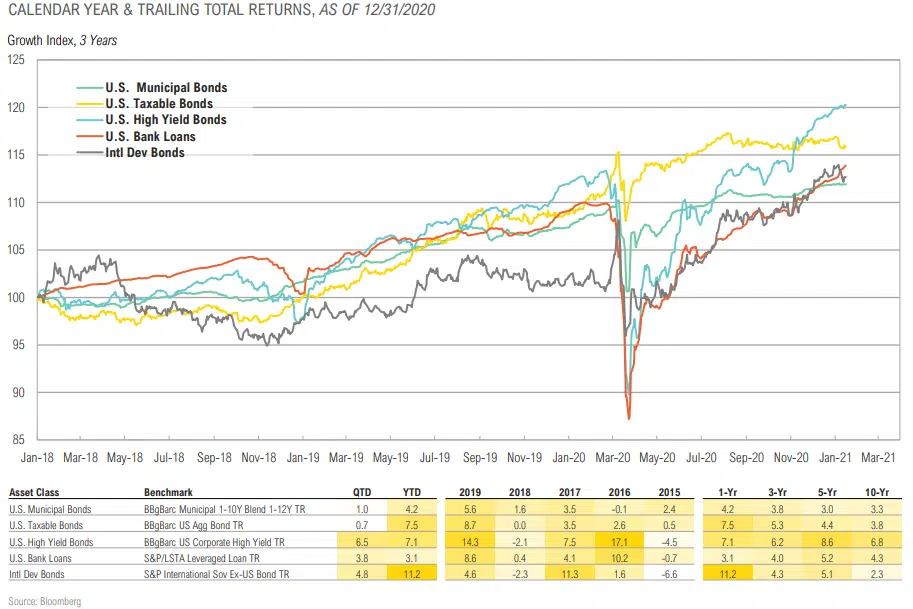
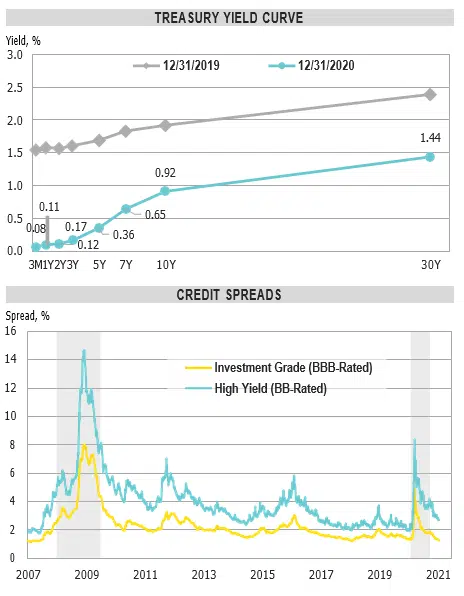
- All fixed income and credit sectors rallied for the quarter as rates rose modestly, but credit spreads narrowed on continued support by the Federal Reserve and an overall increase in risk appetite.
- While still positive, U.S. investment-grade bonds were the worst performing fixed income & credit sector, delivering 0.7% for the quarter.
- High yield bond spreads narrowed by 164 basis points from 50% to 3.86%, near their lowest levels ever.
- The real estate market remains at the epicenter of the Covid-19 crisis with significant uncertainty remaining around what the new “normal” will look like. U.S. REITs rose 11.5% for the quarter but remain lower by 6% for the year.
- Gold was up modestly for the quarter, holding its impressive year- to-date lead over other major asset classes.
Source: Bloomberg
GROWTH, INFLATION & POLICY
“Neither the president-elect, nor I, propose this relief package without an appreciation for the country’s debt burden. But right now, with interest rates at historic lows, the smartest thing we can do is act big. In the long run, I believe the benefits will far outweigh the costs, especially if we care about helping people who have been struggling for a very long time.”
-Janet Yellen, Treasury Secretary, January 2021
Growth, Inflation & Policy Summary
COMMENTARY & MARKET DATA
GROWTH SNAPBACK
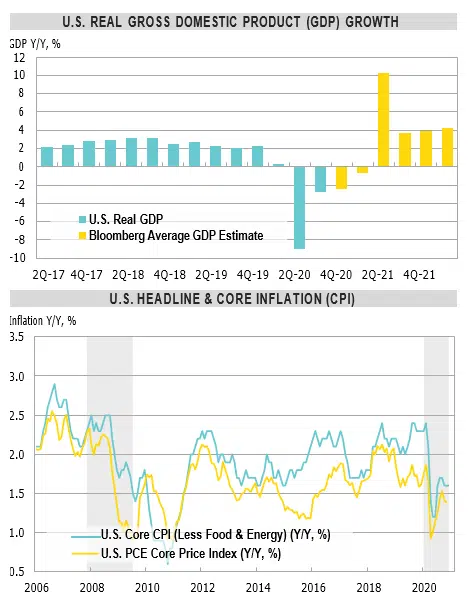
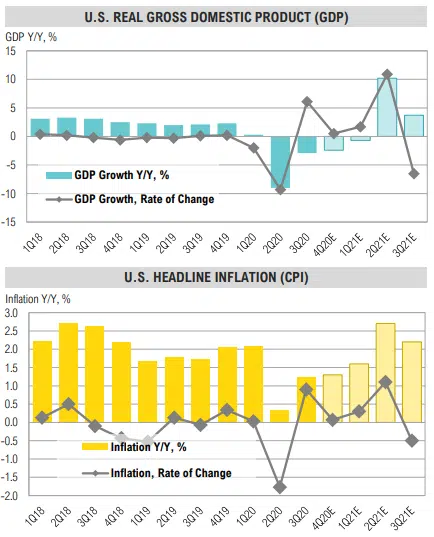
- U.S. real GDP growth is expected to have dropped 2.4% year- over-year in Q4 and 3.5% for the full year. It is expected to bounce back by 5.2% in 2021 (Bloomberg).
- The significant damage to the private sector and fact that fiscal multipliers are generally negative, especially in highly indebted countries, means that real (inflation-adjusted) growth is going to be become increasingly harder to achieve.
INFLATION TRENDING HIGHER
- While current inflation is relatively low, long-term inflation expectations have continued to trend higher. The 10-year TIPS- implied inflation rate is currently 2.1%, near a 7-year high.
- Economic slack, continued technology adoption and excessive debt levels will act as a damper on inflation until MMT-inspired “helicopter money” becomes ongoing policy.
- On balance, we expect inflation to trend higher in fits and starts (higher lows and highs) in coming years.
POLICY
- To date, fiscal stimulus has been more reactive (replacing lost income) than proactive (stimulus).
- We believe policy will start to become more proactive and supportive/ distortive for at least three reasons:
- Single party control of the U.S. government
- The de facto merging of the Fed and Treasury
- The Covid-19 crisis removing social and political pushback to government spending and bailouts
Source: Bloomberg
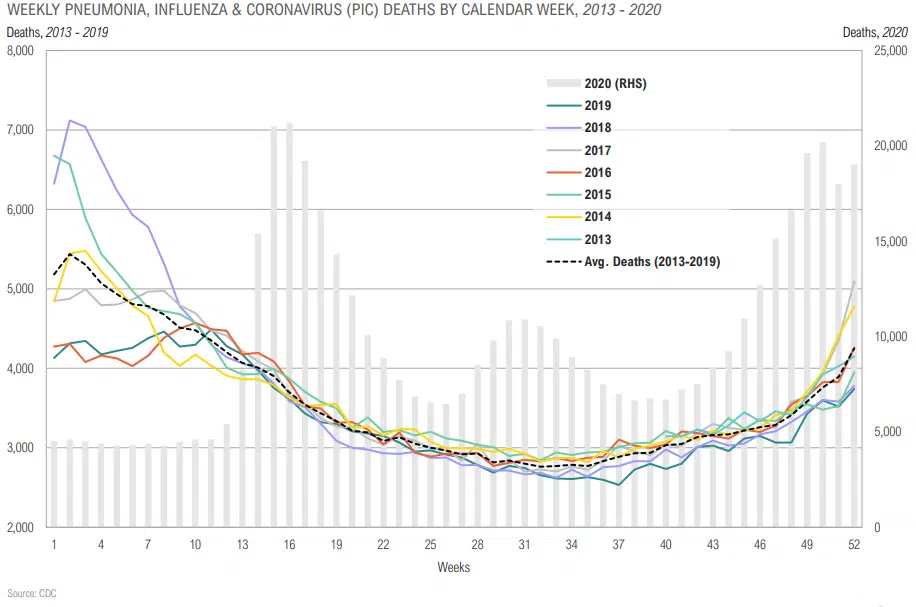
Surge in Cases & Hospitalizations But Not Deaths
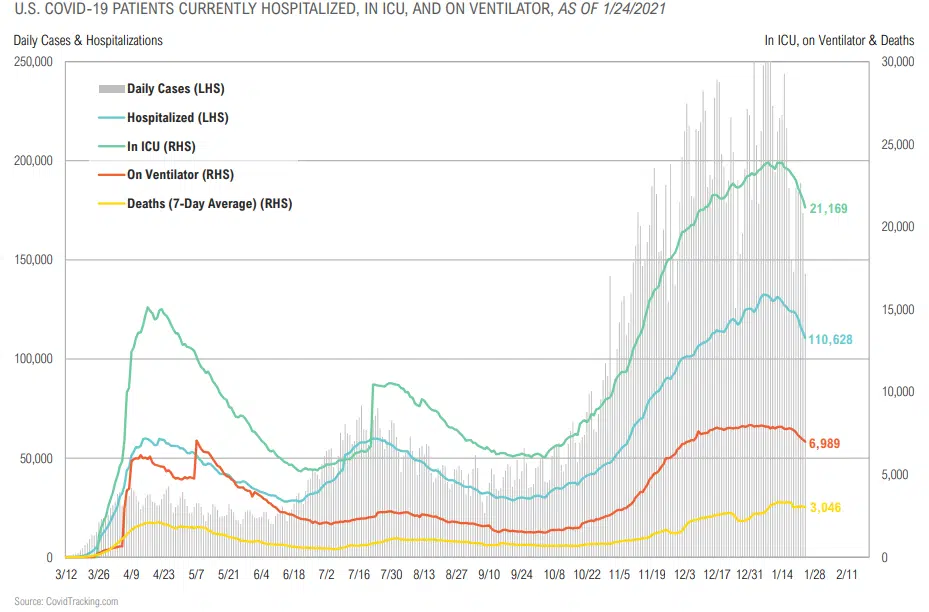
Recent Covid-19 Surge Tracking with Flu Seasonals, Likely to Continue to Improve Dramatically into the Summer Months
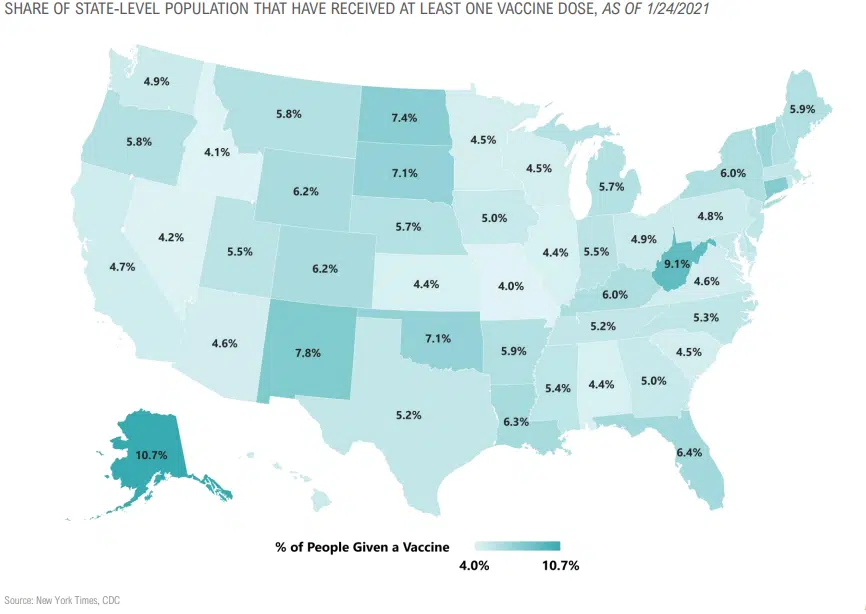
Vaccine Distribution in the U.S.
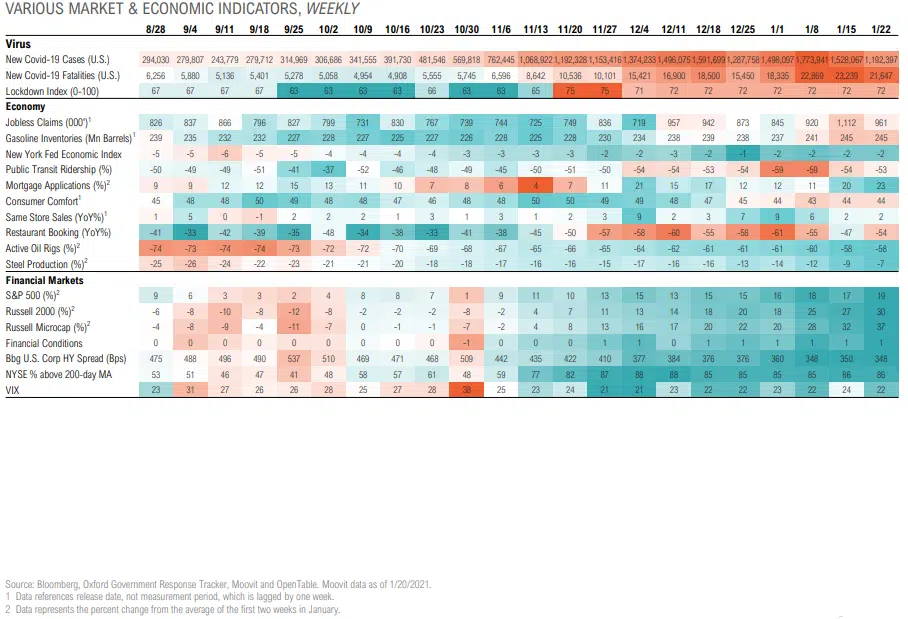
Tracking the Recovery
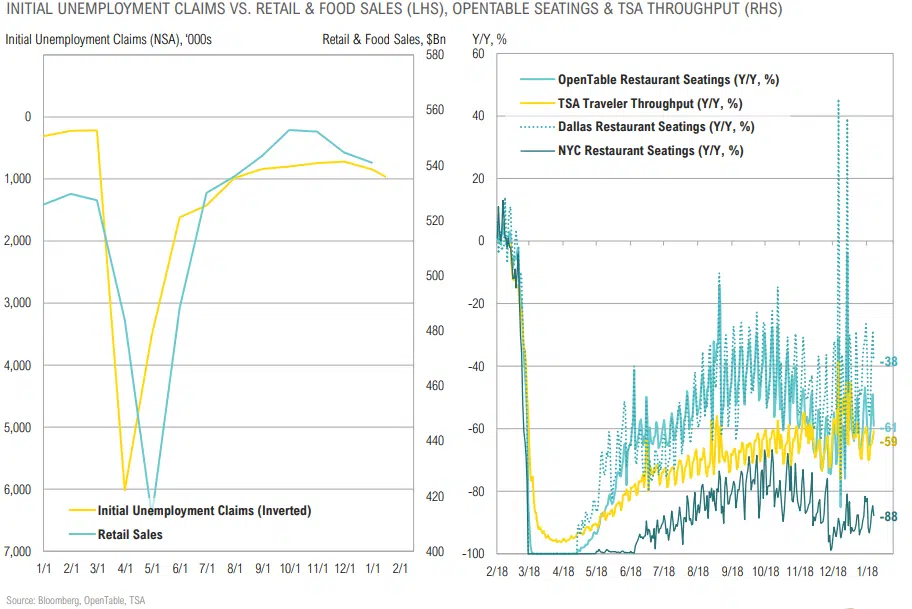
Retail Sales Have Declined as Unemployment Rises, Economic Activity Slows
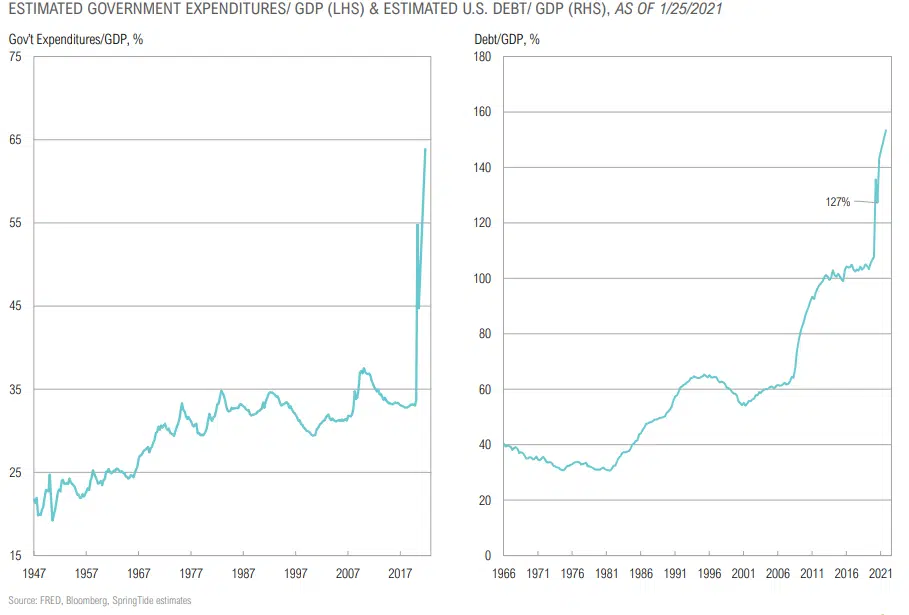
More Government Spending, More Debt
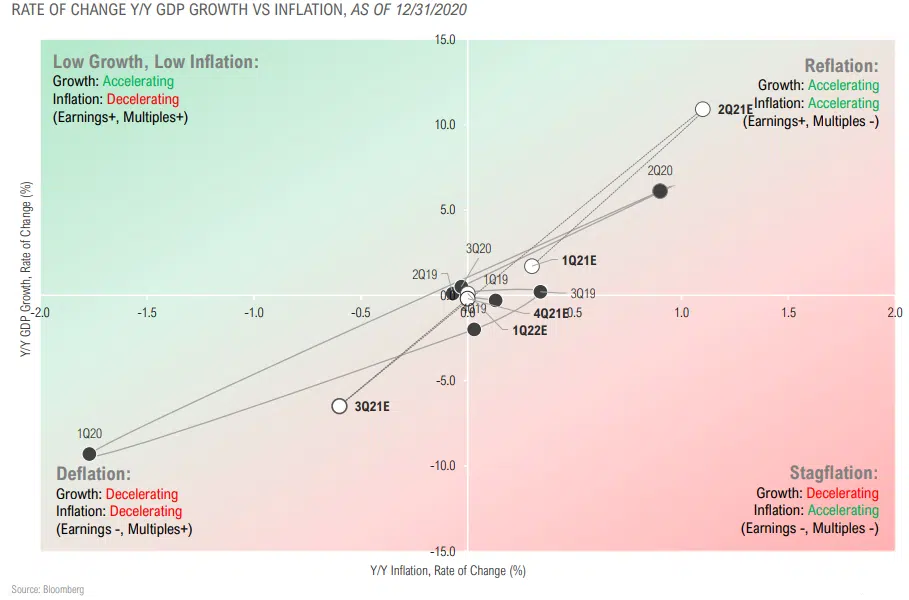
2Q21 Expected to See Fastest Acceleration in Y/Y Growth & Inflation of Recovery
GDP GROWTH & INFLATION LEVELS & RATE OF CHANGE, Y/Y %
GROWTH
- U.S. real GDP growth is expected to have dropped 2.4% year over-year in Q4 but is expected to bounce back in 2021.
- As the global economy emerges from the Covid-19 crisis, nominal growth will gradually recover.
- The significant damage to the private sector and fact that fiscal multipliers are negative, especially in highly indebted countries, real growth will likely take may years to recovery.
INFLATION TO TREND HIGHER
- While current inflation is relatively low, long-term inflation expectations have continued to trend higher. The 10-year TIPS implied inflation rate is currently 2.1%, near a 7-year high.
- Economic slack, continued technology adoption and excessive debt levels will act as a damper on inflation until MMT-inspired “helicopter money” becomes ongoing policy.
- On balance, we expect inflation to trend higher in fits and starts (higher lows and highs) in coming years.
POLICY
- To date, fiscal stimulus has been more reactive (replacing lost income) than proactive (stimulus).
- We believe policy will start to become more proactive and supportive/ distortive for at least three reasons:
- Single party control of the U.S. government
- The de facto merging of the Fed and Treasury
- The Covid-19 crisis removing social and political pushback to government spending and bailouts
Source: Bloomberg
Reflation Expected to Continue for 1H21, But Without Policy Governor of Higher Rates
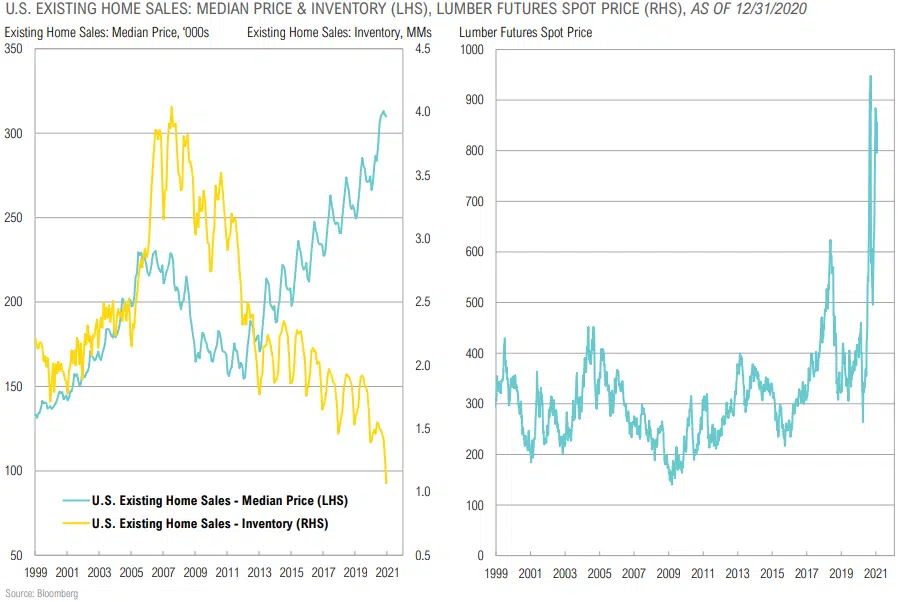
Inflation Case Study: Falling Housing Inventories, Rising Lumber Prices Push Housing Prices Higher
EQUITY
“Central bankers always try to avoid their last big mistake. So every time there’s a threat of a contraction in the economy, they’ll overstimulate the economy, by printing too much money. The result will be a rising roller coaster of inflation, with each high and low being higher than the preceding one.”
-Milton Friedman, Economist, Author of Capital & Freedom
Equity Returns
Equity Summary
COMMENTARY & MARKET DATA
PUBLIC MARKETS
- U.S. equity valuations are back in the top-quintile, implying muted forward long-term returns substantially below those of the last decade, but the tactical outlook looks less bleak.
- U.S. equity valuations are elevated relative to foreign developed and emerging equities, but growth rates are better, and the policy backdrop is more supportive in the U.S.
- Lower valuations in Europe reflect structural challenges faced by a continent that continues to get squeezed by competition from the U.S. and China. Hold some, but stay underweight.
- We continue to favor large cap indices over small cap indices, but active small cap managers over large cap indices, reflecting a better opportunity set for active managers in the small cap space.
- Long-term return expectations for emerging market equity remain relatively stable as higher growth rates should drive earnings growth in excess of developed peers.
PRIVATE MARKETS
- Even net of higher fees, select investments in high quality venture capital and private equity can add value for clients that have the capacity for reduced liquidity.
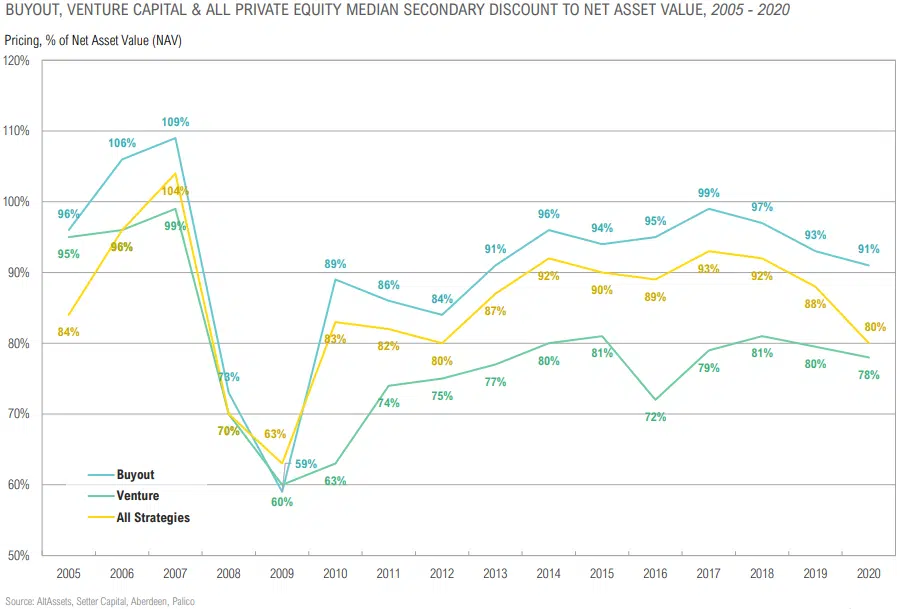
- Secondaries may be particularly attractive if investors who may have overallocated to private markets late in the cycle are forced to seek liquidity in the coming months/years.
Source: Bloomberg
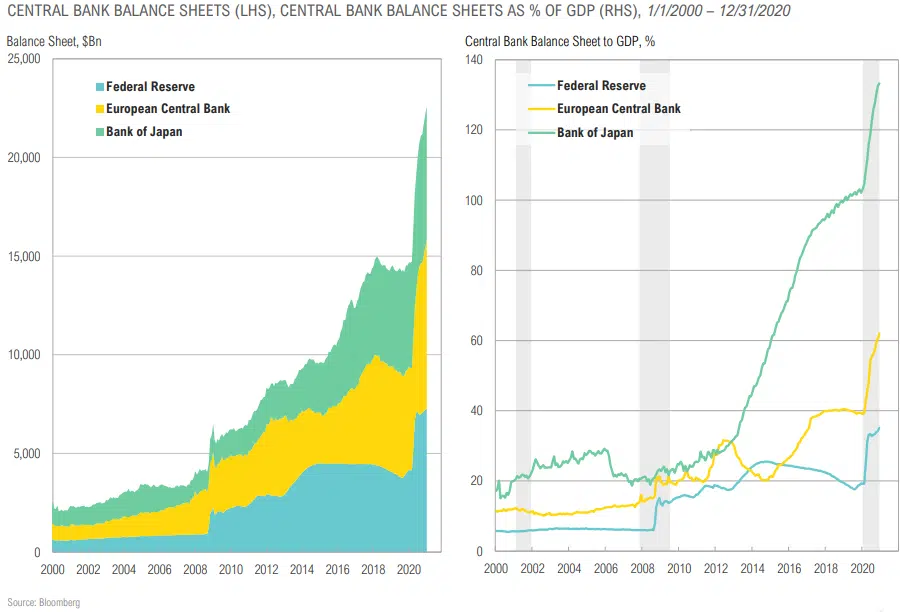
Central Bank “BS” and Global Stocks
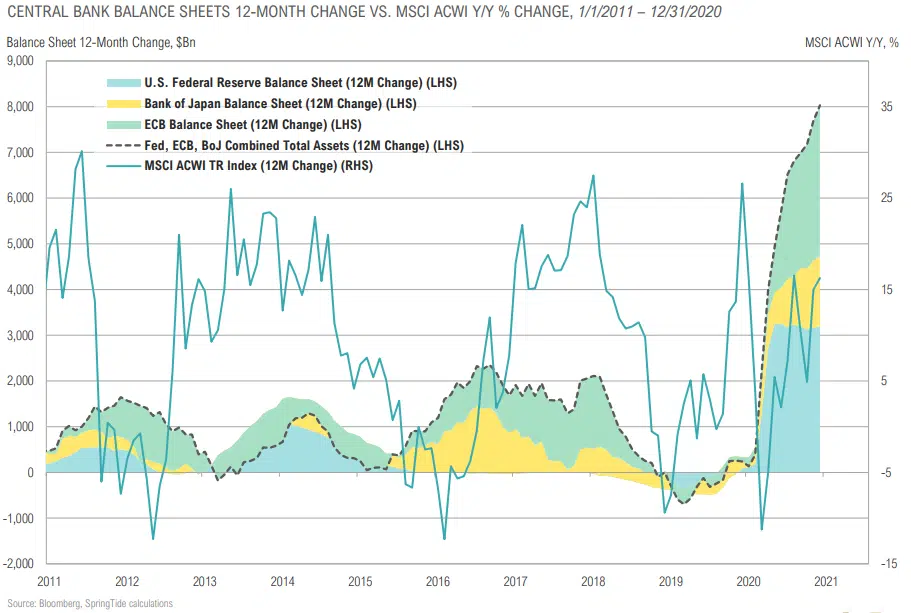
The Fed Can Provide More Stimulus Relative to Other Central Banks
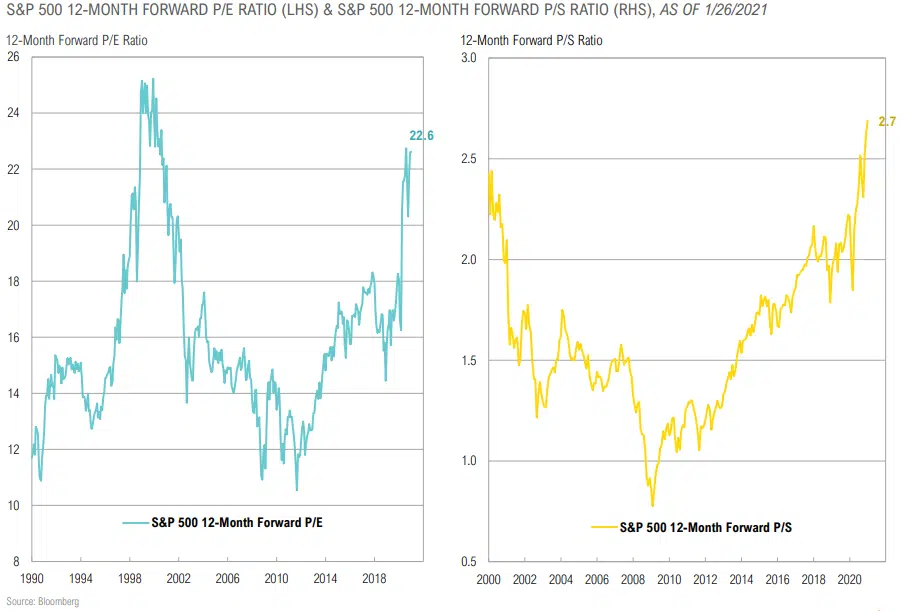
U.S. Stocks Are Expensive by Many Measures pt.1
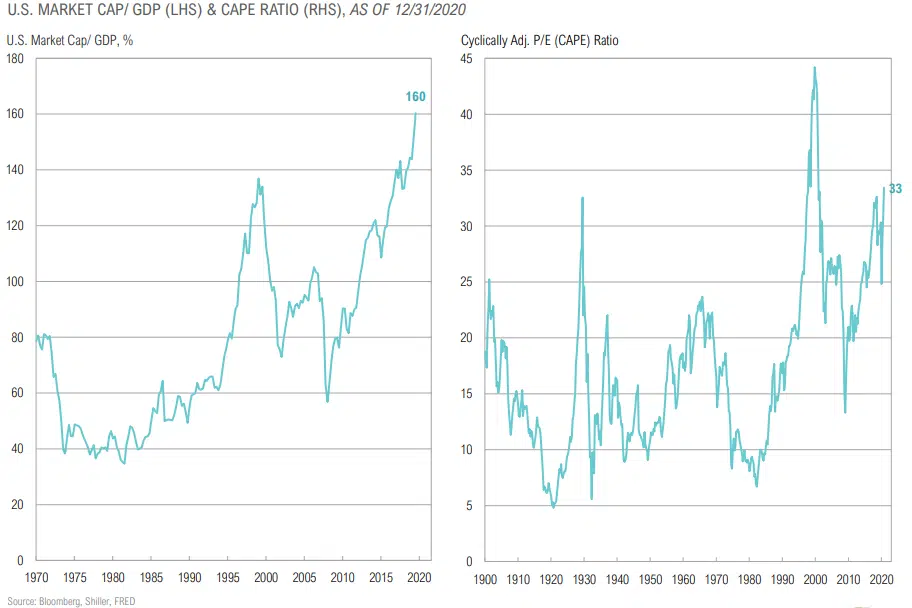
U.S. Stocks Are Expensive by Many Measures pt.2
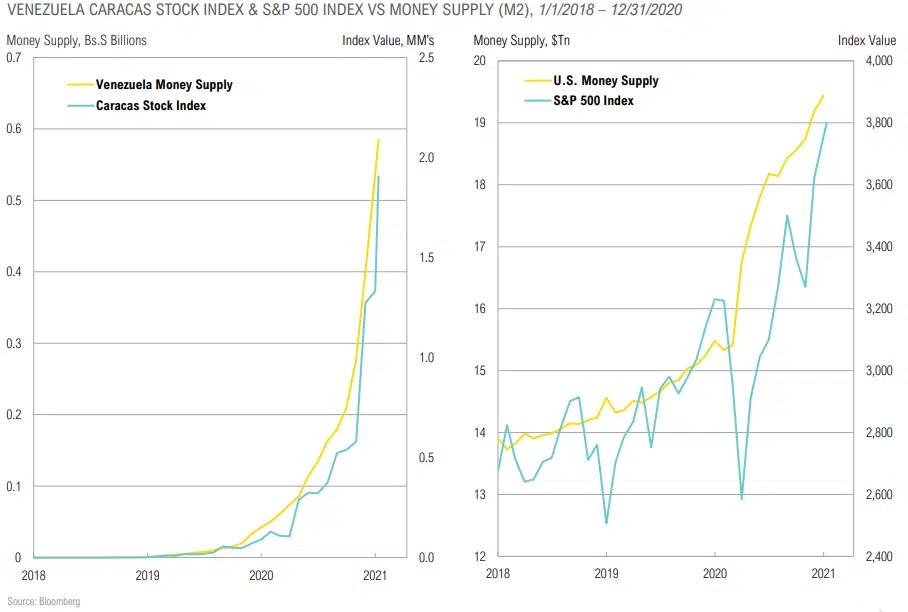
Stocks Can Melt Up Indefinitely if Money Supply Growth Continues
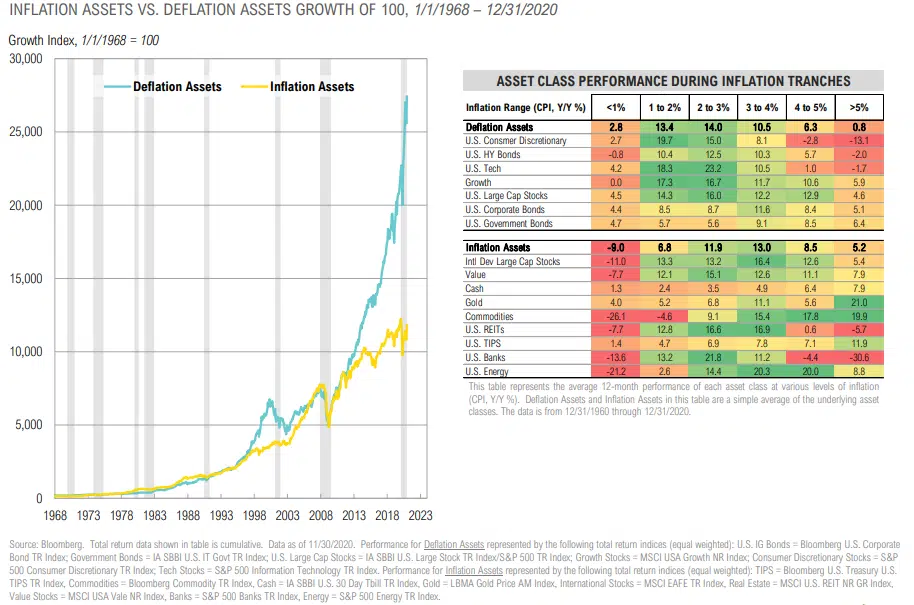
Time to Tilt from Deflation to Inflation Assets
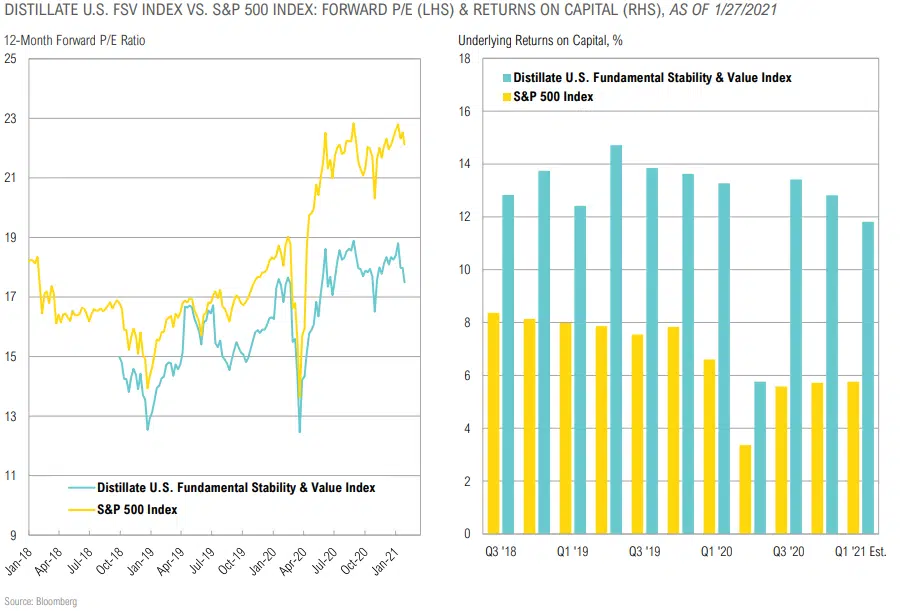
Reducing Risk in U.S. Large Cap Stocks
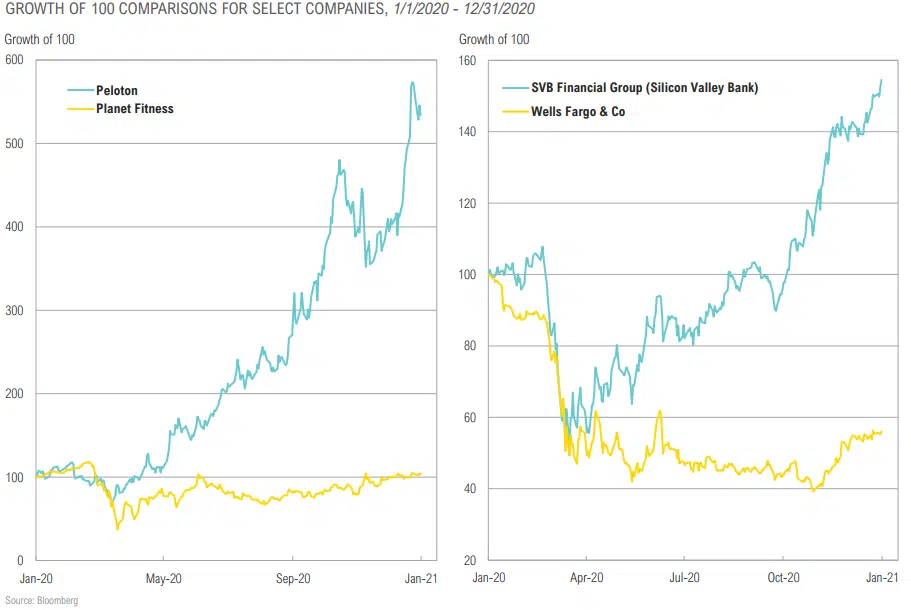
Winners vs. Losers or Redefining “Normal”?
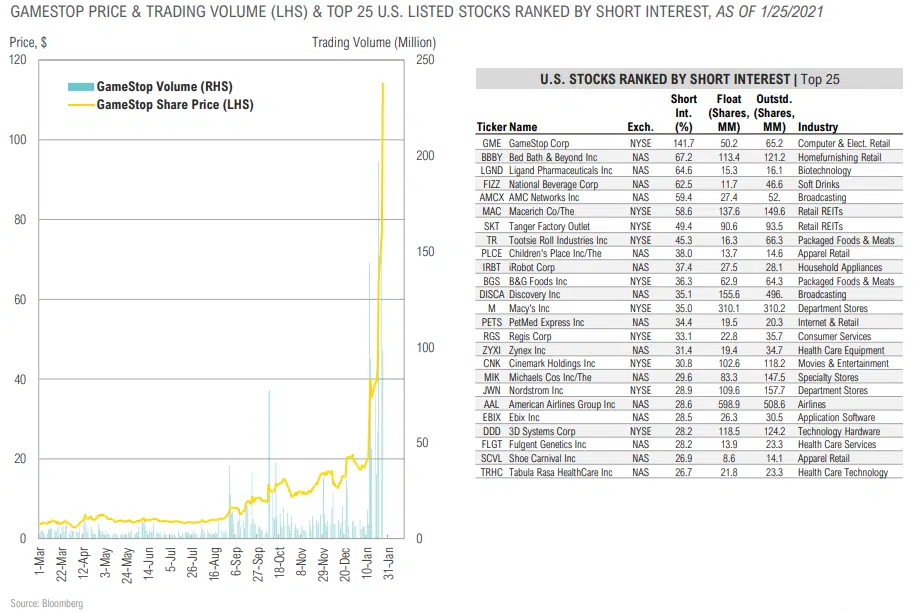
Treacherous Market for Short Sellers: Crowd-Sourced Short Squeezes
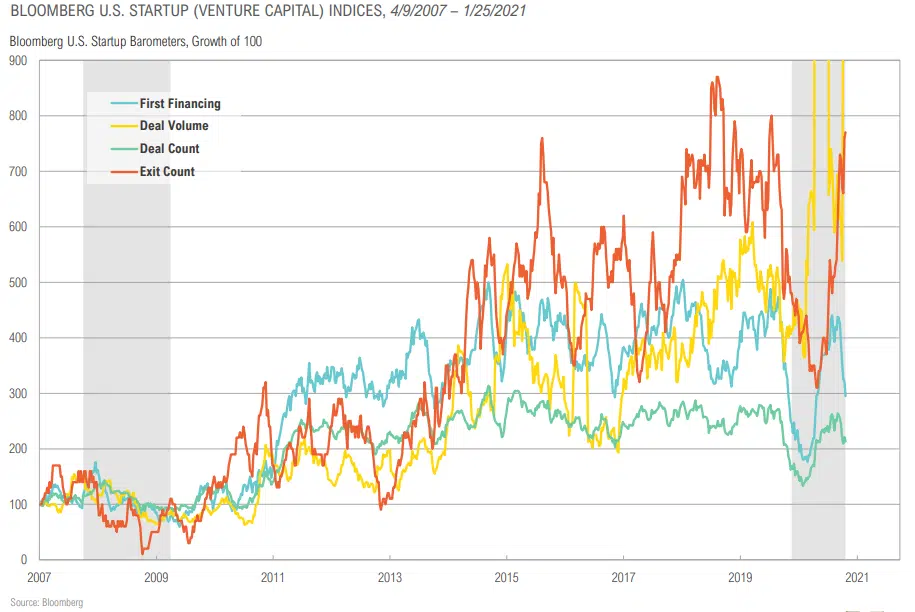
Activity in Venture Capital Continues to be Robust
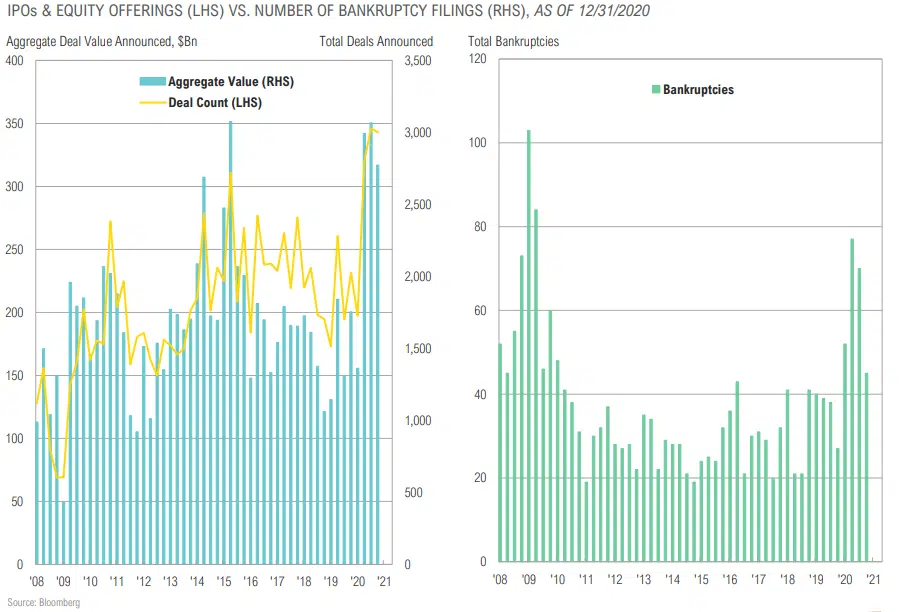
IPOs vs. Bankruptcies
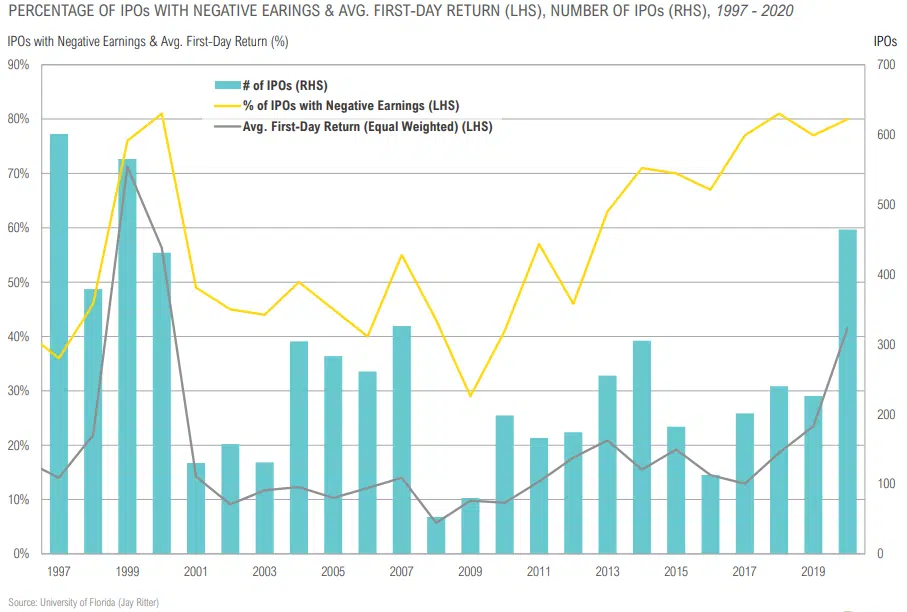
Lack of Profits was Not an Issue for Investors in 2020
Buyout & Venture Secondaries Remain Attractive
FIXED INCOME & CREDIT
“Only a crisis – actual or perceived – produces real change. When that crisis occurs, the actions that are taken depend on the ideas that are lying around. That, I believe, is our basic function: to develop alternatives to existing policies, to keep them alive and available until the politically impossible becomes the politically inevitable.”
– Milton Friedman, Economist, Author of Capitalism and Freedom
“MMT teaches us that if we have the real resources we need—that is, if we have the building materials to fix our infrastructure, if we have people who want to become doctors, nurses, and teachers, if we can grow all the food we need—then the money can always be made available to accomplish our goals. That is the beauty of a sovereign currency.”
– Stephanie Kelton, The Deficit Myth: Modern Monetary Theory and the Birth of People’s Economy
Fixed Income & Credit Summary
COMMENTARY & MARKET DATA
FIXED INCOME/ RATES
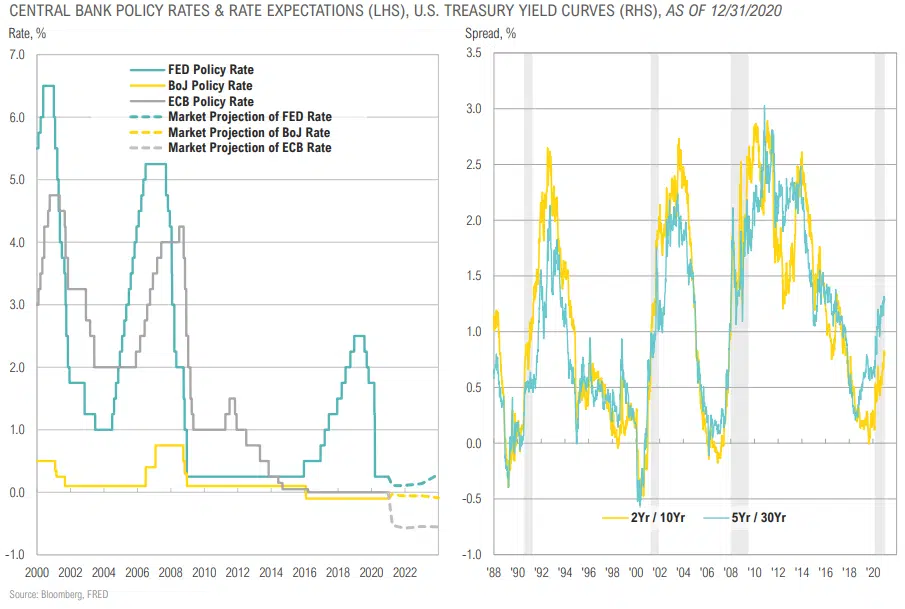
- Short-term rates will remain low for the foreseeable future.
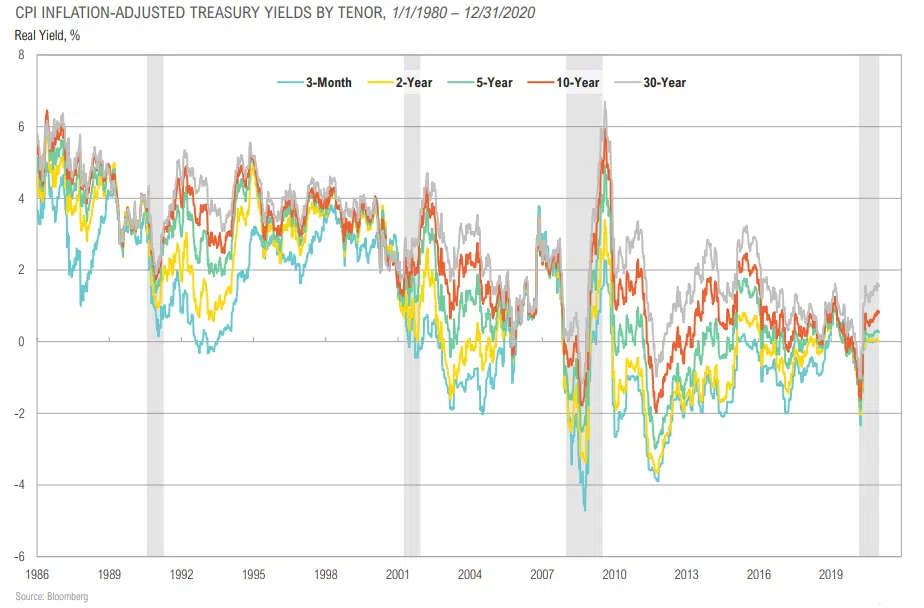
- The Fed’s new, somewhat opaque approach to generating inflation adds insult to injury for fixed income investors with low-risk thresholds, substantially raising the risk of negative real yields.
- U.S. Treasury yields may rise as a result of massive government spending, but a structural ceiling on developed market rates from demographics and debt overhang will likely not get overcome until persistent MMT-inspired stimulus via some form of ongoing Universal Basic Income (UBI).
CREDIT
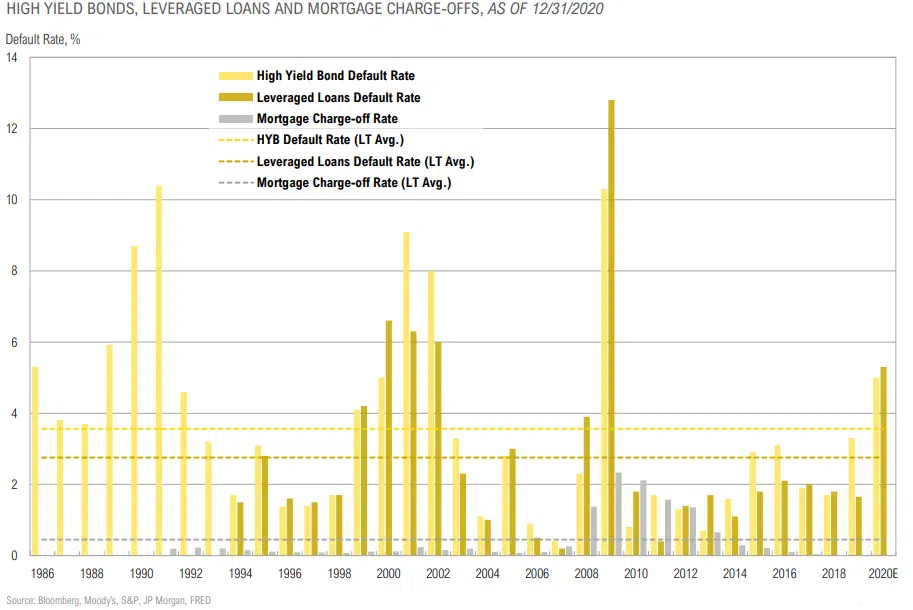
- Over the quarter, high yield bond spreads narrowed by 164 basis points from 5.50% to 3.86%, near their lowest levels ever.
- Central Bank intervention has removed tail risks in investment- grade bonds and some high yield bonds.
- Private credit remains attractive given higher rates of return and heightened economic volatility creating opportunity.
Source: Bloomberg
The Market is Pricing in Low Short-Term Rates for Several Years, but an Eventual Pickup in Growth/Inflation
Treasury Yields May Not Protect Investors for the Loss of Purchasing Power From Even Modest Inflation
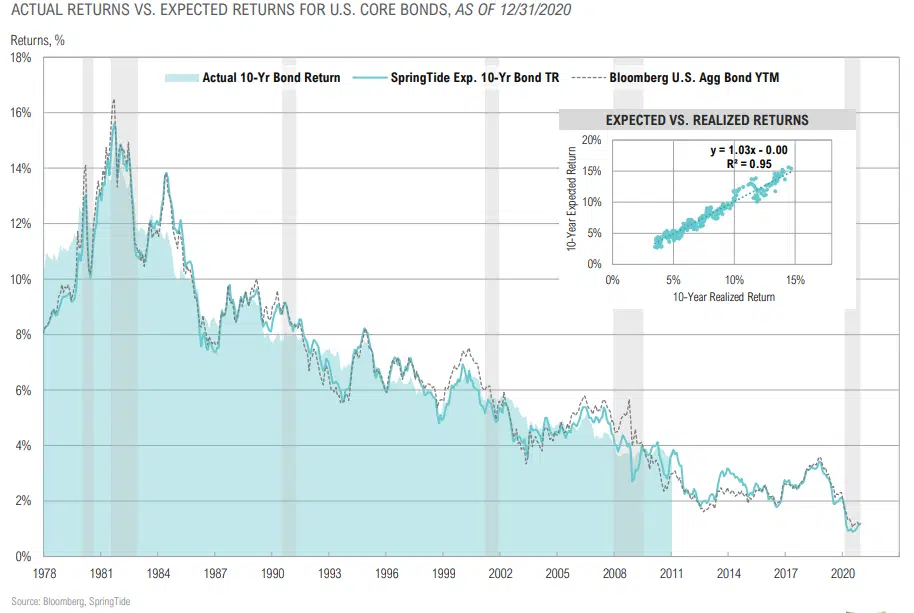
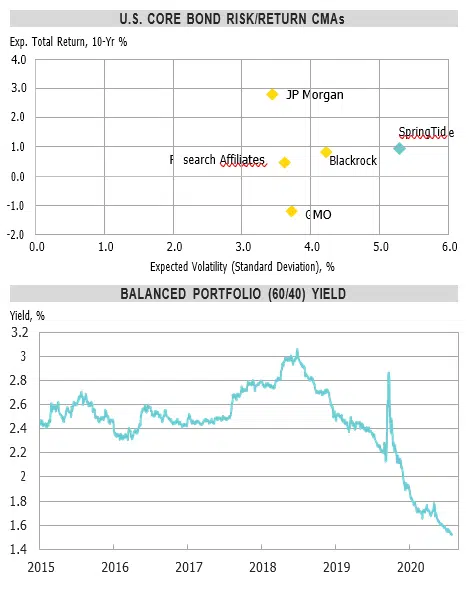
Core Bond Expected Returns ~1% for Next 10 Years
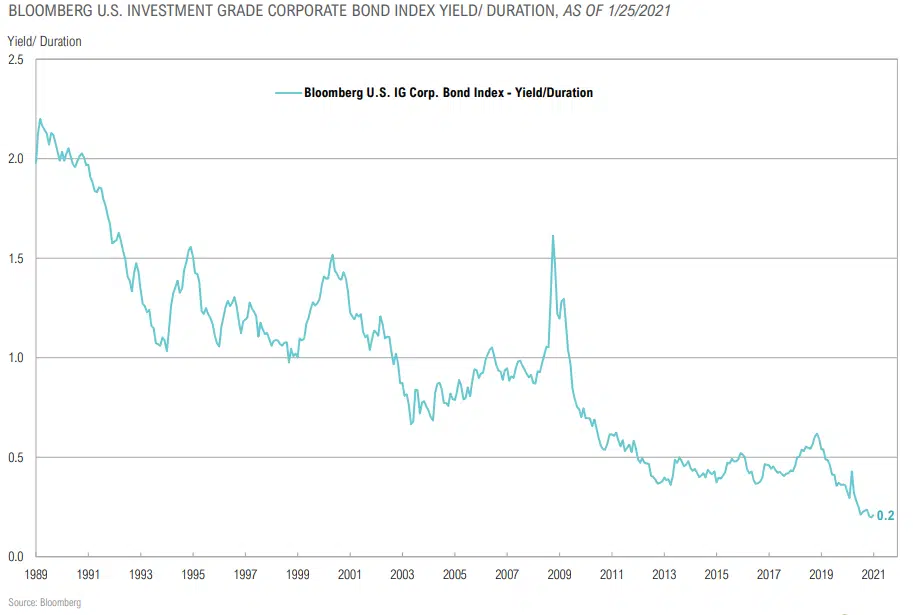
Sherman Ratio for U.S. Corporate Bond Market
An Extra 1.5% in Credit Premium if the Fed Supports High Yield Bonds
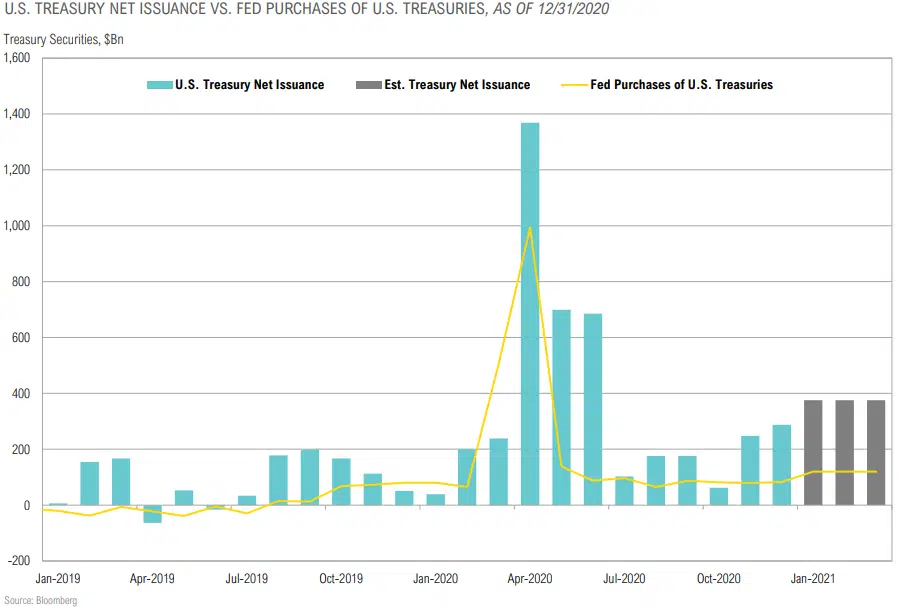
The Fed Will Likely Have to Increase Purchases To Keep Up with Issuance
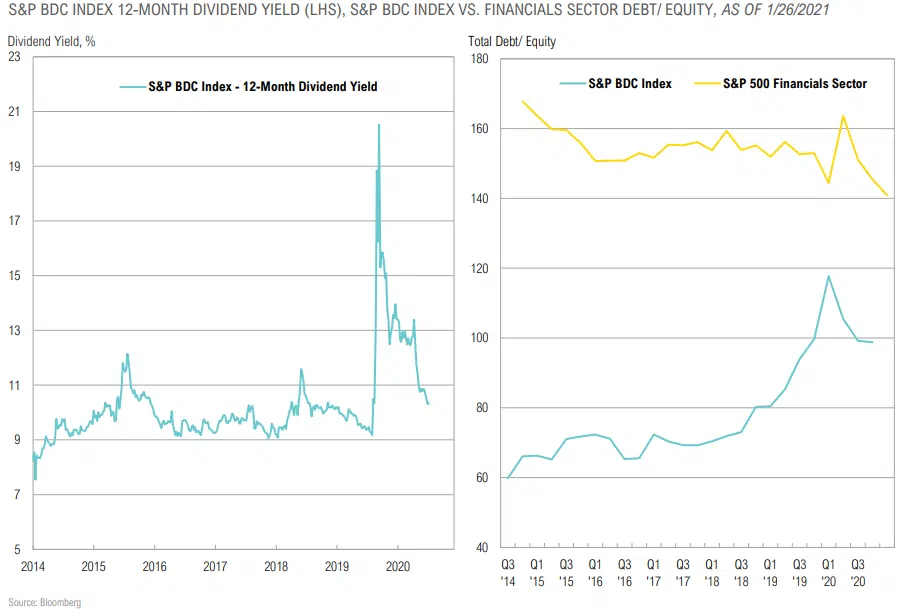
At 10%, BDC Yields Look Attractive in Higher Quality Names
REAL ASSETS
“When legislators, after having ruined men by [spending] and taxes, persevere in their idea they say to themselves, ‘If the people suffer it is because there is not money enough. We must make some.’ And as it is not easy to multiply the precious metals, especially when the pretended resources of prohibition have been exhausted, they add, ‘We will make fictitious money, nothing is more easy, and then every citizen will have his pocket-full of it, and they will all be rich.”
– Frederic Bestiate, French Businessman & Economist (1801-1850)
Real Asset Returns
Real Assets Summary
COMMENTARY & MARKET DATA
COMMODITIES
- Commodities are in a bottoming process as declining demand is being met with reduced Coupled with a potential structural shift higher in inflation in the coming years, we are near (or at) an attractive entry point.
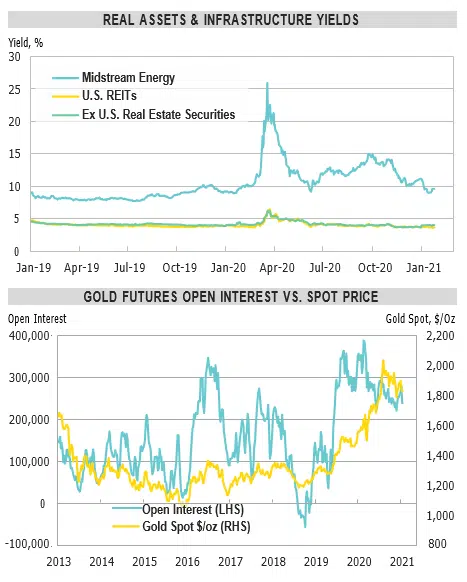
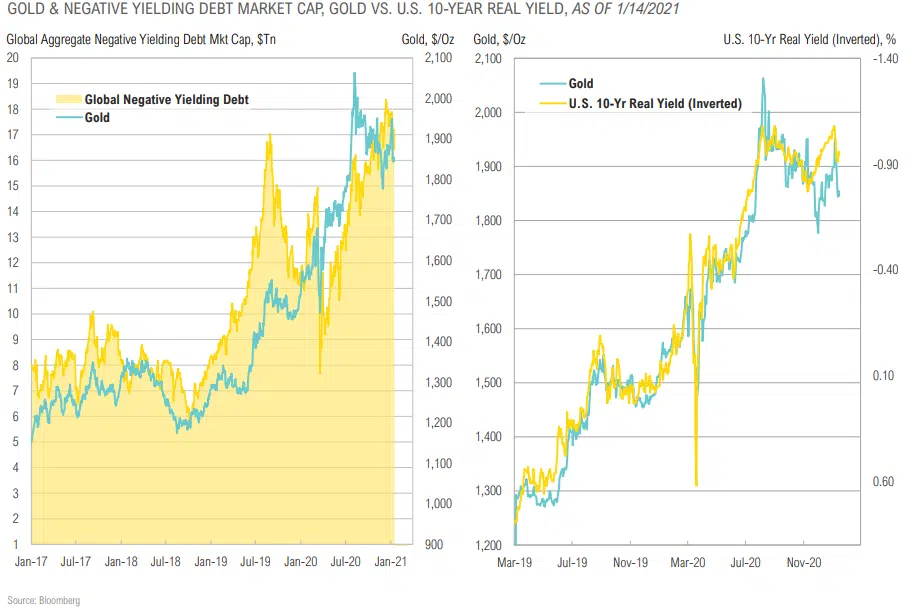
- Gold will continue to benefit if the pool of negative-yielding sovereign debt (>$16 trillion now) grows or fiscal spending/quantitative easing programs persist.
REAL ESTATE
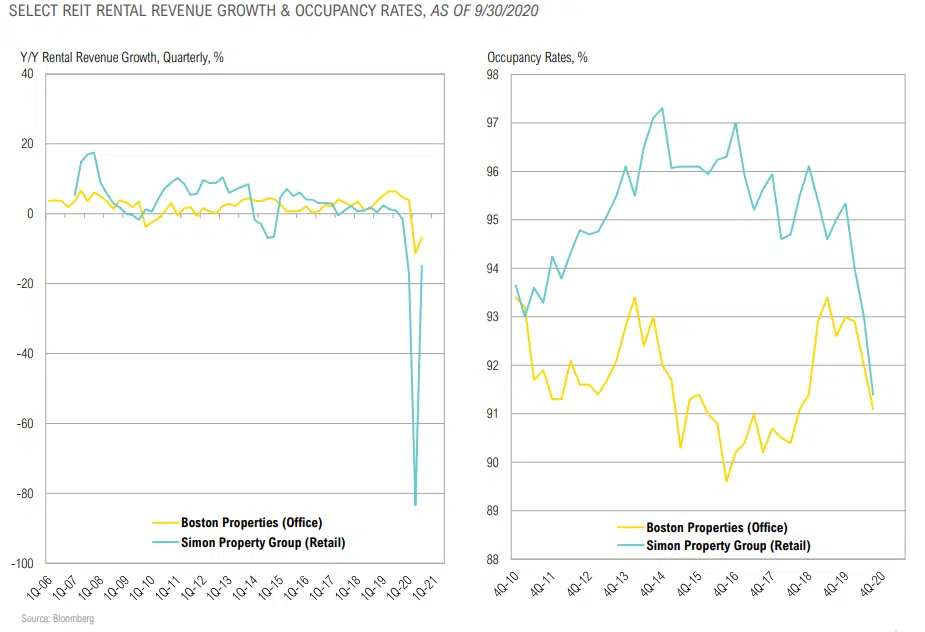
- Commercial real estate is at the epicenter of redefining normal as we exit the Covid-19 crisis. Shifts in corporate headquarters, flight from urban areas and flexible work environments foster continued uncertainty. REITs were down 7.6% in 2020.
- Opportunities are emerging in public and private markets as some sectors (industrial, warehouse/ fulfillment) are booming and others are in deep distress (retail, entertainment, hospitality and office).
ENERGY & INFRASTRUCTURE
- The energy space remains oversupplied in the short-term, but reduced supply should force the market into balance in
- According to the Energy Information Administration, S. production is currently down 17% from pre-Covid levels.
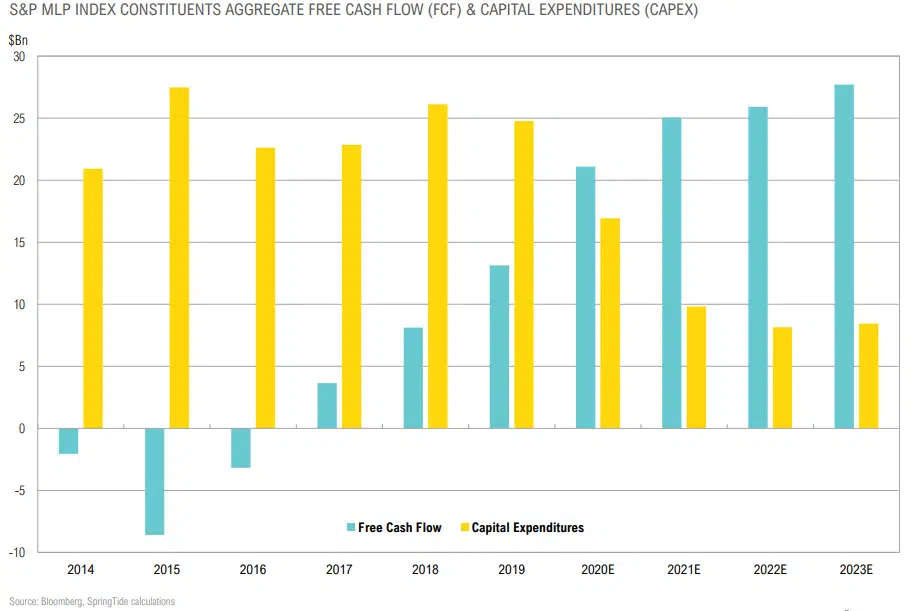
- The midstream space has dramatically cut capex which should allow free cash flow to continue to grow, as it did in 2020.
Source: Bloomberg
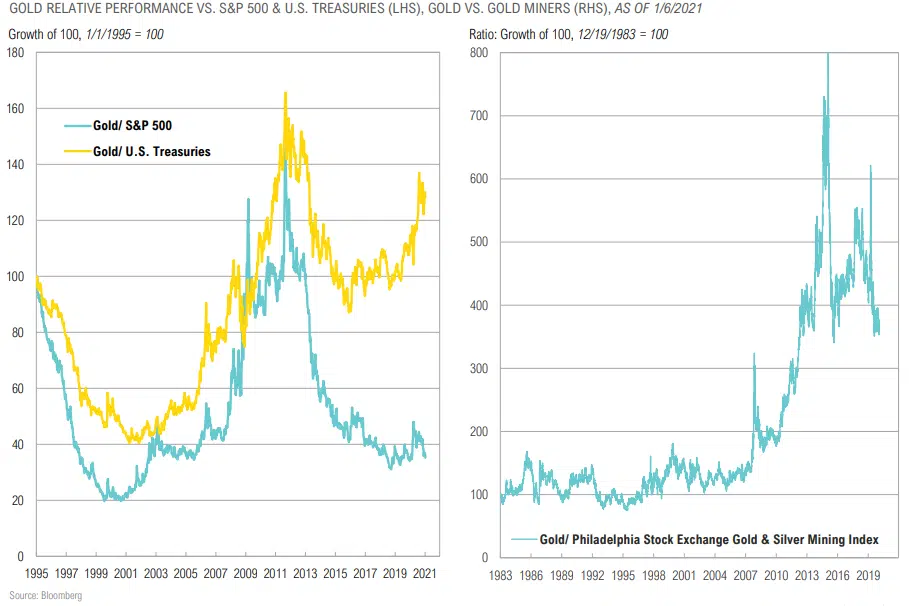
Why Gold? Gold Viewed as an Alternative Safe Haven
Gold has Room to Run vs. Core Stocks & Bonds… & Miners Have Room to Run vs. Physical
MLPs Expected to Continue Capex Cuts, Grow FCF
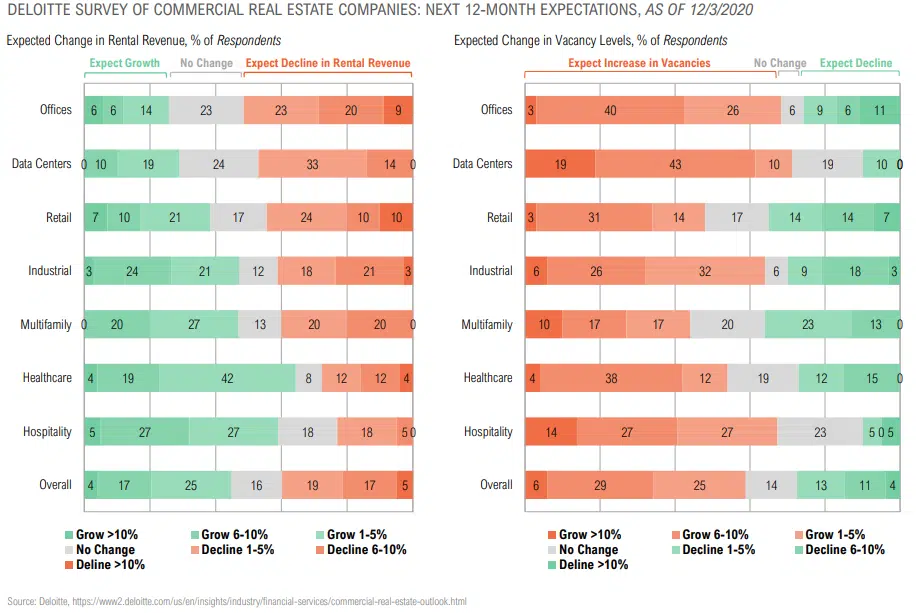
Global Commercial Real Estate Expectations
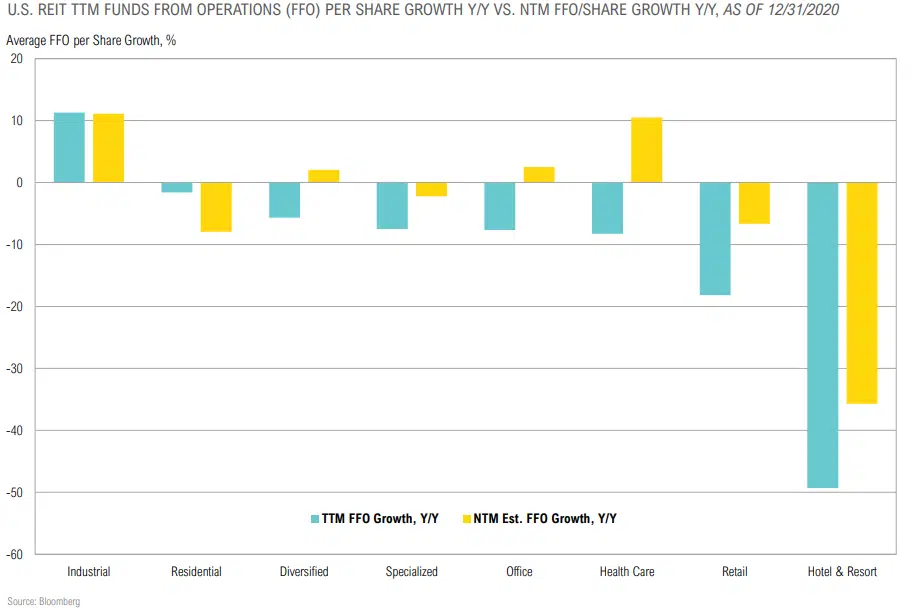
Market Expectations for U.S. REITs vs. Trailing 12-Months
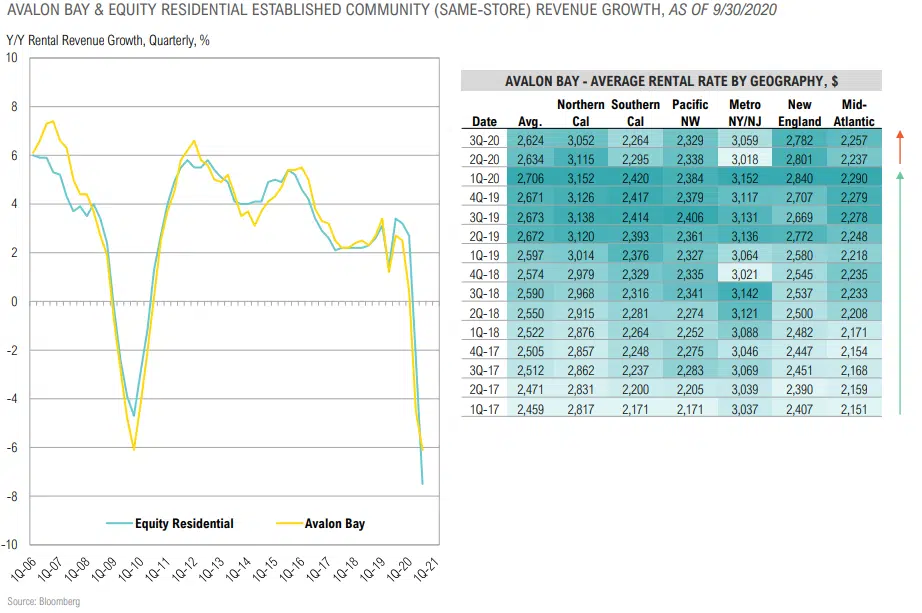
Coastal Property Rental Revenues Have Declined 6%
Broad Declines Across Commercial RE Rental Revenues and Occupancy Rates
OPPORTUNISTIC
“If the financial system has a defect, it is that it reflects and magnifies what we human beings are like. Money amplifies our tendency to overreact, to swing from exuberance when things are going well to deep depression when they go wrong. Booms and busts are products, at root, of our emotional volatility.”
– Niall Ferguson, Historian & Fellow at Hoover Institution
Opportunistic Strategy Returns
Opportunistic Strategies Summary
COMMENTARY & MARKET DATA
OPPORTUNITY SET IN CORE ASSET CLASSES
- The yield on a diversified portfolio of global stocks and S. bonds declined to ~1.5%, an all-time low.
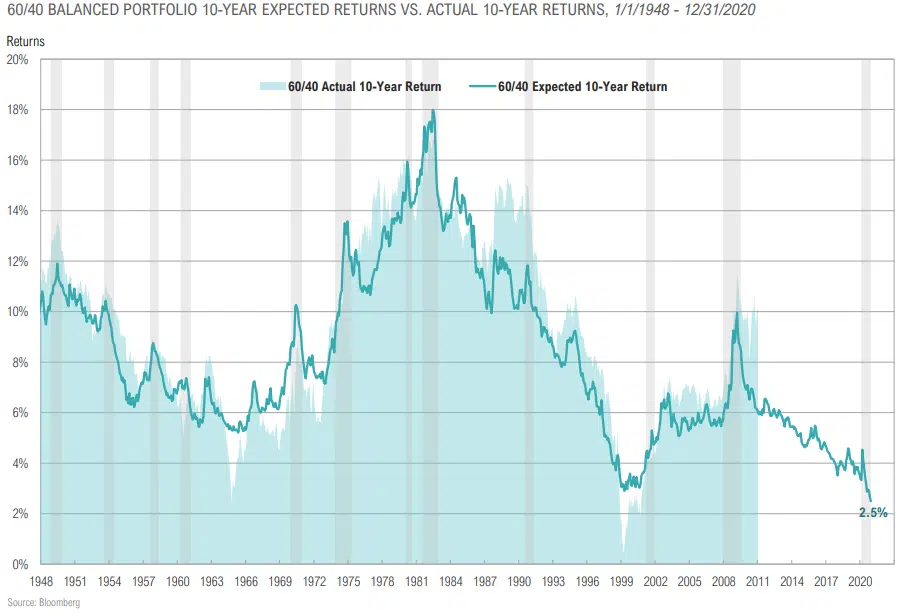
- Near record low hurdle rate/opportunity cost of U.S. core 60/40 portfolios (expected 10-year nominal returns of ~2.5%) and higher expected volatility.
OPPORTUNISTIC STRATEGIES
- Despite low opportunity cost, high fees and declining manager
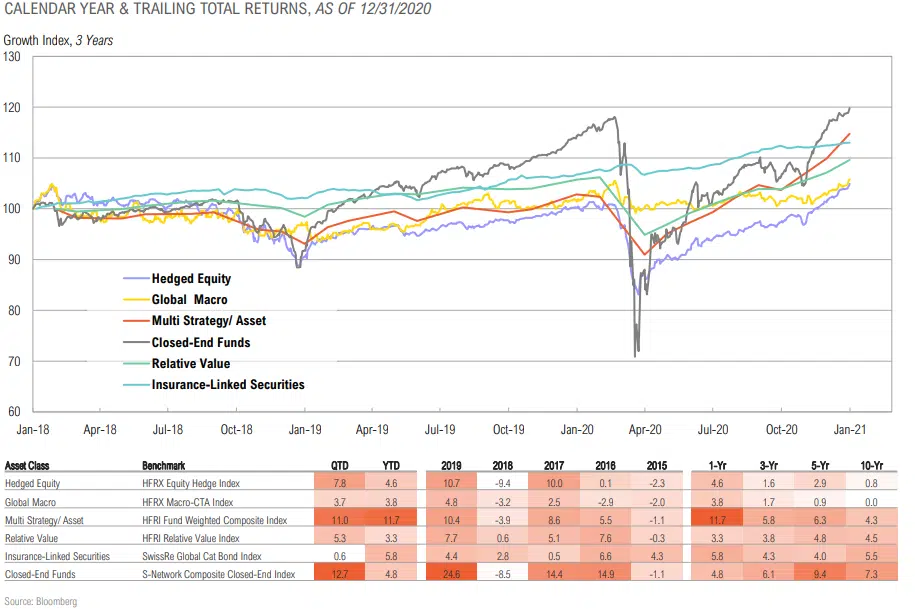
alphas remain a large deterrent for most hedge fund allocations; however, the “riches are in the niches” – high quality boutique managers have the potential to add value given increased volatility. - Closed-end funds rallied (+12.7%) with broad based gains across most asset classes.
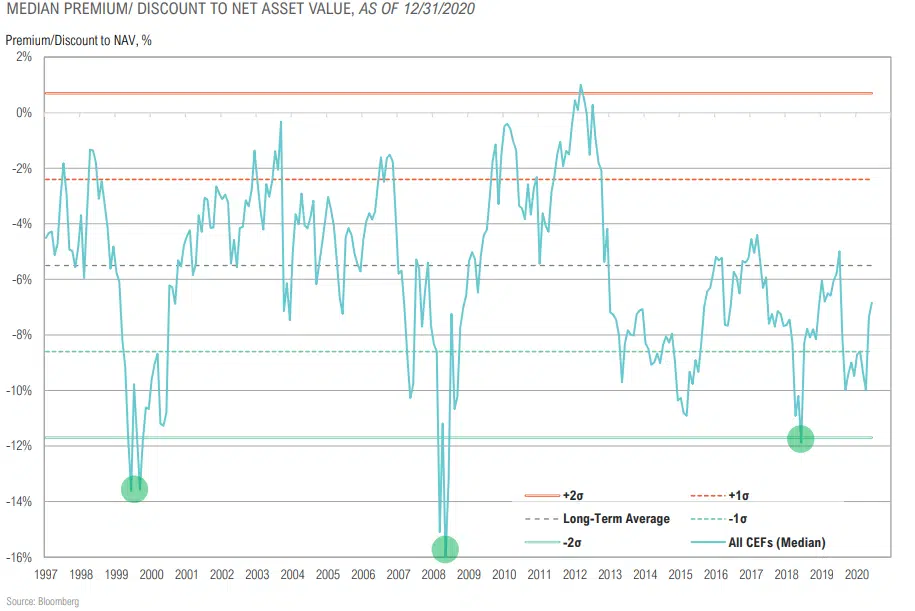
- The closed-end funds space is less attractive as discounts have narrowed to roughly 7%, not much wider than the longterm average of about 5%.
Source: Various, external CMAs are as of March to October 2020 and are nominal. GMO assumptions are
Expected Returns for Passive “60/40” Portfolio Near All-Time Low
Average Closed-End Fund Discounts Narrowed in December
ASSET ALLOCATION
“The one reality that you can never change is that a higher-priced asset will produce a lower return than a lower-priced asset. You can’t have your cake and eat it. You can enjoy it now, or you can enjoy it steadily in the distant future, but not both – and the price we pay for having this market go higher and higher is a lower 10-year return from the peak.”
-Jeremy Grantham, GMO, January 2021
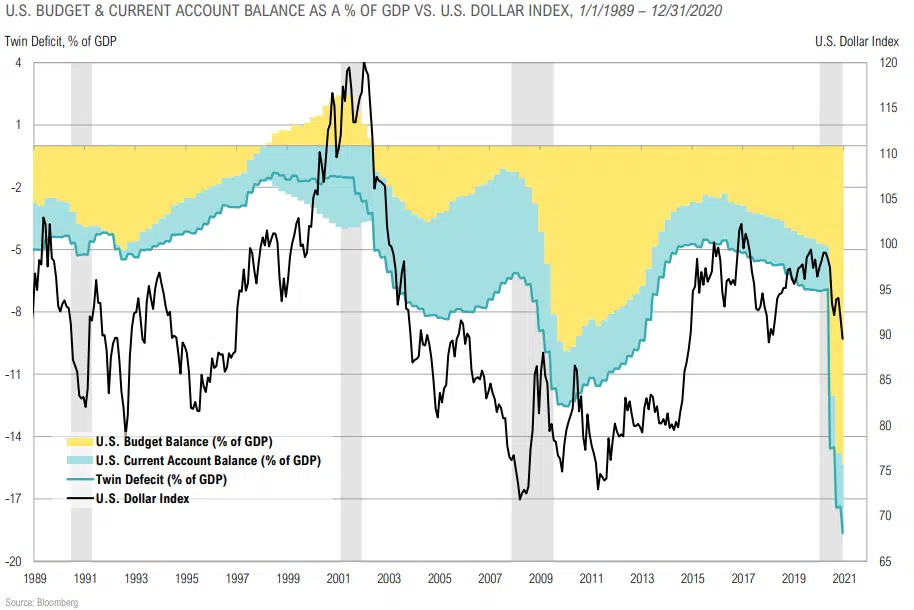
Growing Twin Deficit = Major Headwind for USD
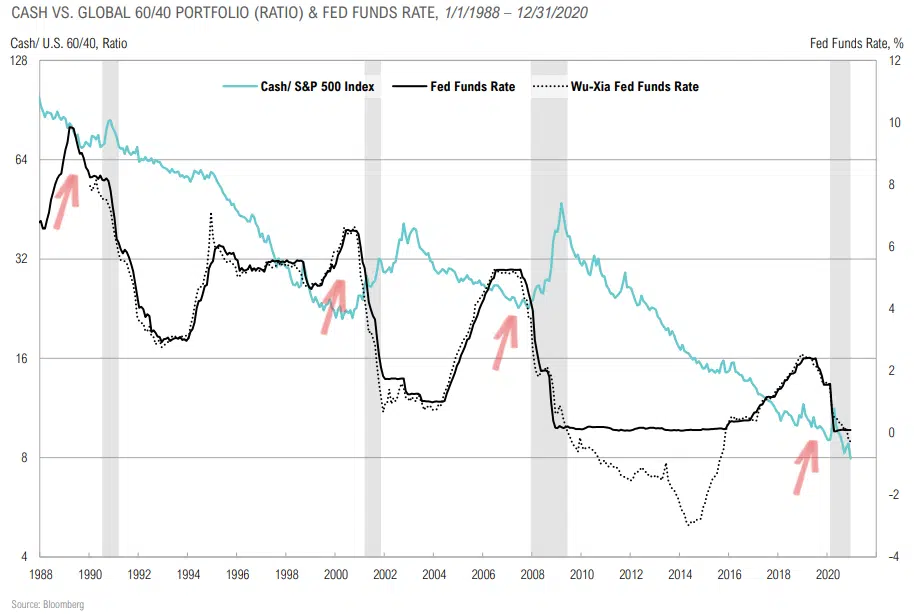
Cash Priced in Stocks vs. Short-Term Interest Rates