SUMMARY
“This did not start as a financial crisis, but it is morphing into a major economic crisis, with very serious financial consequences…There’s a long road ahead.”
– Carmen Reinhart, World Bank Chief Economist, Oct 16, 2020

Q3, 2020 Market Review
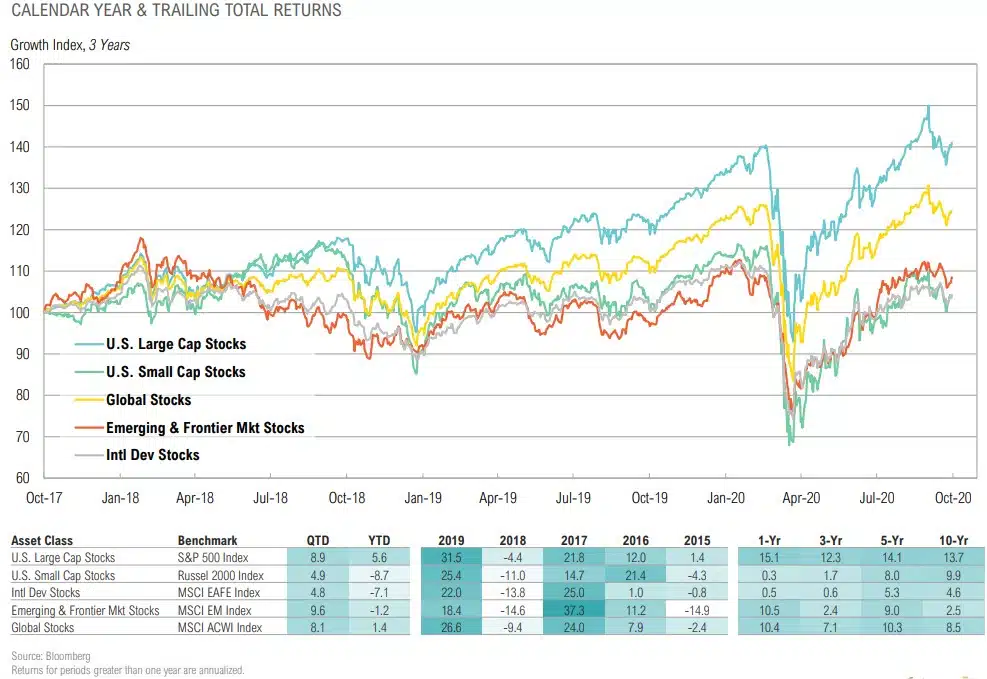
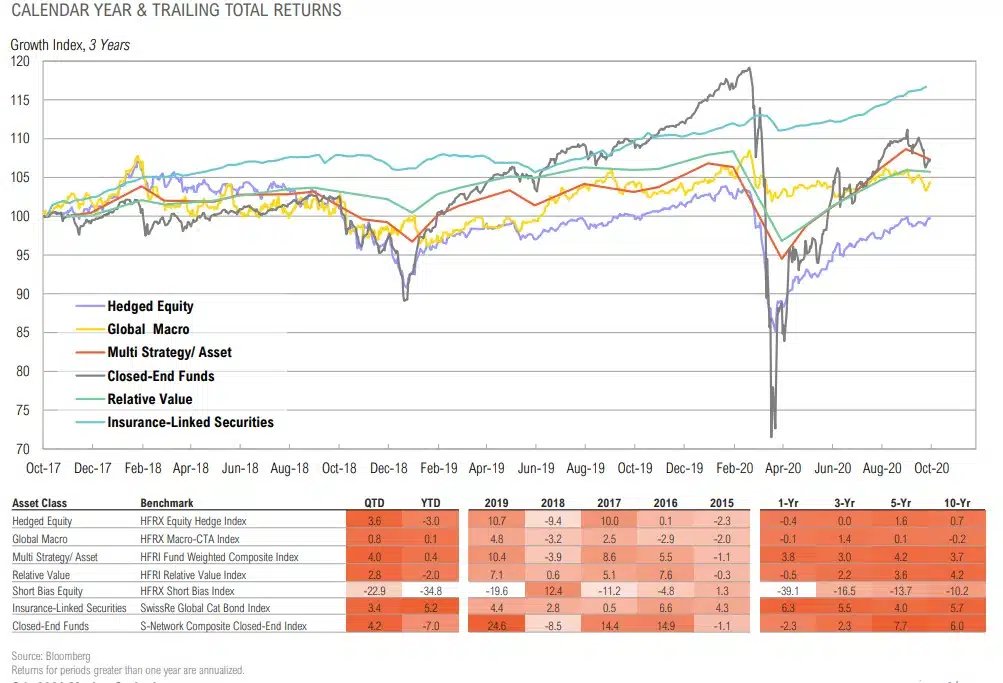
QTD & YTD TOTAL RETURNS
ASSET CLASS RETURNS
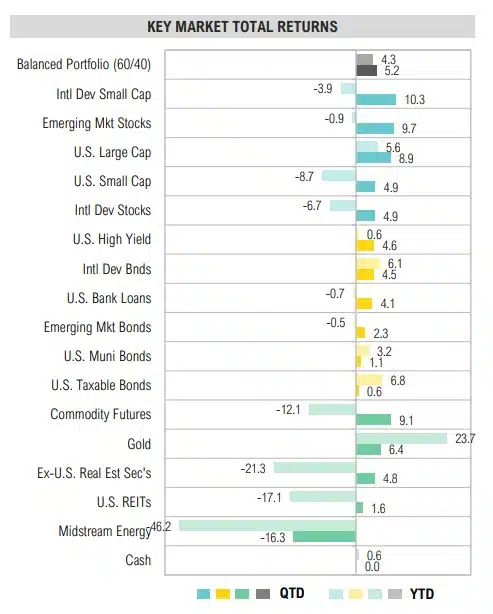
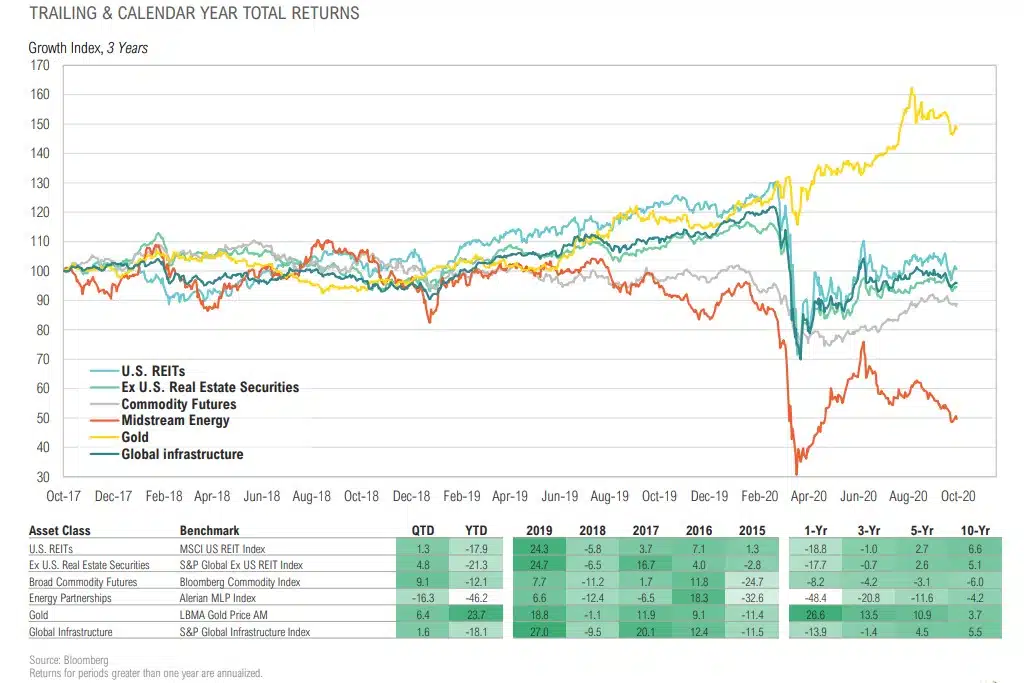
- Risk assets performed well with international developed small cap stocks (+10.3%) and commodity futures (+9.1%) being notable top-performers.
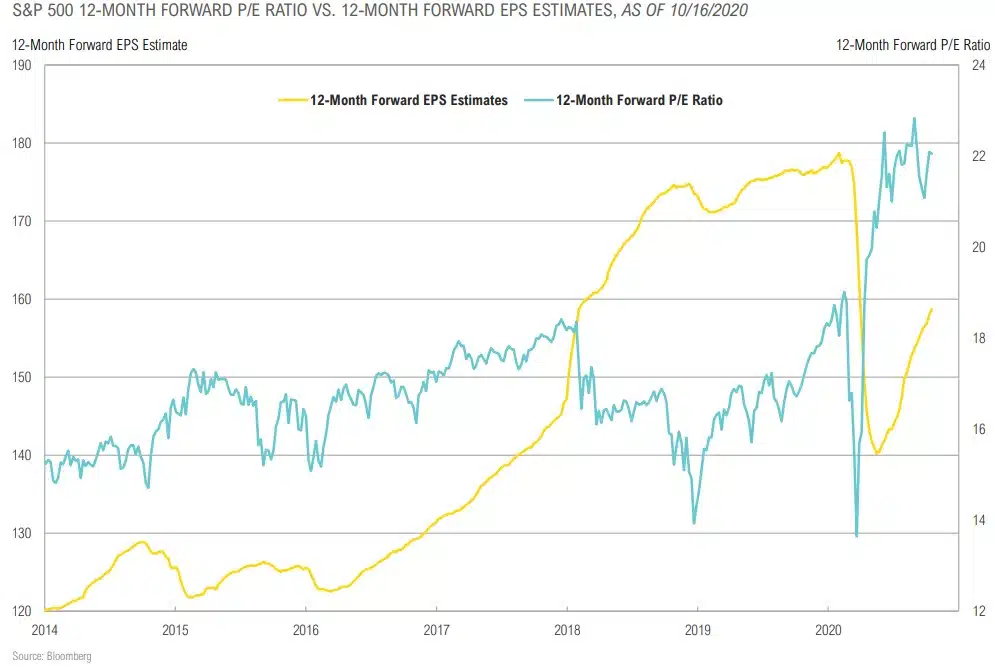
- U.S. large cap stocks, as measured by the S&P 500 Index, remain the only stock market in positive territory for the year to date. This despite earnings estimates for the next 12 months being 11% below where they were on January 1.
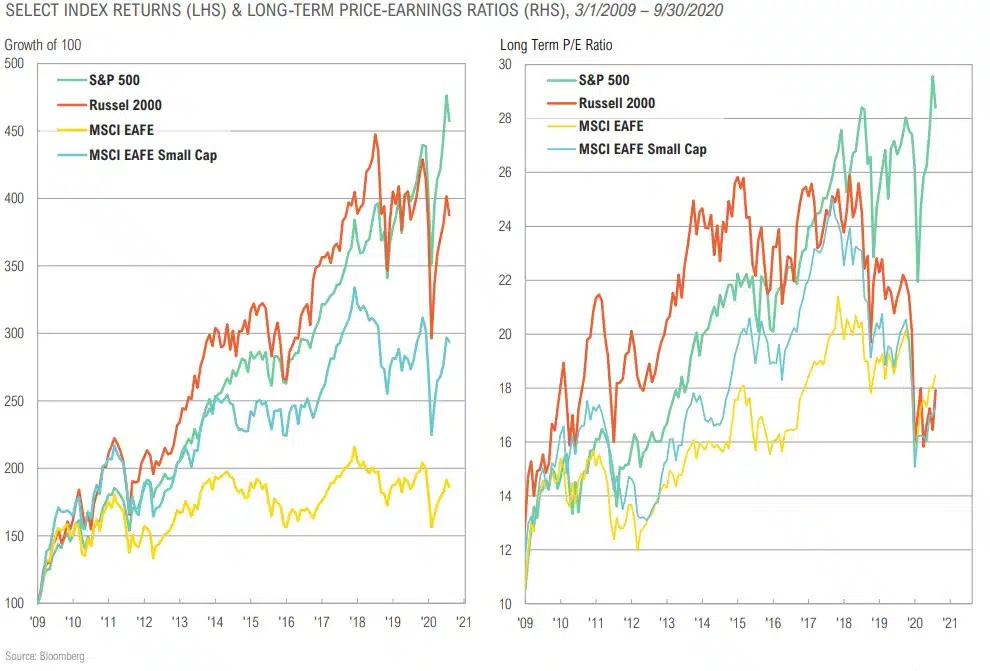
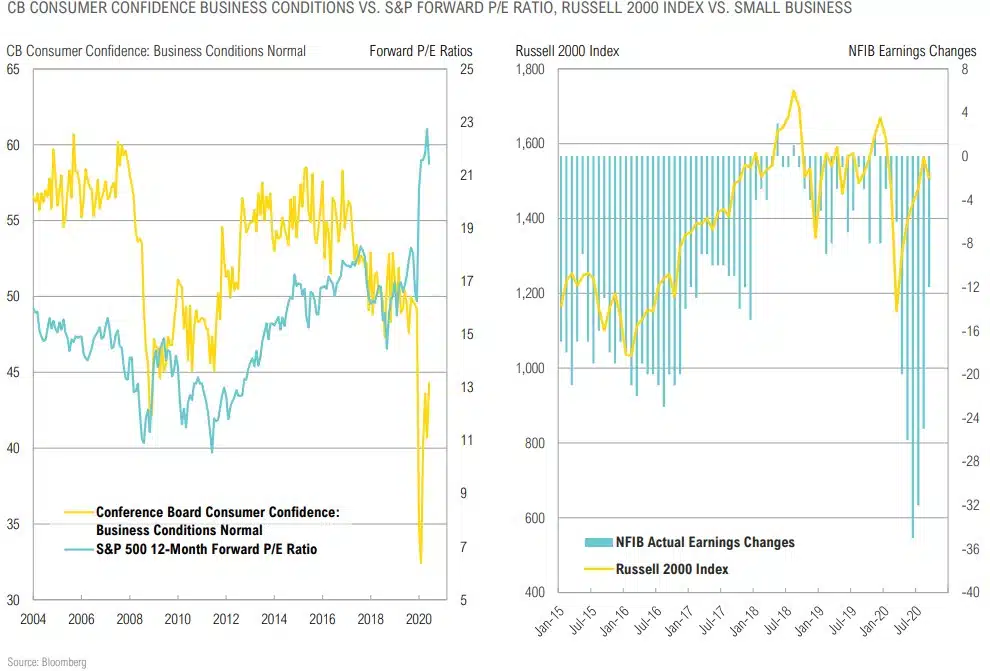
- The 12-month forward P/E ratio for the S&P 500 Index reached 22.8 during Q3, its highest level since 2000.
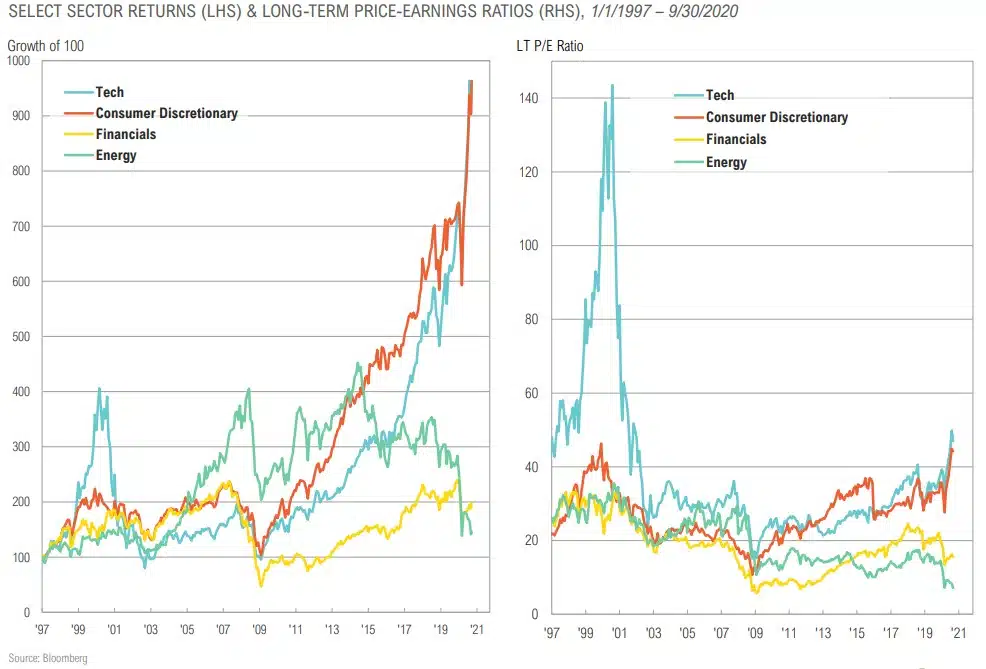
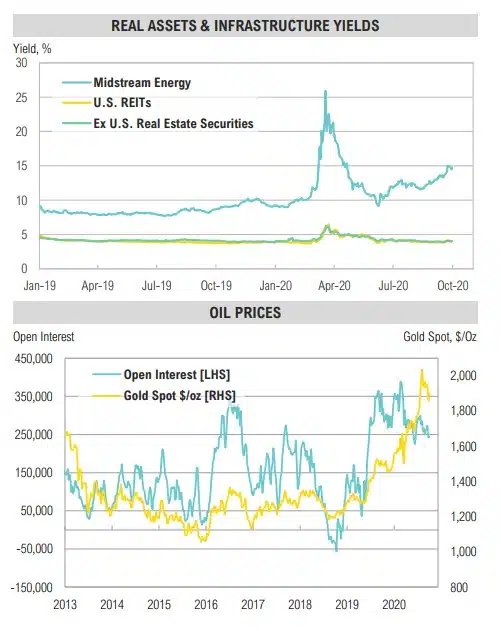
- The energy sector fell 20% in Q3 and remains deeply out of favor due to an anemic demand backdrop that kept oil and gasoline inventories above their 5-year ranges for most of the quarter.
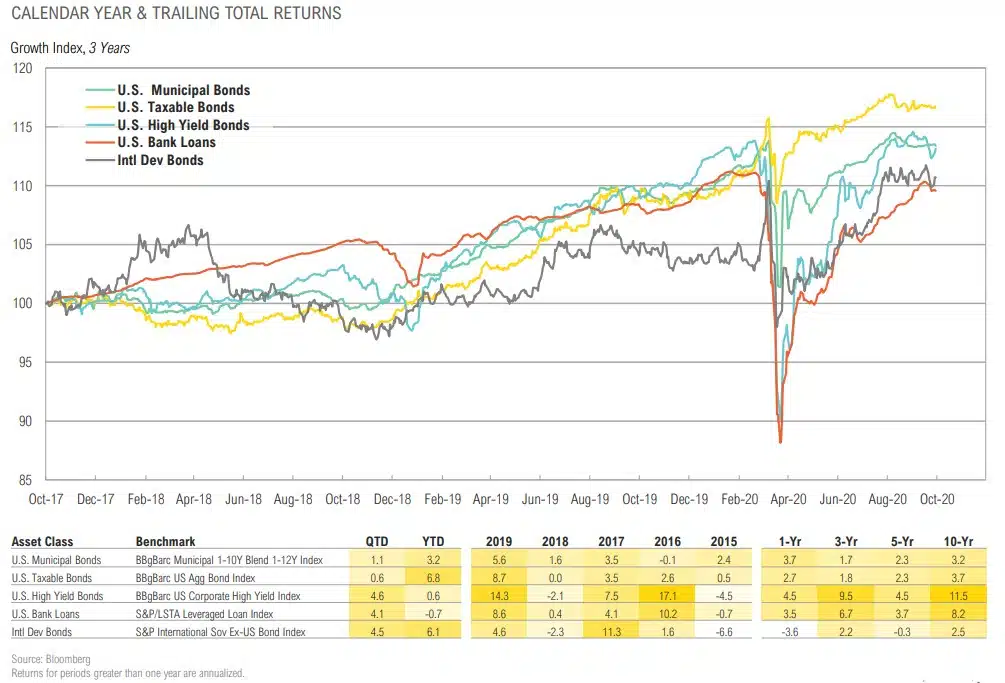
- All fixed income and credit sectors rallied for the quarter as rates remained low and credit spreads narrowed on continued support by the Federal Reserve and an overall increase in risk appetite.
- While still positive, U.S. investment-grade bonds were the worst performing sector, delivering 0.6% for the quarter.
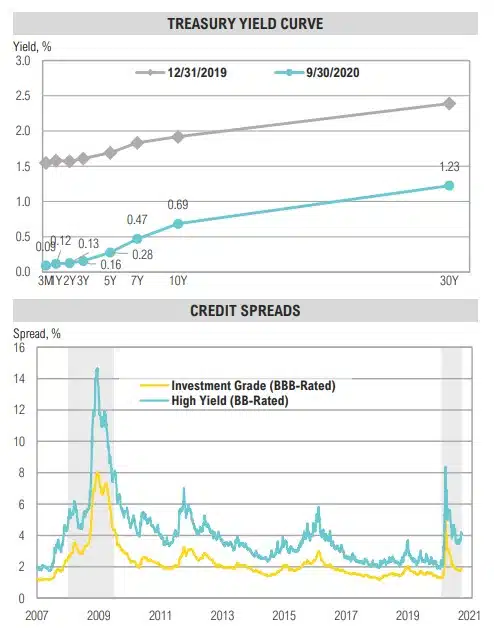
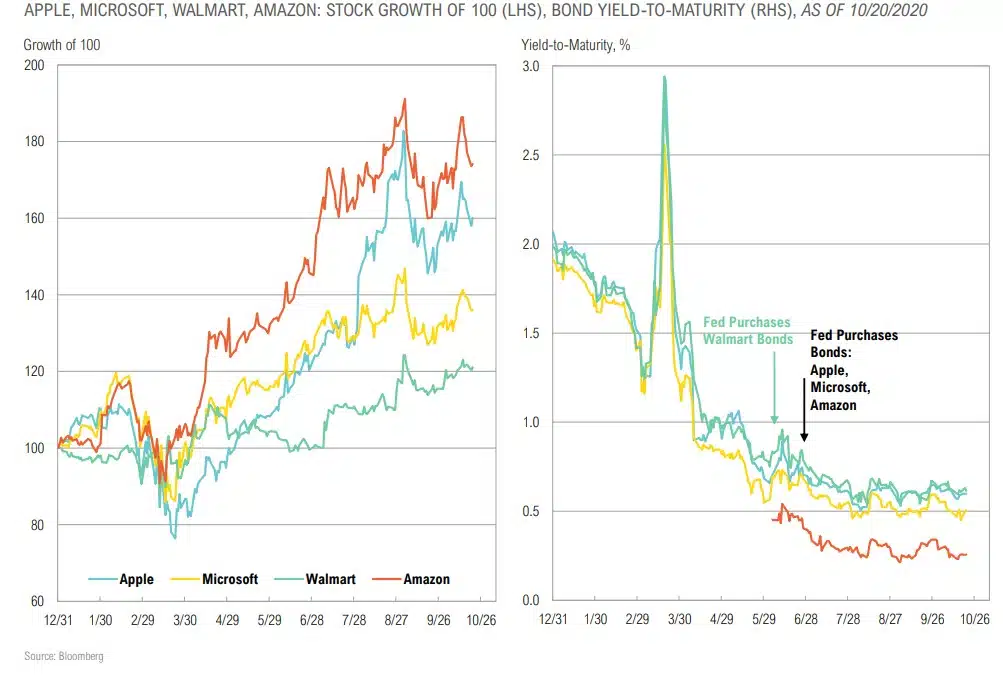
- High yield bond spreads narrowed by 94 basis points from 6.44% to 5.50% as the Fed continued to support the corporate credit markets through the purchase of bonds and bond ETFs. As of September 30, the Fed has purchased $8.6 billion of ETFs and $4.4 billion of direct bonds (just over 1% of what was authorized).
- It remains feast or famine in the real assets space with energy related assets continuing to languish while gold added to its impressive year-to-date lead over other major asset classes.
GROWTH, INFLATION & POLICY
“The recovery will be stronger and move faster if monetary policy and fiscal policy continue to work side by side to provide support to the economy until it is clearly out of the woods.”
– Jerome Powell, Federal Reserve Chairman, October 2020
Growth, Inflation & Policy Summary
COMMENTARY & MARKET DATA
GROWTH
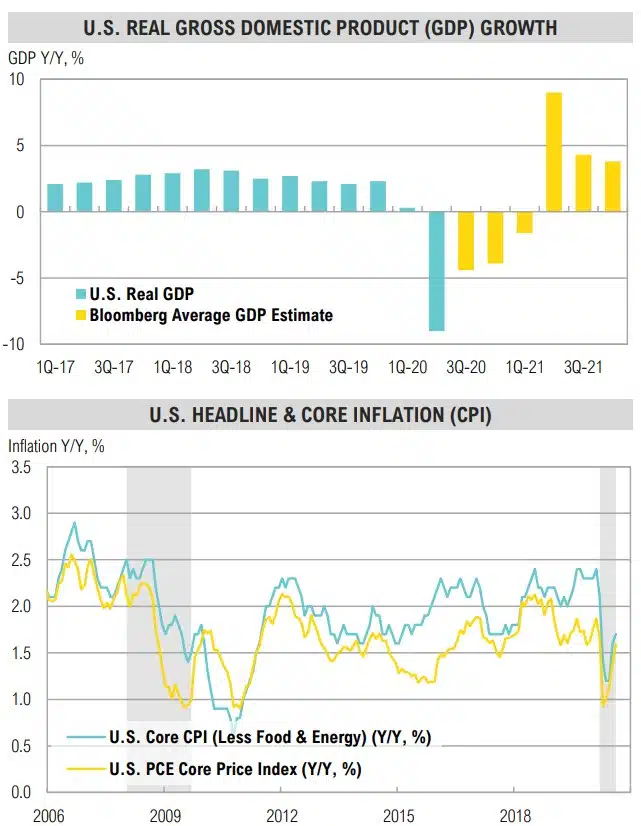
- The global economy is gradually emerging from the severe recession it entered earlier in the year. Growth has been stabilized but underlying economic and market trends expose an extremely uneven recovery – parts of the global economy remain in depression while some sectors are booming.
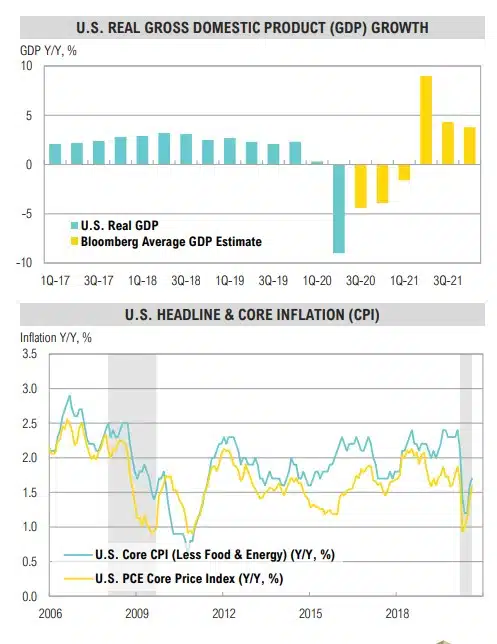
- U.S. real GDP growth is expected to have dropped 4.4% year over-year in Q3 but is expected to bounce back in 2021.
INFLATION
- U.S. headline and core inflation rose modestly during the quarter. While current inflation is low, long-term inflation expectations as measured by the 10-year treasury-implied or breakeven inflation rate trended higher over the quarter, ending September at 1.6% (up from 1.3% in June).
- Global inflation will stay contained during the crisis. Tech and excessive debt levels will also subdue inflation until MMT inspired “helicopter money” becomes ongoing policy.
POLICY
- To date, fiscal stimulus has been more reactive (replacing lost income) than proactive (stimulus). We expect that to change next year regardless of who controls Congress and the White House.
- The structural change to higher inflation may take as long as until the next general election in 2024, but we believe it may be inevitable given shifting demographics there is no political appetite or will for the alternative.
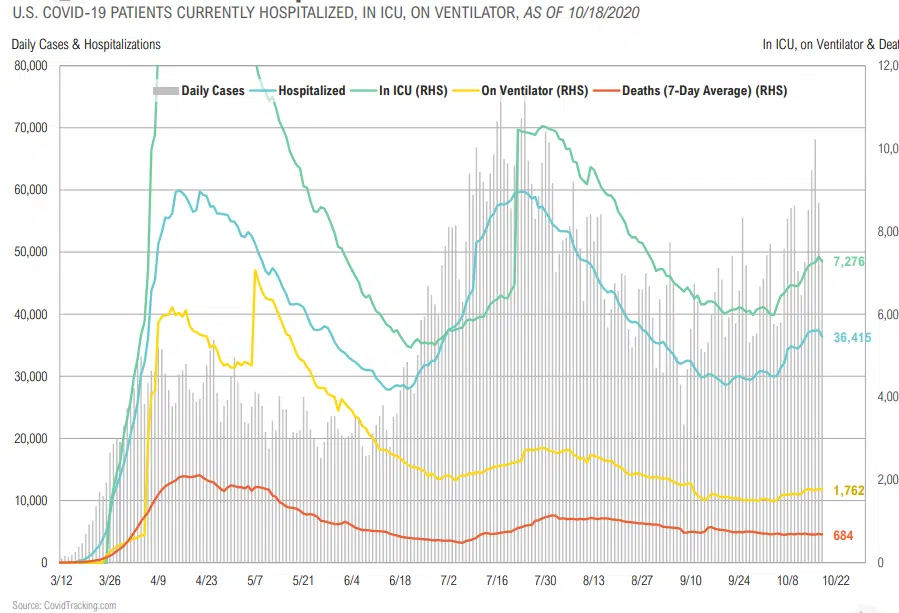
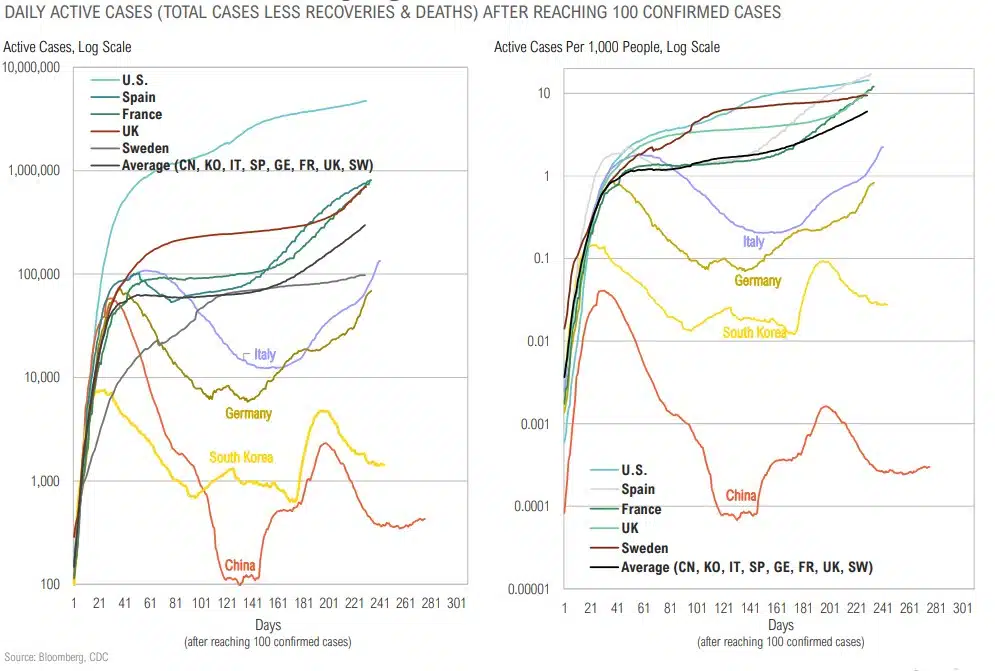
Surge in Cases & Hospitalizations But Not Deaths
Similar Patterns Are Playing Out Across the World
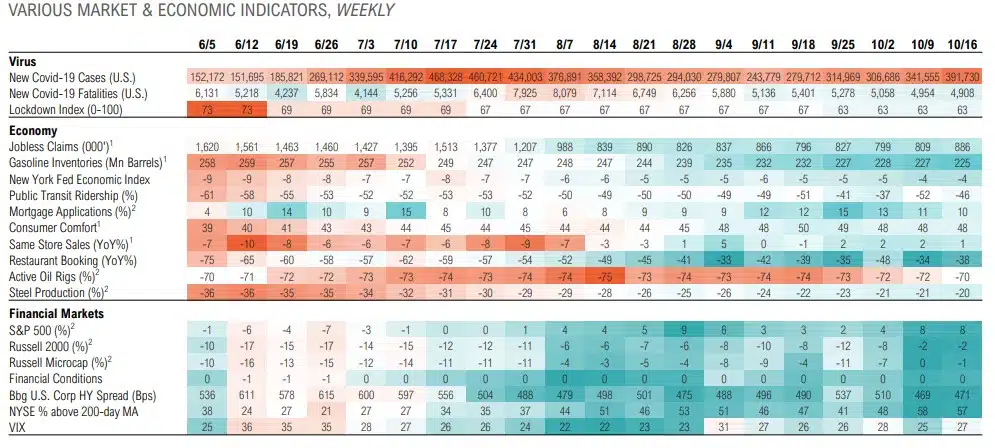
Tracking the Recovery
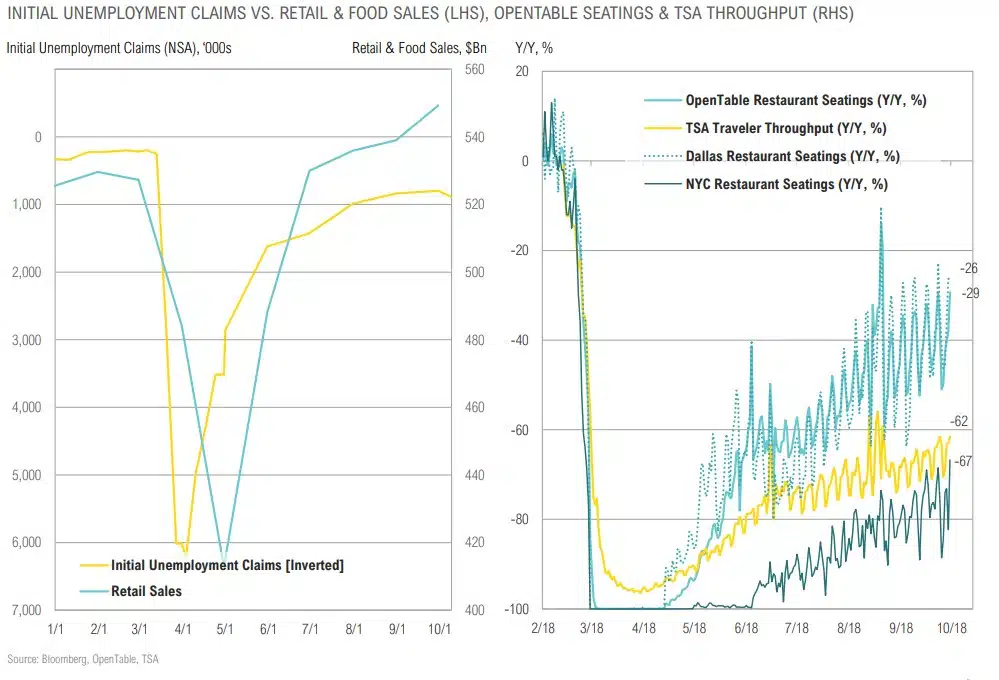
Feast in Retail Sales, Famine in Labor Market
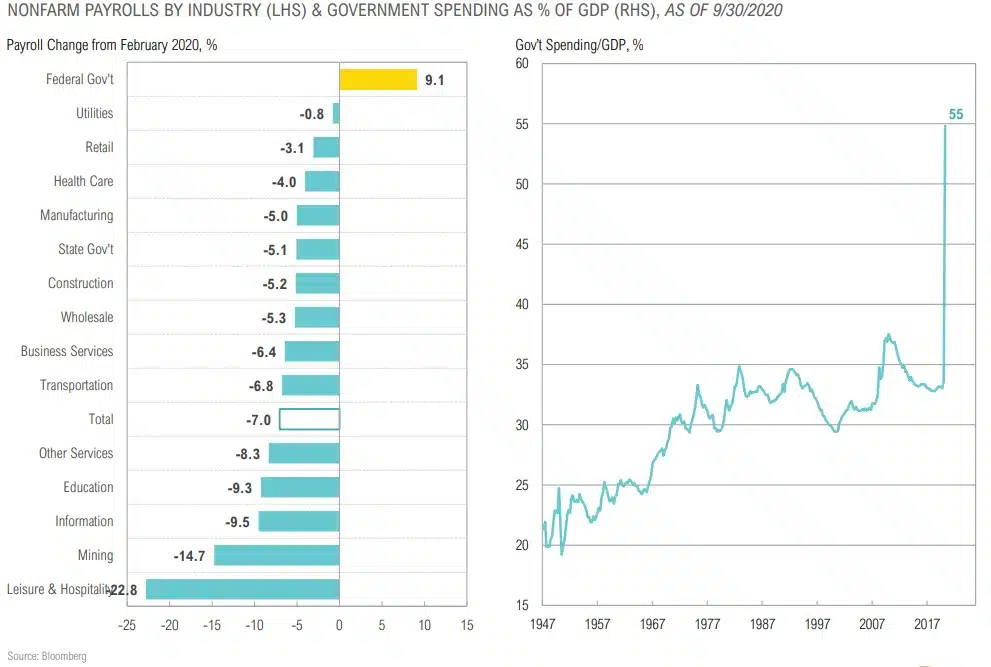
Feast in Government Spending, Famine in Leisure & Hospitality
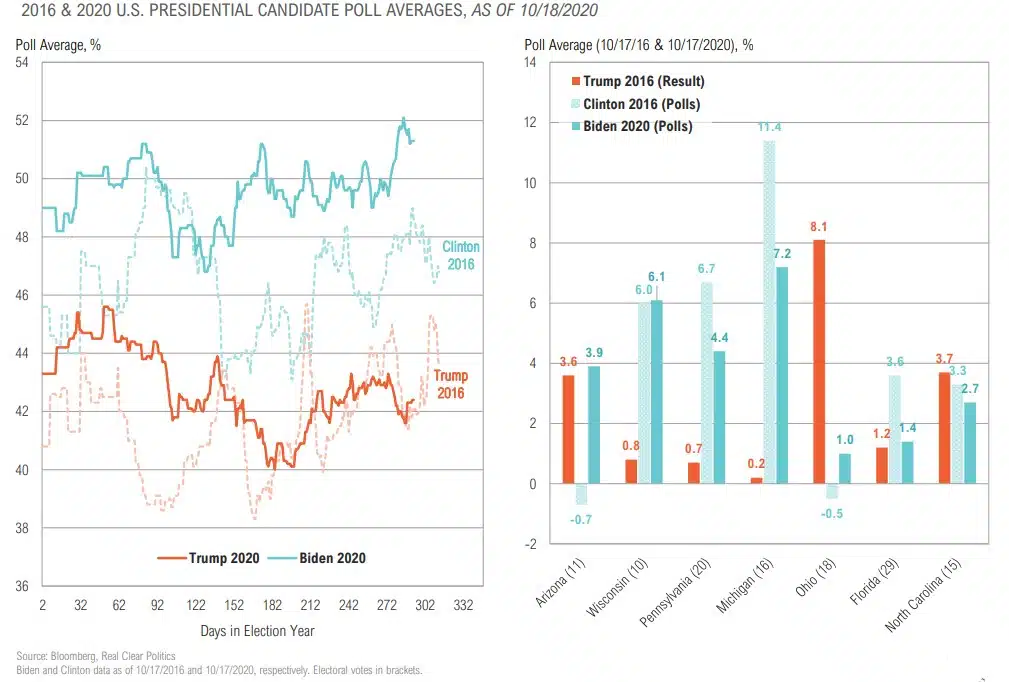
The Battle for the White House
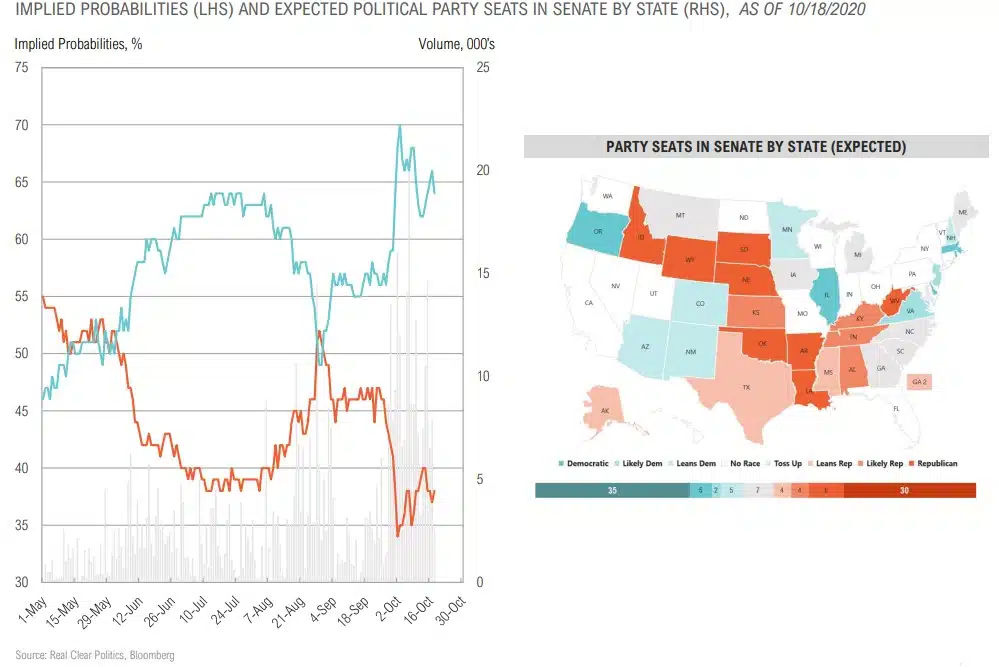
The Battle for the Senate
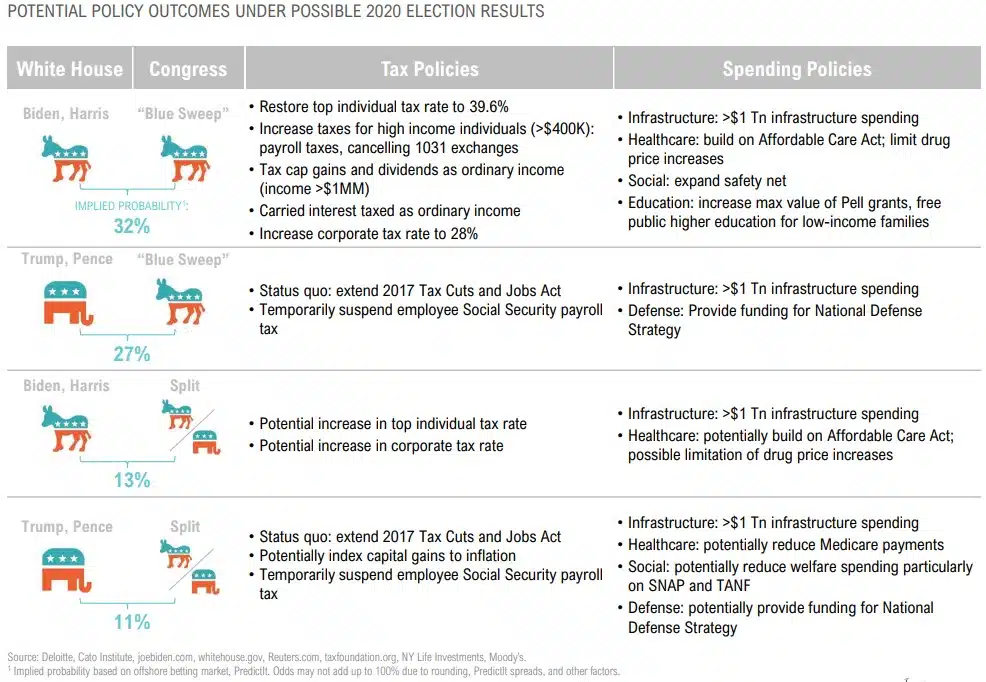
Scenario Analysis of Possible Policy Outcomes
EQUITY
“…one of the things that’s going on in the crisis is people are seeing that there continues to be efficiency in scale. As the world continues to digitize, it requires greater investment, and that obviously advantages companies with scale.”
– David Solomon, Goldman Sachs CEO, Oct 14, 2020
Equity Returns
Equity Summary
COMMENTARY & MARKET DATA
PUBLIC MARKETS
- On an absolute basis, U.S. equity valuations are back in the top-quintile, implying muted forward long-term returns substantially below those of the last decade.
- U.S. equity valuations are elevated relative to foreign developed and emerging equities, but growth rates are better, and the policy backdrop is more supportive in the U.S.
- Lower valuations in Europe reflect structural challenges faced by a continent that continues to get squeezed by competition from the U.S. and China. Hold some, but stay underweight.
- We continue to favor large cap indices over small cap indices, but active small cap managers over large cap indices, reflecting a better opportunity set for active managers in the small cap space.
- Long-term return expectations for emerging market equity remain relatively stable as higher growth rates should drive earnings growth in excess of developed peers; tactical outlook impacted dramatically by significant disruption due to Covid-19 crisis and the potential for a liquidity crisis in several countries.
PRIVATE MARKETS
- Even net of higher fees, select investments in high quality venture capital and private equity can add value for clients that have the capacity for reduced liquidity.
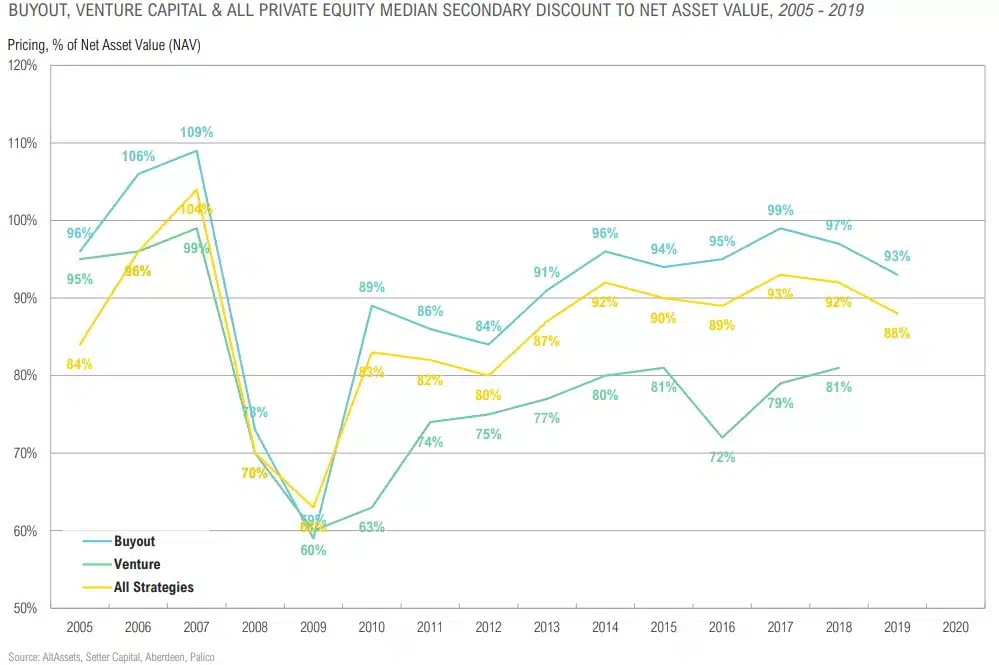
- Secondaries may be particularly attractive if investors who may have overallocated to private markets late in the cycle are forced to seek liquidity in the coming months/years.
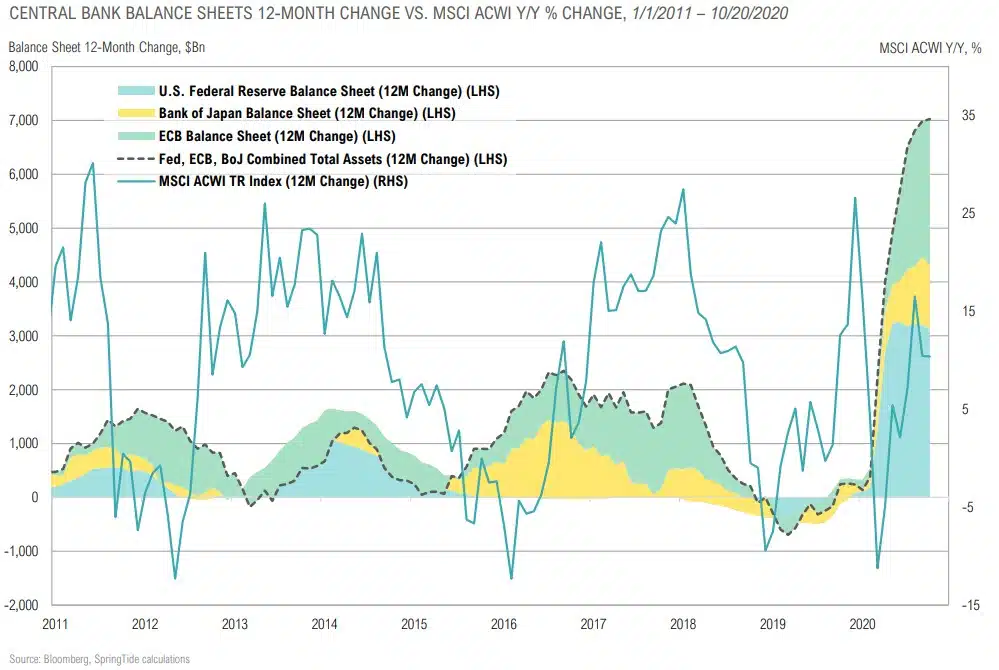
Central Bank “BS” and Global Stocks
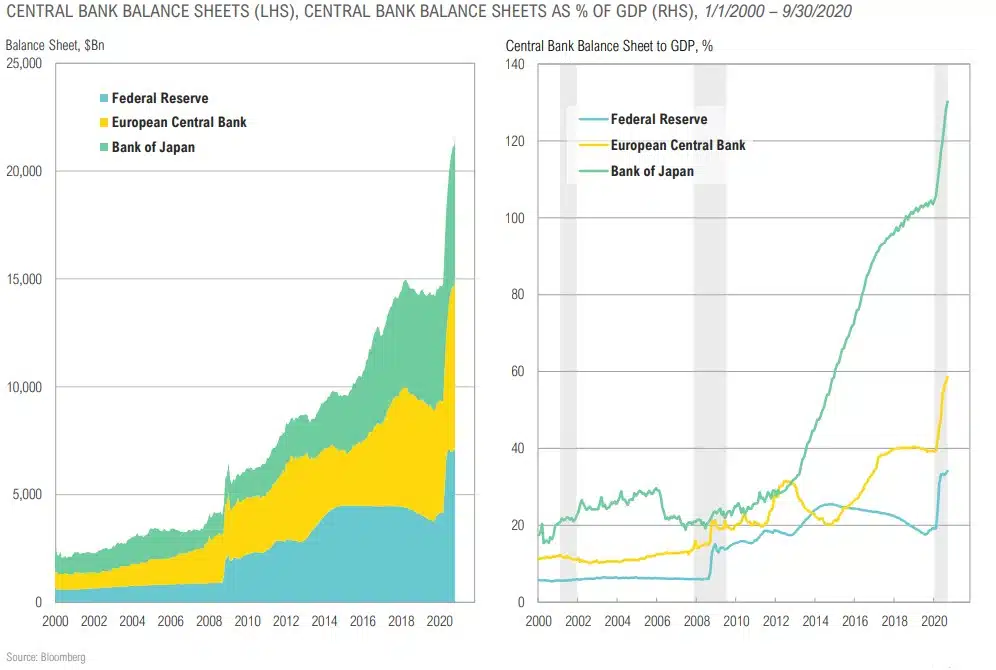
Fed Can Provide More Stimulus Relative to Other Central Banks
Feast in U.S. Large Cap, Famine in International & Small Cap
Feast in Growth, Famine in Value

Feast in Tech & Consumer Discretionary, Famine in Financials & Energy
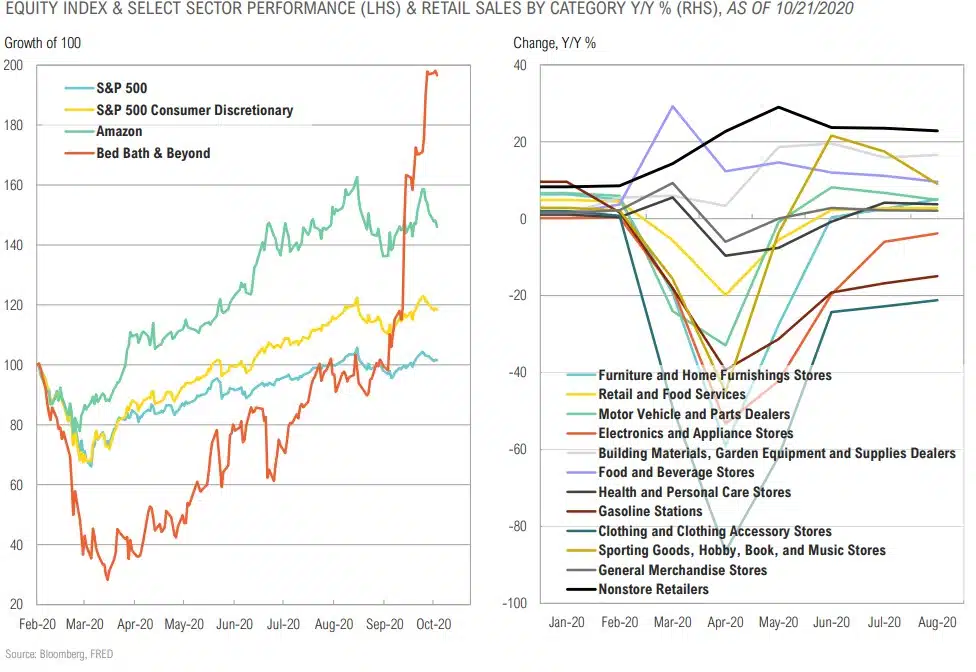
Feast in Online & Home, Famine in “Going Out”
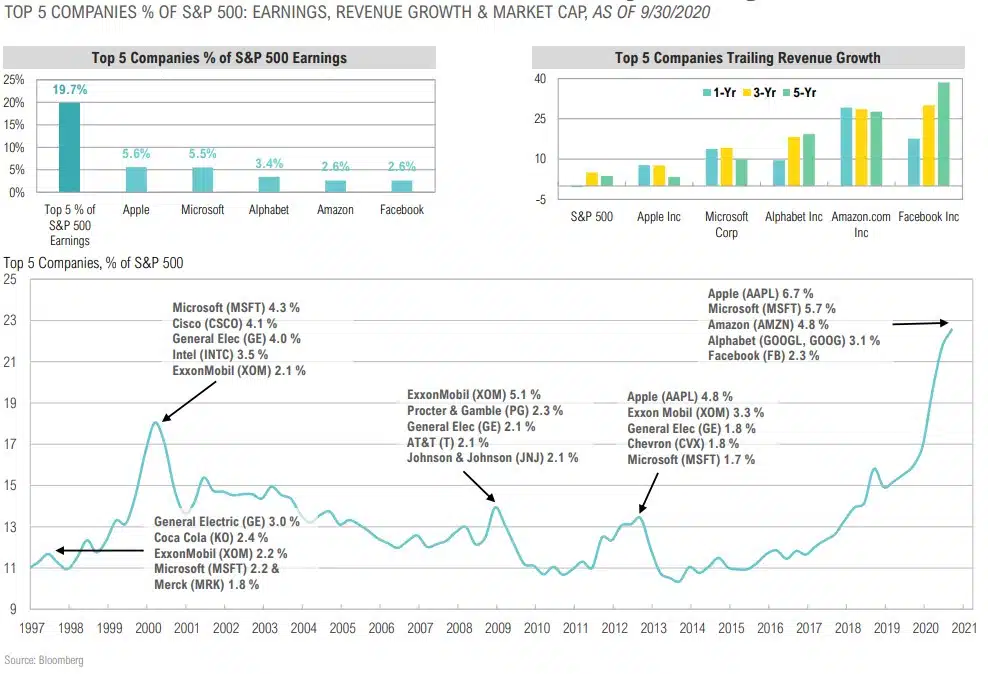
Winner Take All Markets are Still Justified by Earnings & Growth
Feast in Prices, Famine in Earnings
Wall Street vs. Main Street
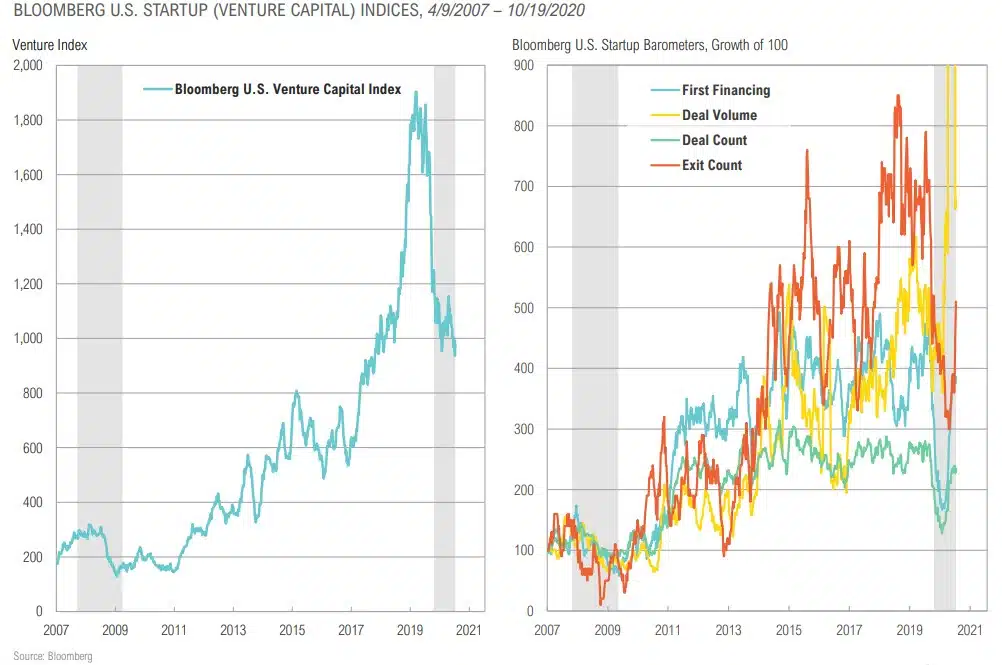
Venture Activity: Increased Exits, but Overall Stress
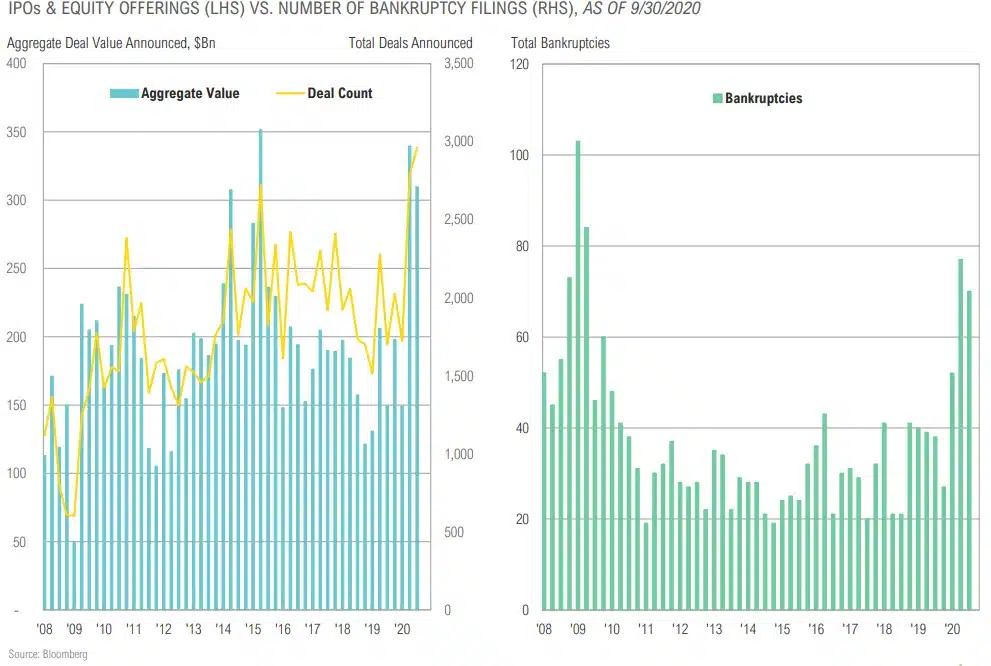
Feast in IPOS, Famine in Bankruptcies
Buyout & Venture Secondaries Should Get Interesting
FIXED INCOME & CREDIT
“Post-GFC experience shows that low interest rates don’t trickle down. They inflate financial assets primarily owned by the rich. The idea is to increase borrowing, but the last thing we need is more debt.”
– Sheila Bair, Former Chair of the FDIC, June 12, 2020
Fixed Income & Credit Returns
Fixed Income & Credit Summary
COMMENTARY & MARKET DATA
FIXED INCOME/ RATES
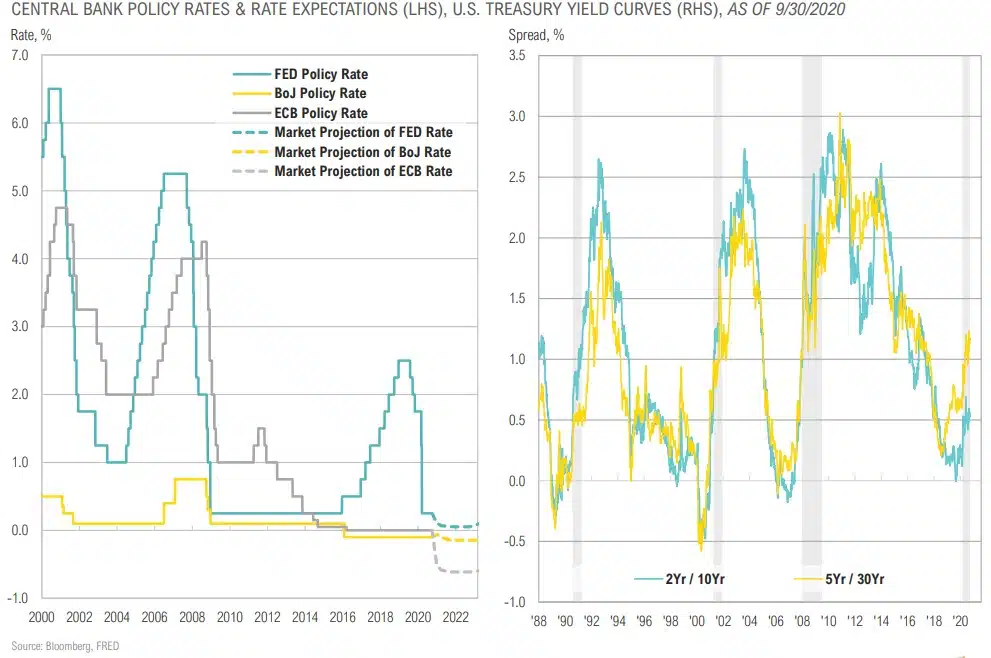
- Short-term rates will remain low for the foreseeable future.
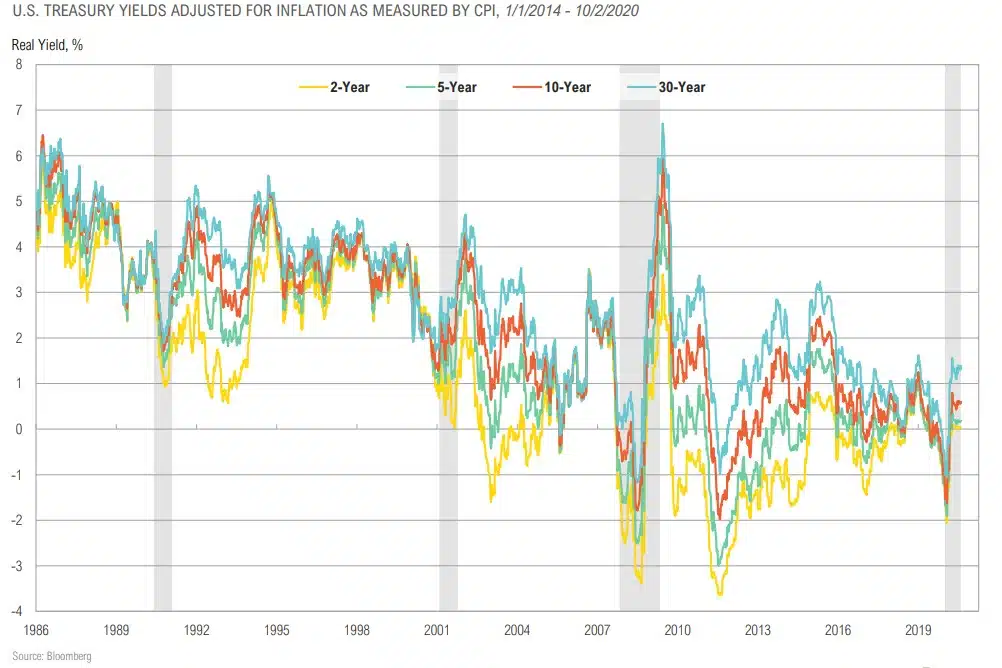
- The Fed’s new, somewhat opaque approach to generating inflation adds insult to injury for fixed income investors with low risk thresholds, substantially raising the risk of negative real yields.
- U.S. Treasury yields may rise as a result of liquidity injections, but a structural ceiling on developed market rates from demographics and debt overhang will likely not get overcome until persistent MMT-inspired stimulus via some form of ongoing Universal Basic Income (UBI).
CREDIT
- Over the quarter, high yield bond spreads narrowed by 94 basis points from 6.44% to 5.50% as the Fed continued to support the corporate credit markets through the purchase of bonds and bond ETFs. As of September 30, the Fed has purchased $8.6 billion of ETFs and $4.4 billion of direct bonds (just over 1% of what was authorized).
- Central Bank intervention has removed tail risks in investment grade bonds and some high yield bonds. While riskier segments of the market could continue to rally short-term, the risks for any sector that falls outside of government support remain substantial and require much lower clearing prices.
- Private credit remains attractive given higher rates of return and heightened economic volatility creating opportunity.
The Market is Pricing in Low Short-Term Rates for Several Years, but an Eventual Pickup in Growth/Inflation
No Free Lunch in Bonds: the Only Real Yield is Now in Long End
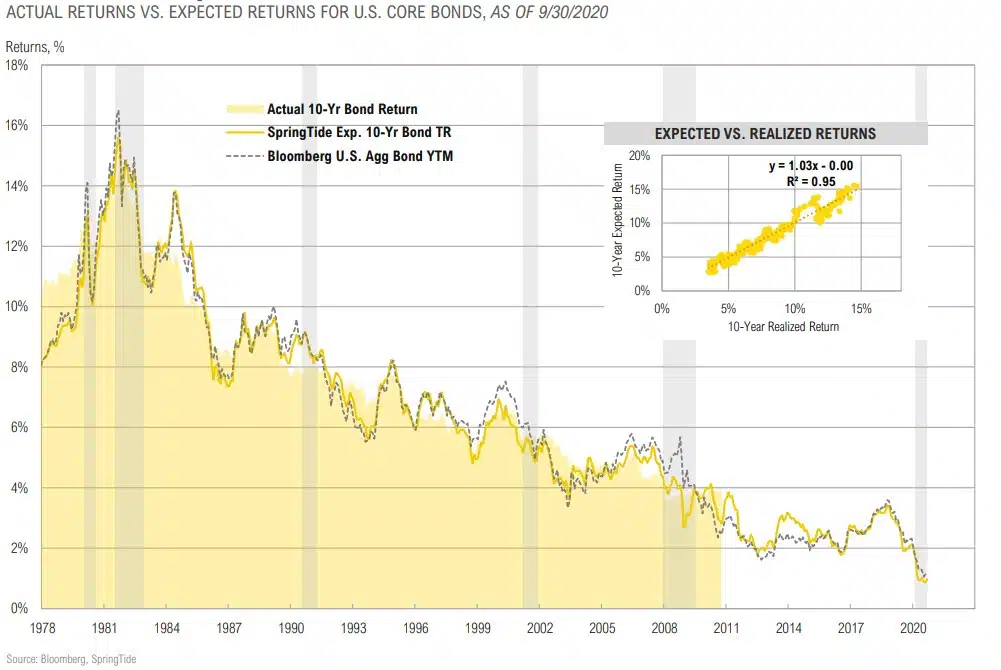
Core Bond Expected Returns ~1% for Next 10 Years
An Extra 1.5% in Credit Premium if the Fed Supports High Yield Bonds
Fed Purchases of Corporate Bonds
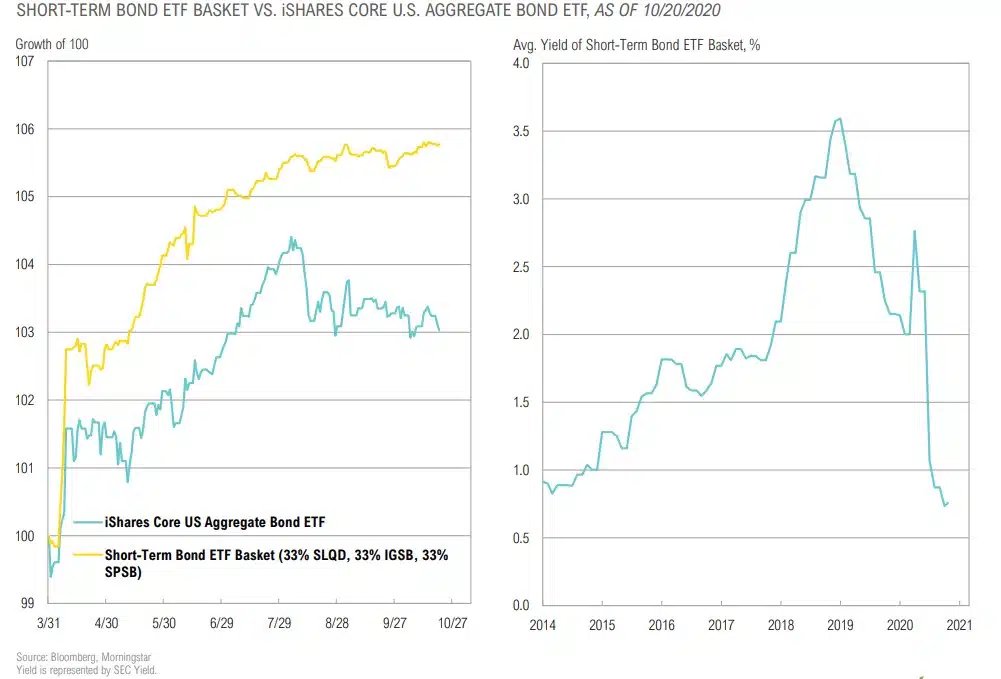
Short-Term Corporate Bond ETF Basket vs. U.S. Core Bonds
The Fed Will Likely Have to Increase Purchases To Keep Up with Issuance
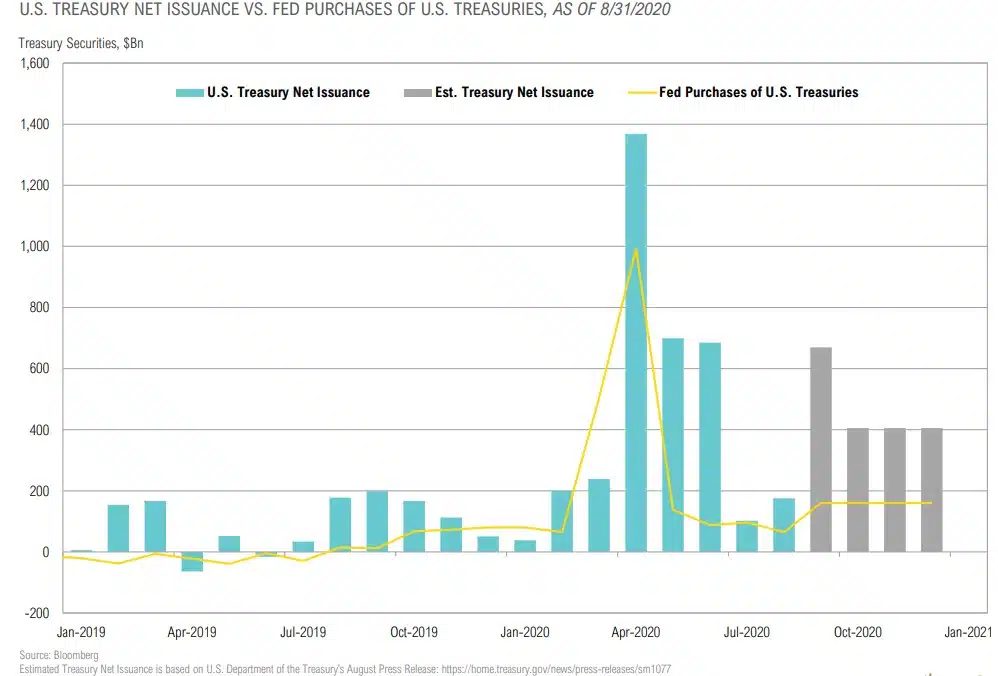
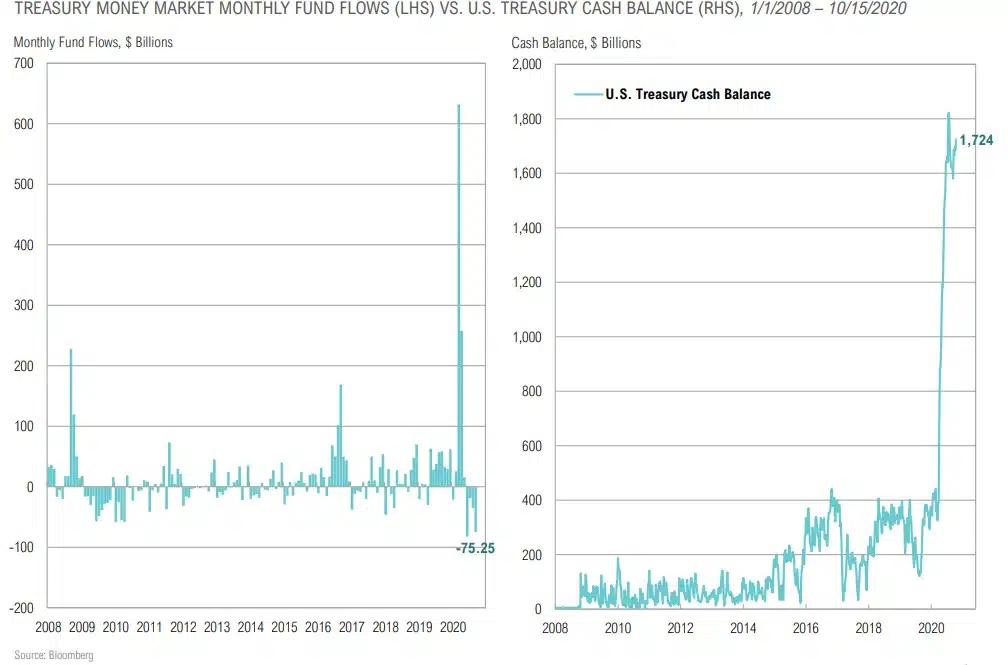
Buyers Have Enabled U.S. Treasury to Build Enormous Cash Reserve
REAL ASSETS
“We concluded then (2010) that gold does not have a role as a strategic asset class in clients’ already well-diversified portfolios. We have updated the research and the evidence is even more compelling today than it was then.”
– Goldman Sachs Investment Strategy, April 5, 2020
Real Asset Returns
Real Assets Summary
COMMENTARY & MARKET DATA
COMMODITIES
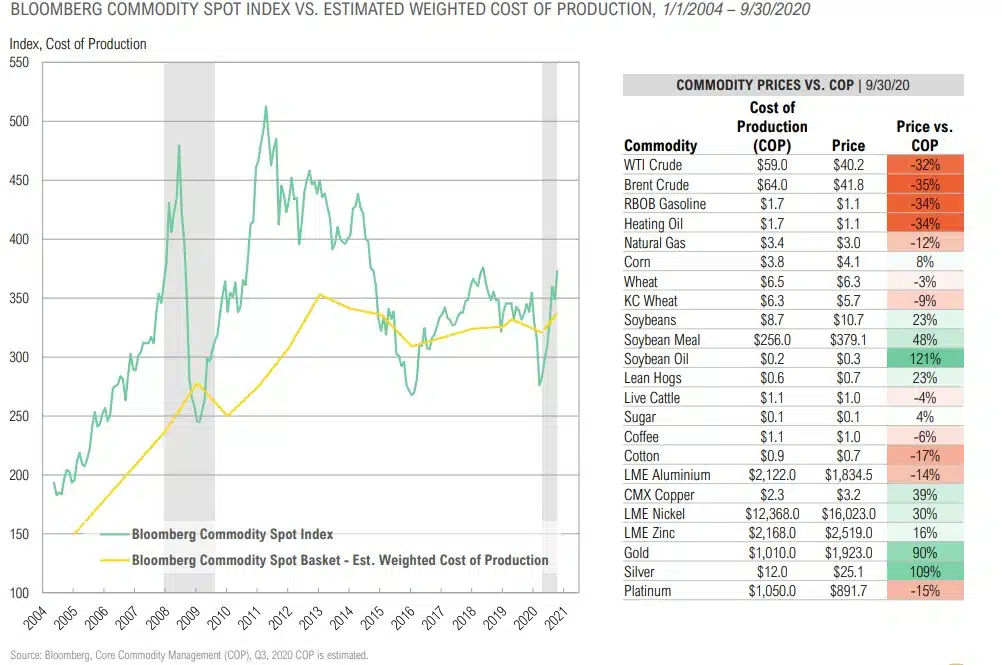
- Commodities are in a bottoming process as declining demand is being met with reduced supply. Coupled with a potential structural shift higher in inflation in the coming years, we are near (or at) an attractive entry point.
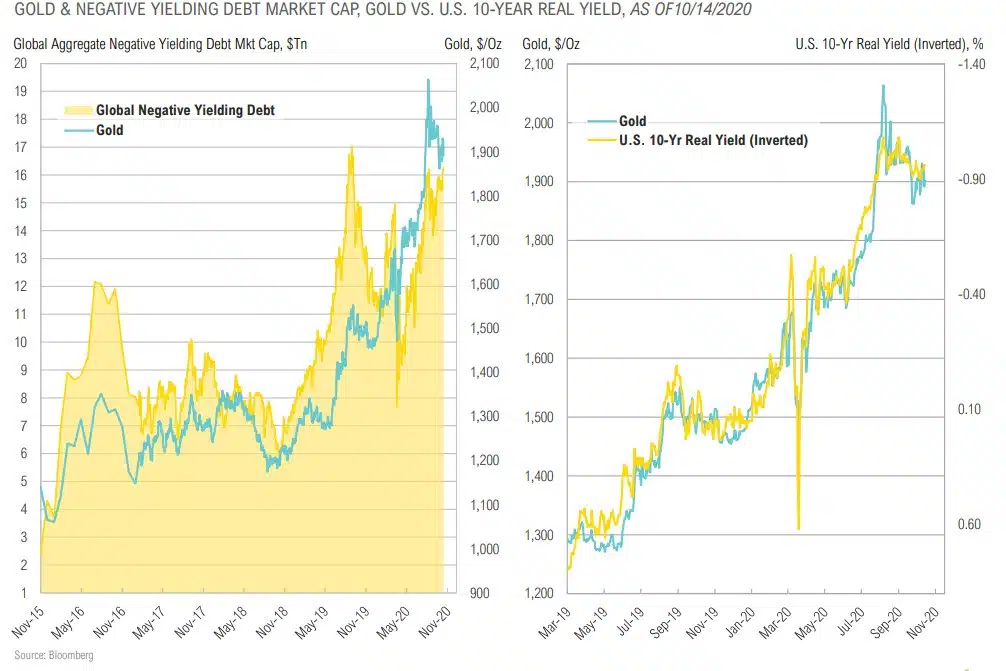
- Gold will continue to benefit if the pool of negative-yielding sovereign debt (>$16 trillion now) grows or fiscal spending/quantitative easing programs persist.
REAL ESTATE
- Private real estate portfolios were marked up fractionally in Q2, trailing public REITs, but with REITs still down 17.9% for the year-to-date through September, further write-downs – particularly in office and retail – should not be ruled out if the Covid-19 crisis drags on.
- Opportunities have emerged in public and private markets as some sectors (industrial, warehouse/ fulfillment) are booming and others are in deep distress (retail, entertainment, hospitality and office).
ENERGY & INFRASTRUCTURE
- The energy space remains oversupplied in the short-term, but reduced supply should force the market into balance in 2021.
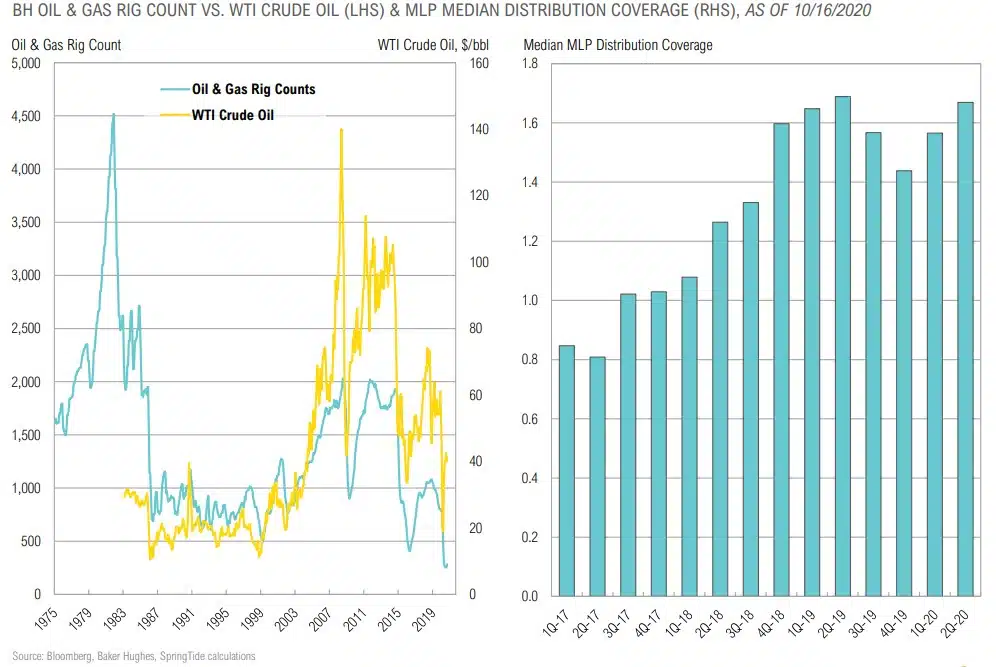
- After the purge, the midstream space should be able to return to its roots as the low-growth, higher return on asset business it was over a decade ago.
- On the oil supply side, per Baker Hughes, the U.S. rig count declined 68% (from 805 to 261) for the YTD through Sep.
Source: Bloomberg
Source: Bloomberg
Why Gold? Gold Viewed as an Alternative Safe Haven
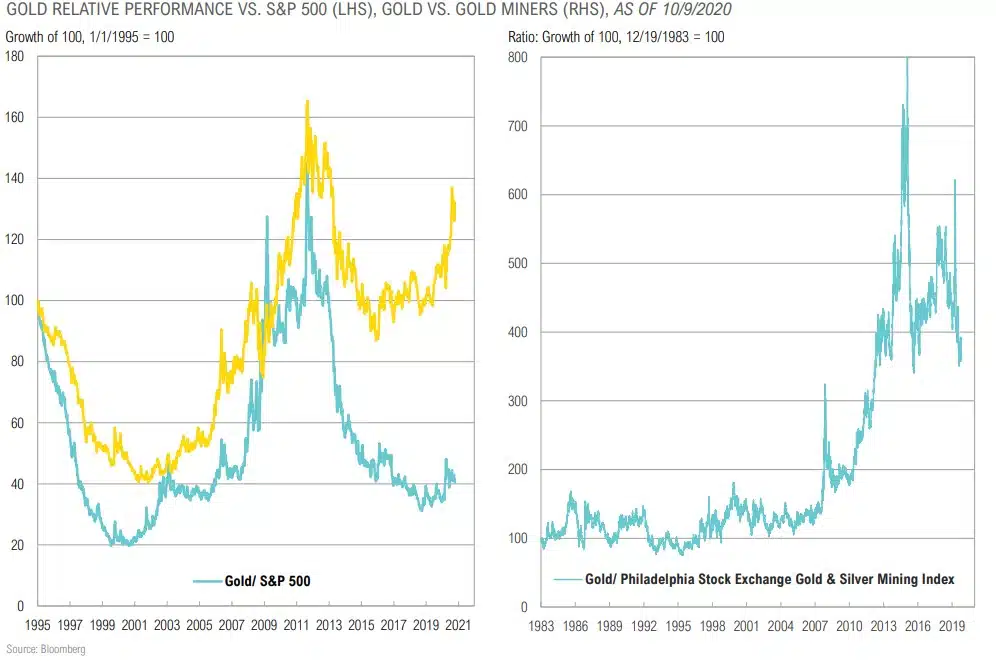
Gold has Room to Run vs. Core Stocks & Bonds…
& Miners Have Room to Run vs. Physical
Oil & Gas Decimated, Sector is Likely Bottoming
Commodities Above Marginal Cost of Production
OPPORTUNISTIC
“My sense is that economic anxiety means electoral volatility.”
– Tim Kaine, Lawyer and Politician
Opportunistic Strategy Returns
Opportunistic Strategies Summary
COMMENTARY & MARKET DATA
OPPORTUNITY SET IN CORE ASSET CLASSES
- The yield on a diversified portfolio of global stocks and U.S. bonds rose slightly to 1.72%, but it remains near all-time lows.
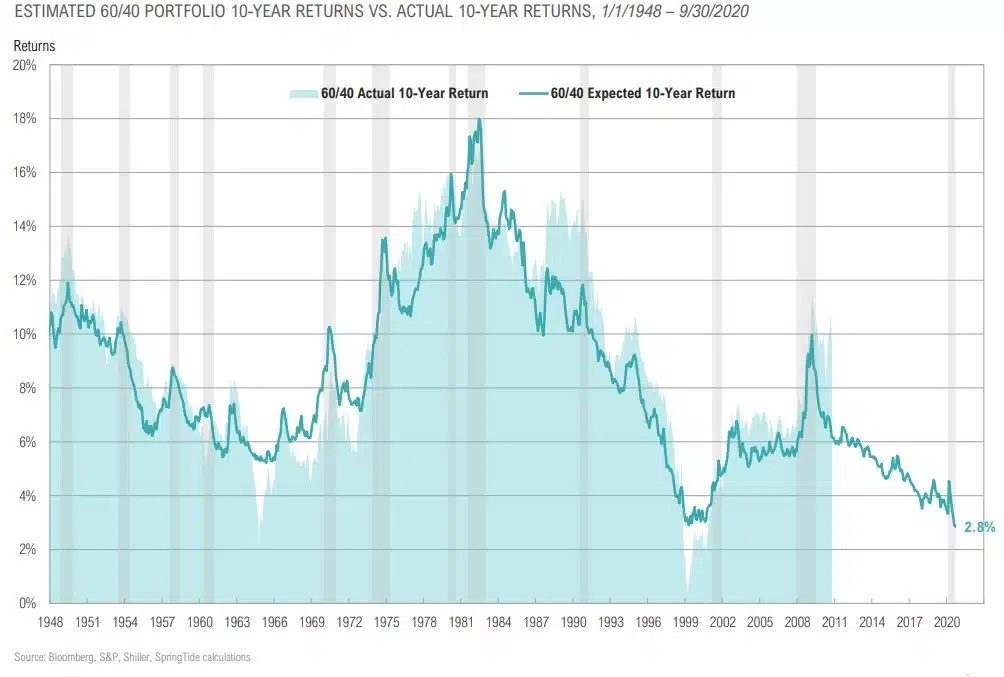
- Near record low hurdle rate/opportunity cost of U.S. core 60/40 portfolios (expected 10-year nominal returns of ~3%) and higher expected volatility
OPPORTUNISTIC STRATEGIES
- Multi-strategy hedge funds, as measured by the HFRI Fund Weighted Composite, were the top performing asset class in Opportunistic Strategies in Q3 (+7.4%).
- Despite low opportunity cost, high fees and declining manager alphas remain a large deterrent for most hedge fund allocations; however, the “riches are in the niches” – exceptional boutique managers have the potential to add value given increased volatility.
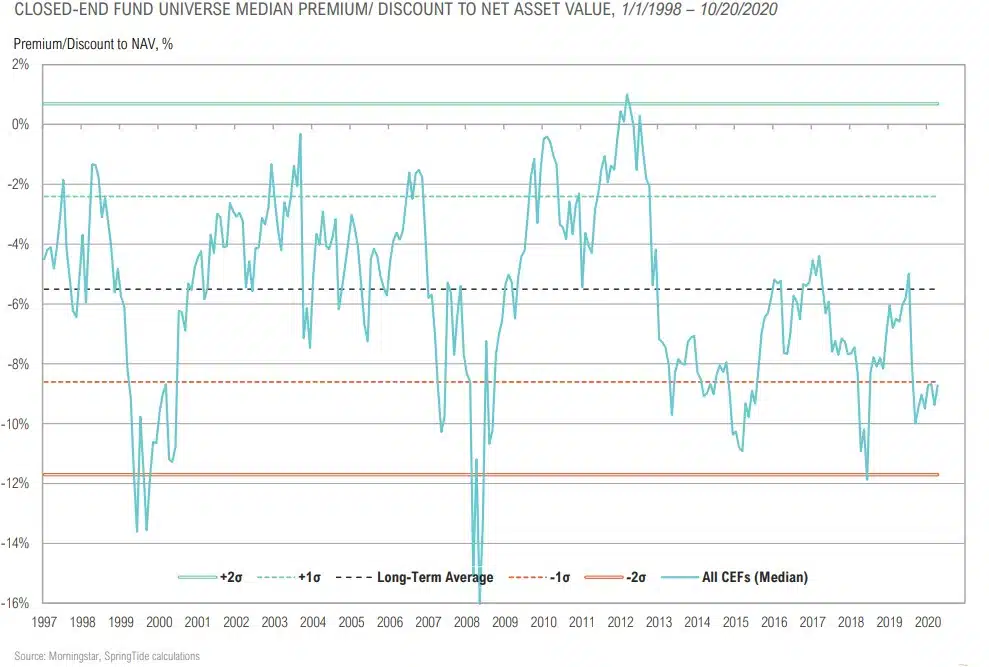
- Closed-end funds climbed higher (+4.2%), trimming year-to date losses to -7.0% for the asset class. Average discounts narrowed by less than 1% to -8.7%, significantly below the long-term average of -5.5% discounts.
- The closed-end funds space is attractive as discounts have widened to over 10% across almost all sectors.
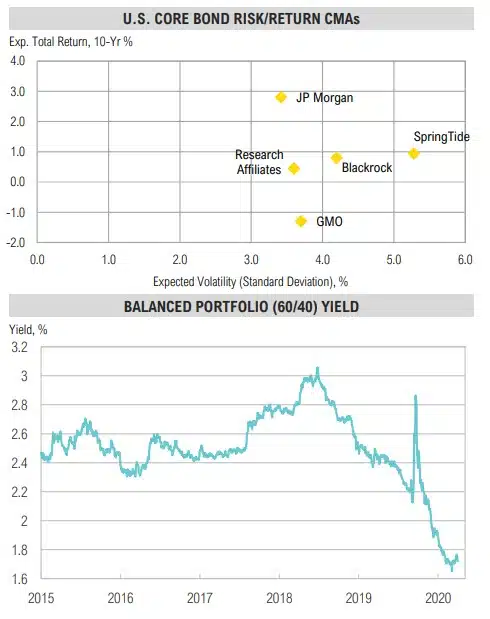
Expected Returns for a 60/40 Remain Low
Closed-End Fund Discounts Remain Attractive
Closed-End Fund Discounts Remain Attractive
ASSET ALLOCATION
“Over the last two centuries, the fraction of inflation’s long-run variation explained by long-run money growth has been very high, and relatively stable, in the United States, the United Kingdom and several other countries.”
– Luca Benati, European Central Bank, March 2009
Source: ECB working Paper No. 1027, March 2009: https://www.ecb.europa.eu/pub/pdf/scpwps/ecbwp1027.pdf
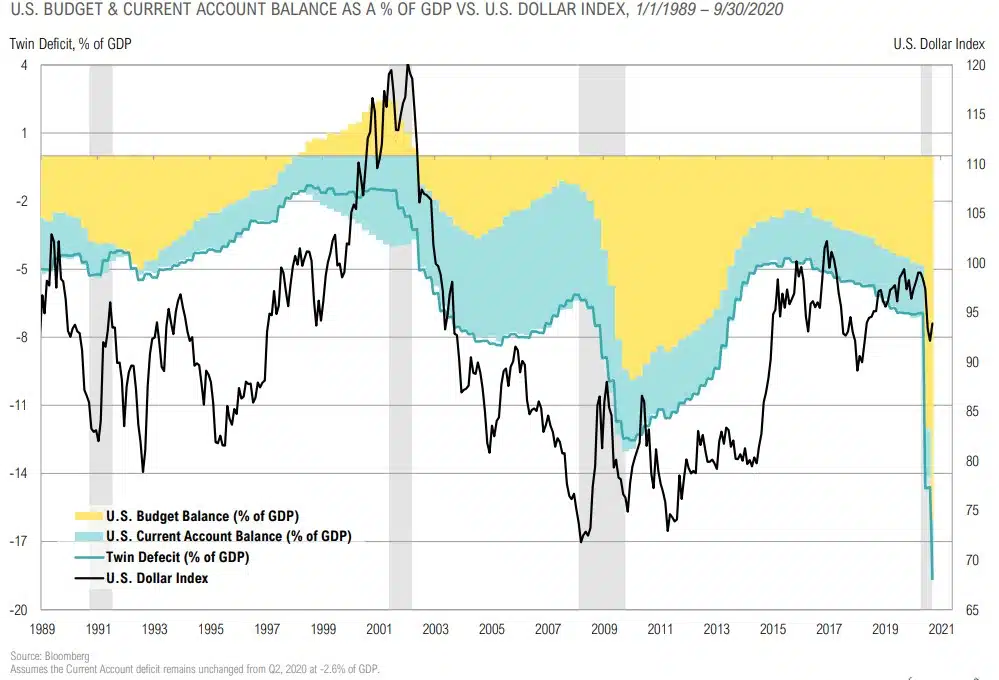
Growing Twin Deficit Will be a Major Headwind for the Dollar
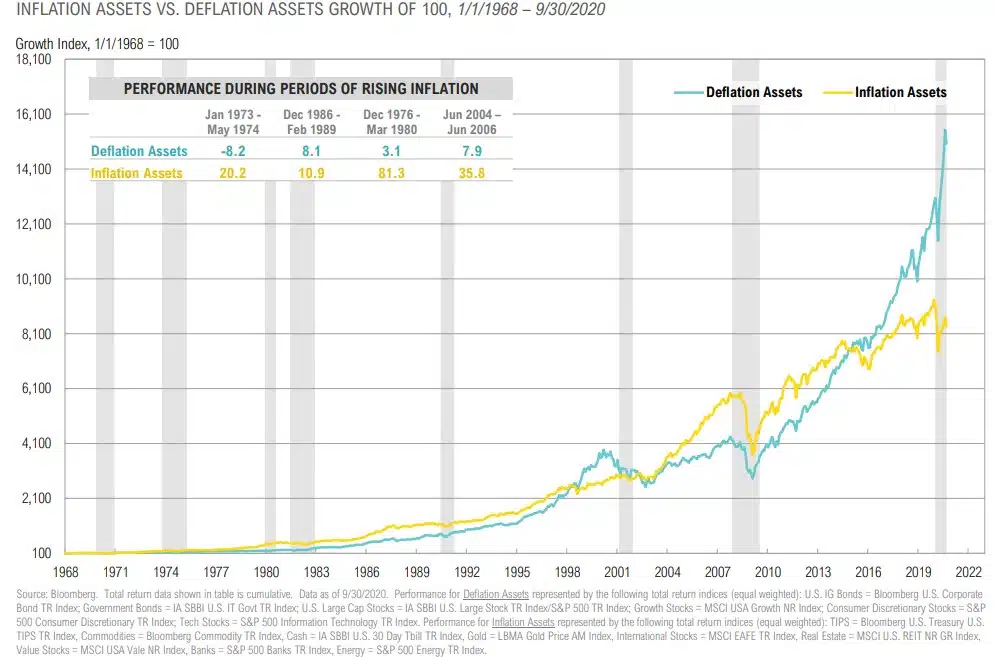
Time to Tilt from Deflation to Inflation Assets
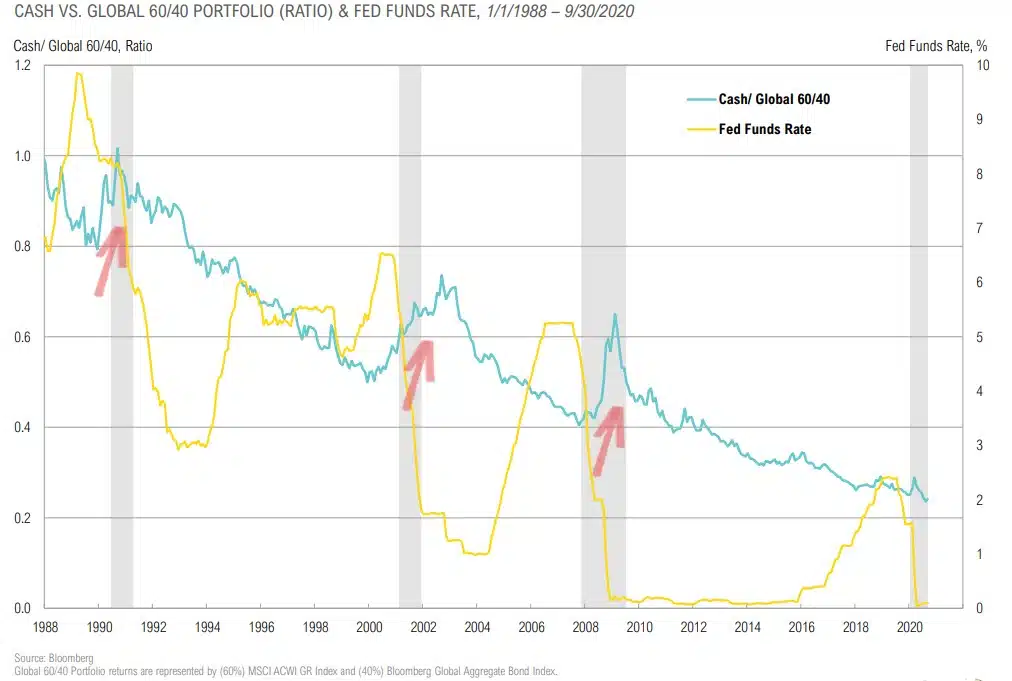
Cash Priced in Global 60/40
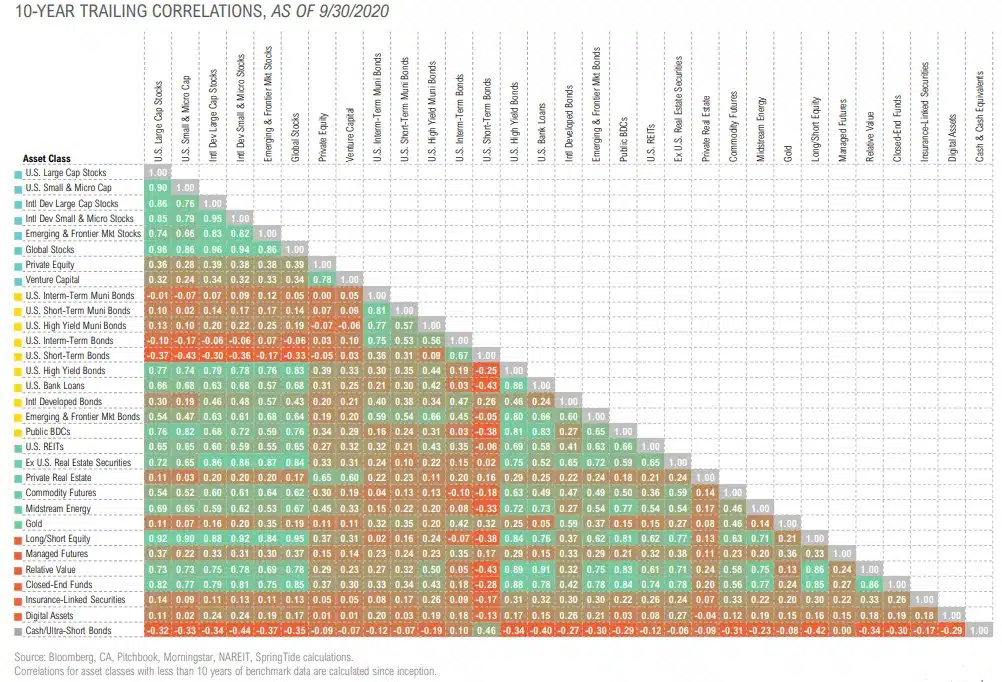
Asset Class Correlations