As tumultuous as the first quarter of 2020 was, the second quarter was almost a perfect mirror image. Many asset classes recovered to end the first half of the year at levels that show no signs of a bear market, let alone a global economic shutdown. For the quarter, the S&P 500 gained 21% while the tech-heavy NASDAQ increased 31%. This leaves the S&P 500 down 3% for the year while the NASDAQ is higher by 12%! High-yield bonds finished the quarter by gaining 10% and are down just 4% in 2020.
The past several months have echoed some of the most extreme periods in history, demonstrating parallels to the Great Depression, the tech bubble, and the great financial crisis (GFC) all at the same time. In some respects, the economic destruction from COVID-19 is worse than anything seen since the Great Depression. In early 1933, the unemployment rate peaked at 25%.1 That dark time in economic history was also known for its plunge in gross domestic product (GDP), which declined by 30%.2 Based on already released data, the Atlanta Fed GDP Now forecasts second-quarter GDP to be down 35%.3 In April, the unemployment rate was reported as 15%.4 However, in May, the Labor Department admitted that government household survey-takers mistakenly counted about 4.9 million temporarily laid-off people as employed, which—if accurately counted—would have pushed April’s true unemployment rate to 19%.4 The government does not correct its survey results for fear of the appearance of political manipulation, so the number was never officially changed. Nearly half of labor force participants are currently unemployed.4
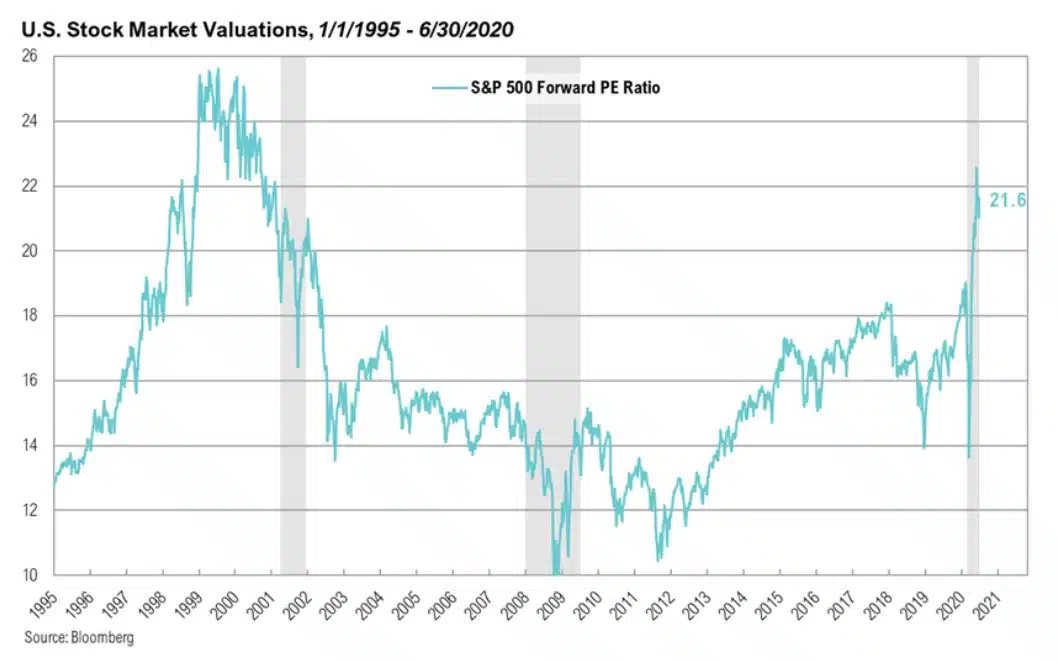
The enormous rally in stocks and massive downward revisions in corporate earnings, as a result of COVID-19, have created the tech bubble dynamic in the form of extremely high valuations. The one-year forward P/E ratio for the S&P 500 sits at nearly 22 times, which resembles the tech bubble when it was at approximately 26 times. Part of the reason for the significant rise in equity prices during the second quarter was the euphoria (and relief) of a partial re-opening of the economy. As the numerator (prices) in that equation rose substantially, the denominator (earnings expectations) plummeted. Consensus estimates for S&P 500 earnings per share (EPS) for 2020 were cut by over 28% from $174 on January 1 to $125 at the end of June.5 Forecasts for 2021 and 2022 EPS have also been cut by 17% and 10%, respectively.5

Market Commentary
Three in One
The past several months have echoed some of the most extreme periods in history, with parallels to the Great Depression, the tech bubble, and the great financial crisis (GFC) all at the same time.
The enormous rally in stocks and massive downward revisions in corporate earnings have created the tech bubble dynamic in the form of extremely high valuations.
Overview
As tumultuous as the first quarter of 2020 was, the second quarter was almost a perfect mirror image. Many asset classes recovered to end the first half of the year at levels that show no signs of a bear market, let alone a global economic shutdown. For the quarter, the S&P 500 gained 21% while the tech-heavy NASDAQ increased 31%. This leaves the S&P 500 down 3% for the year while the NASDAQ is higher by 12%! High-yield bonds finished the quarter by gaining 10% and are down just 4% in 2020.
The past several months have echoed some of the most extreme periods in history, demonstrating parallels to the Great Depression, the tech bubble, and the great financial crisis (GFC) all at the same time. In some respects, the economic destruction from COVID-19 is worse than anything seen since the Great Depression. In early 1933, the unemployment rate peaked at 25%.1 That dark time in economic history was also known for its plunge in gross domestic product (GDP), which declined by 30%.2 Based on already released data, the Atlanta Fed GDP Now forecasts second-quarter GDP to be down 35%.3 In April, the unemployment rate was reported as 15%.4 However, in May, the Labor Department admitted that government household survey-takers mistakenly counted about 4.9 million temporarily laid-off people as employed, which—if accurately counted—would have pushed April’s true unemployment rate to 19%.4 The government does not correct its survey results for fear of the appearance of political manipulation, so the number was never officially changed. Nearly half of labor force participants are currently unemployed.4
The enormous rally in stocks and massive downward revisions in corporate earnings, as a result of COVID-19, have created the tech bubble dynamic in the form of extremely high valuations. The one-year forward P/E ratio for the S&P 500 sits at nearly 22 times, which resembles the tech bubble when it was at approximately 26 times. Part of the reason for the significant rise in equity prices during the second quarter was the euphoria (and relief) of a partial re-opening of the economy. As the numerator (prices) in that equation rose substantially, the denominator (earnings expectations) plummeted. Consensus estimates for S&P 500 earnings per share (EPS) for 2020 were cut by over 28% from $174 on January 1 to $125 at the end of June.5 Forecasts for 2021 and 2022 EPS have also been cut by 17% and 10%, respectively.5
“We crossed a lot of red lines, that had not been crossed before, this is that situation in which you do that, and you figure it out afterward.” ꟷFederal Reserve Chairman, Jerome Powell
The Federal Reserve is in many ways propping up today’s market environment. Although its actions are similar to its GFC response, it has been much more decisive, aggressive, and controversial during this crisis. Its monetary policy decisions include the same zero interest rates, a resurgence of programs like the Term Asset-Backed Securities Lending Fund (TALF), and an increase in quantitative easing. According to Chairman Jerome Powell, “We crossed a lot of red lines, that had not been crossed before, this is that situation in which you do that, and you figure it out afterward.” Presumably, this is meant to acknowledge that new programs, such as the Secondary Market Corporate Credit Facility, in which the Fed has purchased billions of dollars of fixed income exchange traded funds (including funds that hold high yield bonds), are outside of policy orthodoxy—and even possibly the Fed’s legal authority.6 Powell could also be referring to another aspect of the program whereby the Fed purchases the bonds of corporations such as Apple, Toyota, and Walmart.6 It took the Fed nearly a decade since the GFC to increase its balance sheet by $3 trillion,7 but just three months to match that feat during this crisis. The Fed has also been much more aggressive in its quantitative easing program in which it has purchased as much as $125 billion of securities per day, significantly more than it did during the GFC.7
Nearly $900 billion of corporate debt was issued in Q2, bringing the year-to-date total to $1.4 trillion—double the amount this time last year.
Along with zero interest rates, the Fed is hoping that these tools will be an effective economic vaccine to the turmoil brought on by the coronavirus. Former FDIC Chair Sheila Bair, who was at the helm during the GFC, claimed the Fed’s attempts were futile: “PostGFC experience shows that low interest rates don’t trickle down. They inflate financial assets primarily owned by the rich. The idea is to increase borrowing, but the last thing we need is more debt.” 19 So far, the Fed has indeed successfully bolstered asset prices, as well as incentivized an explosion in new corporate debt. During the quarter, nearly $900 billion of corporate debt was issued, bringing the year-to-date total to $1.4 trillion—double the amount this time last year.8
In addition to the support from the Fed, the market has also been buoyed by optimism about the labor markets. Initial jobless claims have been on a steady = trajectory lower from nearly 7 million in early April to an end of June reading at just over 1.4 million.9 Continuing jobless claims have also moved lower off all-time highs, dropping from nearly 25 million to 19 million at the end of June.9 The partial economic re-opening has allowed roughly one third of workers to find jobs as unemployment improved from 15% to 11%.4
Absent effective therapeutics to address the virus, additional fiscal and monetary support will likely be needed in the second half of the year.
Unfortunately, absent a vaccine or effective therapeutics to address the virus, additional fiscal and monetary support will likely be needed in the second half of the year. A recent study by Austan Goolsbee and Chad Syverson of the Becker Friedman Institute for Economics at the University of Chicago addressed the question of how much of the economic collapse resulted from government-imposed restrictions versus people voluntarily choosing to stay home to avoid infection.10 Using cellular phone data from SafeGraph, which collects information on almost 45 million cellular phone users (or about 10% of devices in the U.S.), they estimated overall consumer foot traffic fell by 60%—only 7% of that reduction due to legal restrictions. This appears to continue to be the case. According to SafeGraph, in states where positive cases are on the rise—such as Florida, Texas, Arizona, and California—foot traffic remains at depressed levels or has deteriorated into July.11 Other data point to a similar lull in activity. According to TSA travel checkpoints, the number of airplane passengers in the last seven days of the quarter averaged just 579,000—or down 77% from the same period last year.12 OpenTable data revealed that reservations at sit-in restaurants declined over the past few weeks and are down more than 60% when compared to last year.13 This all comes = at a time when new COVID-19 cases are exceeding 50,000 per day in the U.S.14
The Treasury market appears willing to tolerate trillion-dollar relief plans, as well as the Federal Reserve’s decision to monetize a large percentage of new debt.
On the bright side, the Treasury market appears willing to tolerate trillion dollar relief plans, as well as the Federal Reserve’s decision to monetize a large percentage of new debt. As a result, yields and inflation remain low, and the dollar is relatively stable—for now, at least. The U.S. Treasury issued an astounding net $2.683 trillion of debt in the second quarter.15 And while the Federal Reserve bought $868 billion7 through its quantitative easing program over the same time period, the 10-year Treasury yield was stable, moving lower by 4 basis points to end the quarter at 66 basis points. As long as bond markets remain so accommodating, low yields could pave the way for a massive infrastructure spending bill within the next six months as pressure builds on policymakers to help millions of out-of-work people find new careers.
Both technology and energy stocks were up 31% for the quarter, although the experiences of the two sectors in the first half of 2020 were decidedly different.
Defaults are on the rise, as companies such as Hertz, Cirque du Soleil, 24 Hour Fitness, and Chuck E Cheese declare bankruptcy. Secondquarter defaults totaled $23 billion, the most since 2009.
Markets
In the U.S. equity market, the consumer discretionary sector generated the best return during the quarter, up 33%. Both technology and energy stocks were up 31% for the quarter, although the experiences of the two sectors in the first half of 2020 were decidedly different. Overall, technology was up 15%, while energy was down 35% for the year. The technology sector has largely benefited from the transition to “virtual” work and socializing, combined with healthier balance sheets and less exposure to the hardest hit parts of the economy. Energy benefited from a rebound in oil prices after West Texas Intermediate (WTI) oil prices declined to a value of negative $37/barrel in late April. Since then, oil prices have risen steadily and spent much of the second quarter above $25, closing out the quarter at nearly $40/barrel. Support to prices is coming from a rebound in demand and a drop in supply. U.S. oil production is down 16% from the all-time peak in production in March, and the active oil rig count, tabulated by Baker Hughes, is down over 70% on a year-over-year basis.16,17
Equities outside the U.S. were up substantially during the quarter but have lagged behind the U.S. over the past three months and year to date
Within fixed income, riskier credits outperformed safer ones. U.S. Intermediate-Term Bonds were up nearly 3% during the quarter and up just over 6% for the year. U.S. Intermediate-Term Municipal Bonds were higher by 2.7%, pushing the year-to-date return to 2%. Bank loans also recovered some value, but they remain down for the year. This is a segment to monitor for risks, as well as new opportunities. Not surprisingly, defaults are on the rise, as companies such as Hertz, Cirque du Soleil, 24 Hour Fitness, and Chuck E Cheese declare bankruptcy. Second-quarter defaults totaled $23 billion, the most since 2009.18 To put that into context, in 2009 there were approximately $55 billion in total defaults.18 The bank loan asset class gained nearly 10% for the quarter, but remains lower by almost 5% for the year.
Equities outside the U.S. were also up substantially during the quarter but have lagged behind the U.S. over the past three months and year to date. In U.S. dollar terms, developed markets, as measured by MSCI EAFE Index, rallied 15%, leaving them down 11% so far in 2020. Similarly, the MSCI Emerging Markets Index gained 18% for the quarter and is now down 10% for the year. In local currency terms, the MSCI EAFE Index was higher by 13% for the quarter and now down 10% for the year, while the MSCI Emerging Markets Index experienced a local currency return of up 17% and down 5% for the quarter and year, respectively.
The European Central Bank (ECB) settled a dispute with the German courts over the legality of their bond-buying program.
The heightened tensions between China and the western world were punctuated by news that social media giants would no longer provide user data at the request of the Hong Kong government.
In Europe, the European Central Bank (ECB) settled a dispute with the German courts over the legality of their bond-buying program. In May, the German constitutional court threatened to prevent Germany’s central bank, Bundesbank, from participating if the ECB failed to show that its government bond purchases were proportionate. European equities were up nearly 16% for the quarter, but remain lower by 12% for the year.
The heightened tensions between China and the western world were punctuated by news that social media giants such as Facebook, Twitter, and WhatsApp would no longer provide user data at the request of the Hong Kong government. This is in response to the controversial Beijing national security rule imposed upon Hong Kong. The companies have said they will ignore requests until the implications of the new law are better understood. Chinese stocks finished the second quarter up 15%, leaving them up 4% for the year. In Hong Kong, equities were higher by 9%, leaving them down 10% for the first half of 2020.
The virus has not gone away or even slowed its spread in the U.S. And we are now approaching a U.S. election that will have a direct bearing on the size and shape of future policy initiatives.
Looking Forward
Describing the current market environment as unprecedented is not hyperbole. With trillions of stimulus dollars already distributed and the Federal Reserve spending trillions more to buy assets, policy makers have collectively pushed asset prices back to preCOVID levels. Yet the virus has not gone away or even slowed its spread in the U.S. And, as if this range of outcomes was not wide enough, we are now approaching a U.S. election that will have a direct bearing on the size and shape of future policy initiatives. We believe the recovery in asset prices, however justified, provides a good opportunity for investors to re-evaluate risks in portfolios, which we believe are now tilted to the downside for risky assets.
We want to close by expressing our gratitude to the many workers who do not have the luxury to work remotely and have to risk their health and safety in order to provide the services that keep our society functioning.
Performance Disclosures
All market pricing and performance data from Bloomberg, unless otherwise cited. Asset class and sector performance are gross of fees unless otherwise indicated.
Citations
SpringTide calculations
SpingTide calculations
Share it :
Disclaimer
Magnus Financial Group LLC (“Magnus”) did not produce and bears no responsibility for any part of this report whatsoever, including but not limited to any microeconomic views, inaccuracies or any errors or omissions. Research and data used in the presentation have come from third-party sources that Magnus has not independently verified presentation and the opinions expressed are not by Magnus or its employees and are current only as of the time made and are subject to change without notice.
This report may include estimates, projections or other forward-looking statements, however, due to numerous factors, actual events may differ substantially from those presented. The graphs and tables making up this report have been based on unaudited, third-party data and performance information provided to us by one or more commercial databases. Except for the historical information contained in this report, certain matters are forward looking statements or projections that are dependent upon risks and uncertainties, including but not limited to factors and considerations such as general market volatility, global economic risk, geopolitical risk, currency risk and other country-specific factors, fiscal and monetary policy, the level of interest rates, security-specific risks, and historical market segment or sector performance relationships as they relate to the business and economic cycle.
Additionally, please be aware that past performance is not a guide to the future performance of any manager or strategy, and that the performance results and historical information provided displayed herein may have been adversely or favorably impacted by events and economic conditions that will not prevail in the future. Therefore, it should not be inferred that these results are indicative of the future performance of any strategy, index, fund, manager or group of managers. Index benchmarks contained in this report are provided so that performance can be compared with the performance of well-known and widely recognized indices. Index results assume the re-investment of all dividends and interest and do not reflect any management fees, transaction costs or expenses.
The information provided is not intended to be, and should not be construed as, investment, legal or tax advice nor should such information contained herein be construed as a recommendation or advice to purchase or sell any security, investment, or portfolio allocation. An investor should consult with their financial advisor to determine the appropriate investment strategies and investment vehicles. Investment decisions should be made based on the investor’s specific financial needs and objectives, goals, time horizon and risk tolerance. This presentation makes no implied or express recommendations concerning the way any client’s accounts should or would be handled, as appropriate investment decisions depend upon the client’s specific investment objectives.
Investment advisory services offered through Magnus; securities offered through third party custodial relationships. More information about Magnus can be found on its Form ADV at www.adviserinfo.sec.gov.
Terms of Use
Definitions
Asset class performance was measured using the following benchmarks: U.S. Large Cap Stocks: S&P 500 TR Index; U.S. Small & Micro Cap: Russell 2000 TR Index; Intl Dev Large Cap Stocks: MSCI EAFE GR Index; Emerging & Frontier Market Stocks: MSCI Emerging Markets GR Index; U.S. Intermediate-Term Muni Bonds: Bloomberg Barclays 1-10 (1-12 Yr) Muni Bond TR Index; U.S. Intermediate-Term Bonds: Bloomberg Barclays U.S. Aggregate Bond TR Index; U.S. High Yield Bonds: Bloomberg Barclays U.S. Corporate High Yield TR Index; U.S. Bank Loans: S&P/LSTA U.S. Leveraged Loan Index; Intl Developed Bonds: Bloomberg Barclays Global Aggregate ex-U.S. Index; Emerging & Frontier Market Bonds: JPMorgan EMBI Global Diversified TR Index; U.S. REITs: MSCI U.S. REIT GR Index, Ex U.S. Real Estate Securities: S&P Global Ex-U.S. Property TR Index; Commodity Futures: Bloomberg Commodity TR Index; Midstream Energy: Alerian MLP TR Index; Gold: LBMA Gold Price, U.S. 60/40: 60% S&P 500 TR Index; 40% Bloomberg Barclays U.S. Aggregate Bond TR Index; Global 60/40: 60% MSCI ACWI GR Index; 40% Bloomberg Barclays Global Aggregate Bond TR Index.