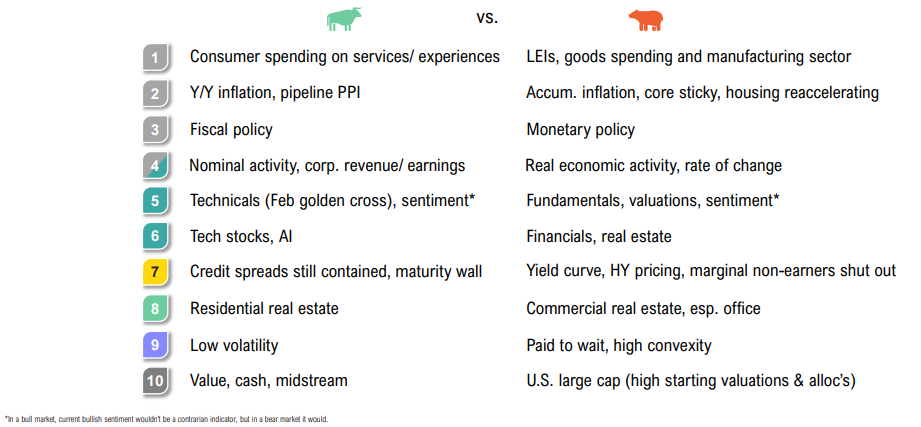
The Running of the Bulls (and Bears)
The top of my mind is just how uncertain trying to analyze the environment is going forward. I’ve been doing this for 45 years, but I’ve never had a situation where you had free money for 11 years, a very broad asset bubble, followed by jacking up rates 500bps in 12 months.
Stanley Druckenmiller, American Investor

Summary
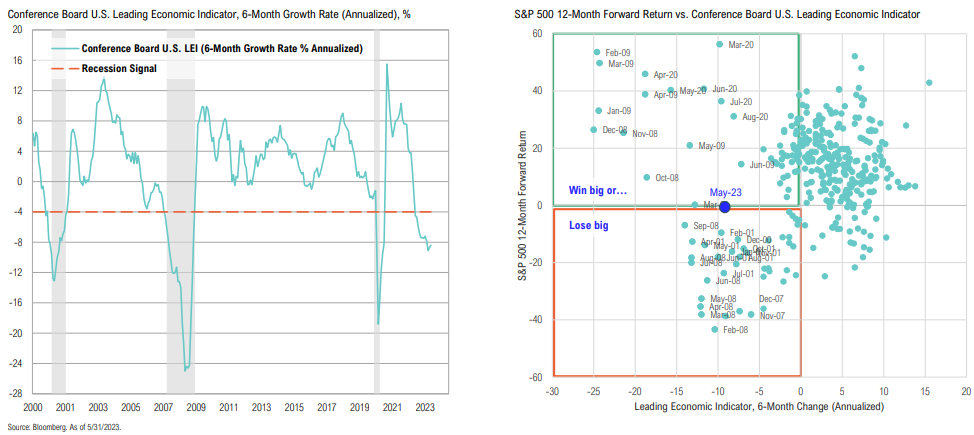
Conflicting signals from the economy and markets in the context of high equity valuations have historically led to “win big or lose big” outcomes for investors
2Q, 2023 Market Review
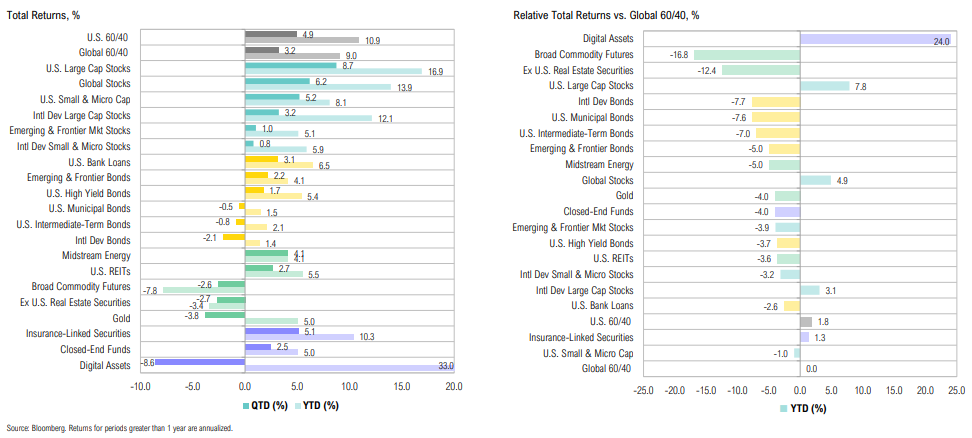
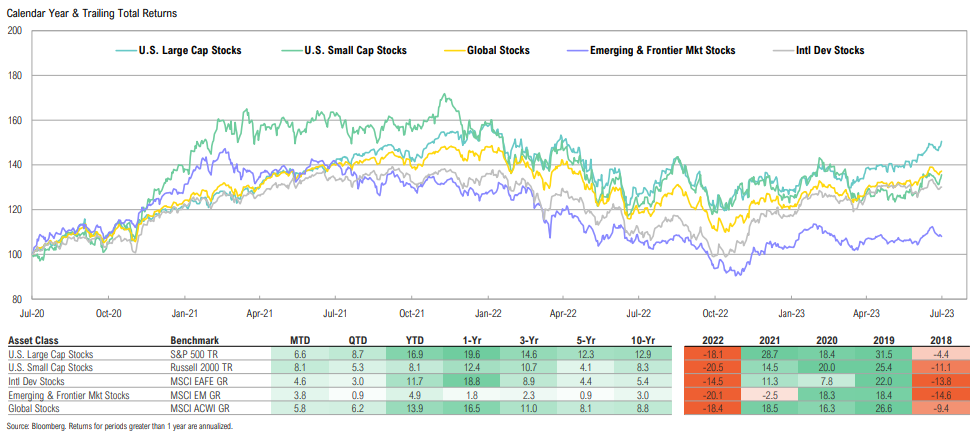
Major winners over the quarter included U.S. large and small cap stocks, while gold, ex-U.S. real estate and broad commodity futures lagged
Key themes for 2023
Structurally lower real growth – Stop-start inflation, high debt levels, poor demographics and deficits will continue to impede growth in the developed world (U.S., Europe, and Japan). In the U.S., the aggressive pace of rate hikes, shape of the yield curve, and lending trends (exacerbated by recent banking stresses) suggest an average recession later in 2023 is a reasonable base case, but the outlook could be better or worse. Consensus = soft-landing (68% BofA survey). AI productivity gains should add marginally to aggregate corporate profitability and likely also GDP in coming years.
Stop-start, but broadly tighter, policy – Structurally higher, but volatile, inflation underpinned by constrained labor, housing and commodity markets; increased volatility due to stop-and-start policy; markets may be caught between a timid Fed fearful of a 1970s “Burns error” and contradictory, supportive fiscal stimulus given the political climate.
Tick tock for consumer – Poor real income growth (flat since Dec-19), a rapidly increasing cost of a growing debt pile, and resumption of student debt payments leading to U.S. consumer exhausting COVID stimulus sometime this fall. As it stands, it is not clear what can replace this dwindling spending power.
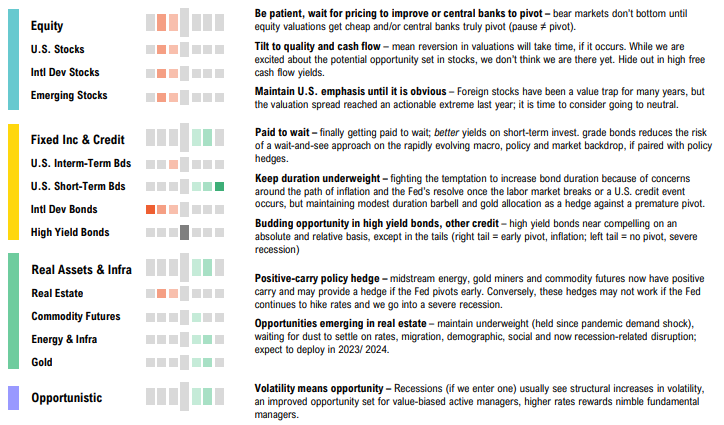
Stay patient and careful – Aggressive hiking cycles almost always cause recessions; the stock market has never bottomed ahead of official start of recession & recession is unlikely to start until labor market cracks; further, markets don’t usually bottom until equity valuations get cheap and/or central banks pivot (pause ≠ pivot);. This time may be different because of consumer balance sheets, AI, or something else, but the macro backdrop is challenging enough and equity valuations high enough to err on the side of caution, in our view.
Tilt to quality and cash flow – The key lesson from prior bubble unwinds is patience. The rally since October has seen extreme pessimism be replaced with borderline extreme bullish sentiment and complacency; absolute and relative valuations for headline U.S. equity benchmarks are high by any standards. We prefer to “hide out” in areas with strong balance sheets and higher cash flow yields in order to be in a position to take advantage of better prices if we get them.
Moving to neutral for U.S./non-U.S. – Foreign stocks have been a value trap for many years, while valuations remain modestly cheaper than the U.S., they are far from the actionable extreme seen at the 2022 lows. The same concept applies for U.S. small cap, where 40% of the Russell 2000 constituents have negative EPS.
Paid to wait – Investors are finally getting paid to wait; better yields on short-term investment-grade bonds reduce the risk of a wait-and-see approach to the rapidly evolving macro, policy and market backdrop, if paired with policy hedges that protect against policymakers underestimating inflation.
Keep duration low – We continue to fight the “temptation” to increase duration because of (a) concerns around the path of inflation, (b) the Fed’s resolve once labor market breaks or we have another credit/financial stability event. However, we are maintaining a modest duration barbell and a gold allocation as a hedge against premature easing.
Budding opportunity in high yield bonds, other credit – High-yield bonds got close to a compelling level on an absolute and relative basis last year, except in the tails (right tail = early pivot, inflation; left tail = no pivot, severe recession).
Positive-carry policy hedge – Midstream energy, gold miners and commodity futures now have positive yields (carry) and may provide a hedge if the Fed eases before justified by the data. Conversely, these hedges may underperform in a severe recession.
Opportunities emerging in real estate – maintain underweight (held since pandemic demand shock), waiting for dust to settle on higher rates, migration, demographic, social, and now recession-related disruption; expect to deploy in late 2023/early 2024.
Volatility = opportunity – Recessions result in structural increases in volatility, leading to an improved opportunity set for value-biased active managers, higher cost of capital rewards nimble fundamental managers.
Opportunity for dynamic asset allocation and active management – We remain extremely excited about the prospects for active management in the years ahead. A period of stop-and-start growth, inflation, policy and trends in asset markets should benefit value-biased dynamic asset allocation over static asset allocations.
Asset Allocation Views
Remain diversified, but tilted towards higher known cash flows (value equities, lower duration bonds)
I don’t see us getting back to 2% this year or next year. I see us getting there the year after.
Jerome Powell, Federal Reserve Chair
Growth, Inflation & Policy
Manufacturing & Inventories
Economic activity in the manufacturing sector has contracted for an 8th consecutive month, but it may be bottoming, albeit at a very depressed level
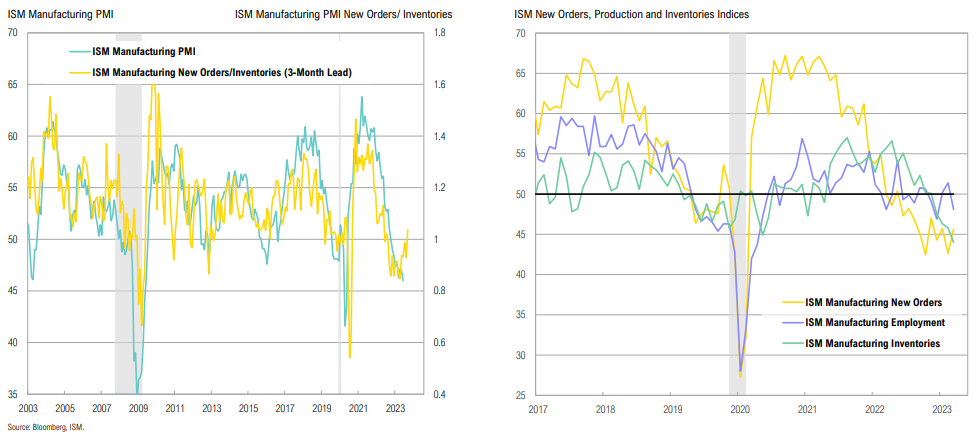
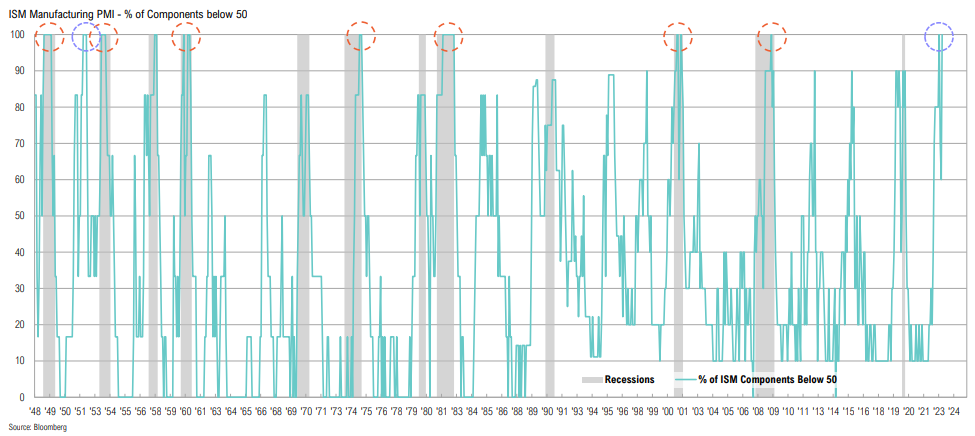
Every ISM Manufacturing PMI component registered below 50 in June: the only other time this happened and the U.S. was not in a recession was in 1952
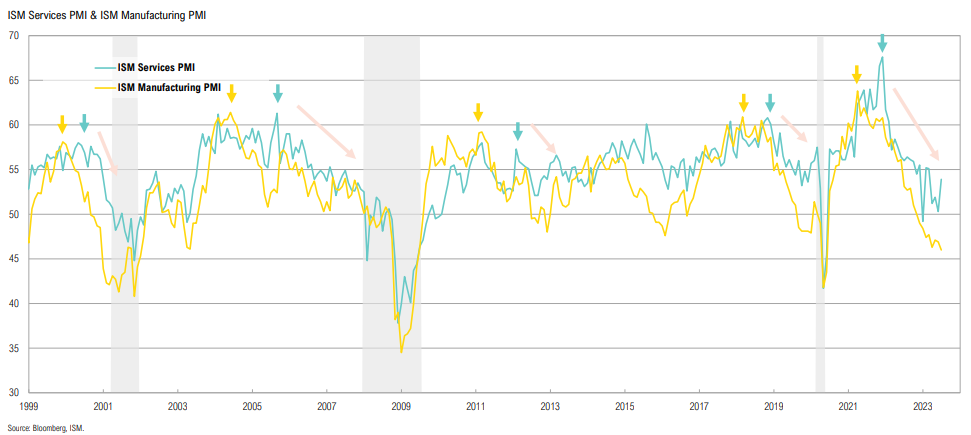
Services & Inventories
The services sector of the economy remains alright: ISM Services PMI has recorded 6 consecutive months of expansion
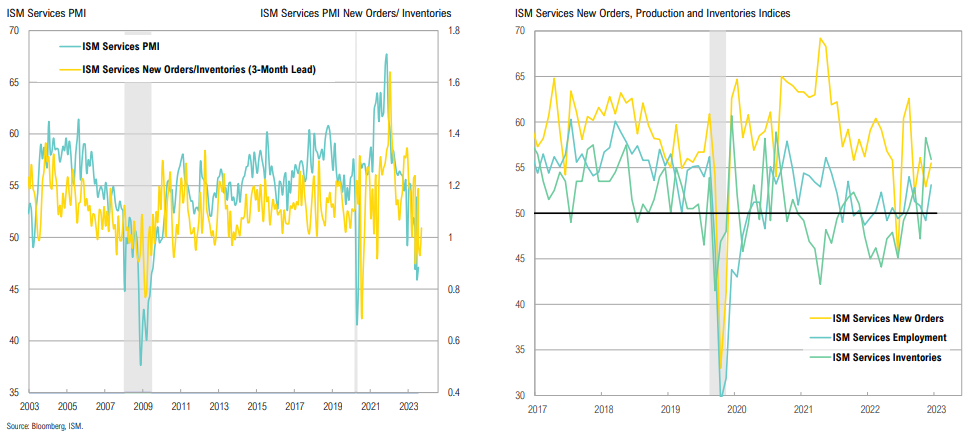
However, ISM Services tends to lag Manufacturing, particularly into slowdowns
Leading Economic Indicator
The Conference Board LEI continues to signal recession, with the Board expecting economic contraction in Q3’23 to Q1’24; stock returns have historically been volatile when LEIs have been at these levels
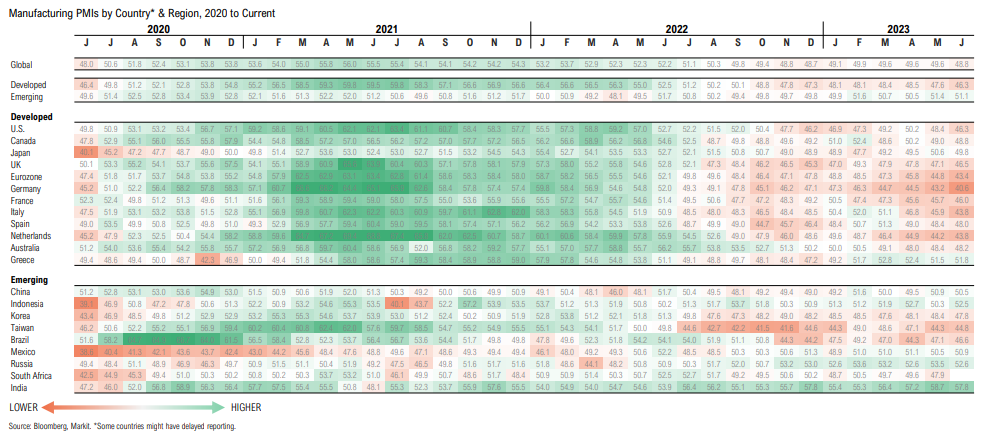
Global Growth
Overall, global manufacturing activity continued deeper into contractionary territory in June; developed market activity continued to slow while EM has been recovering modestly
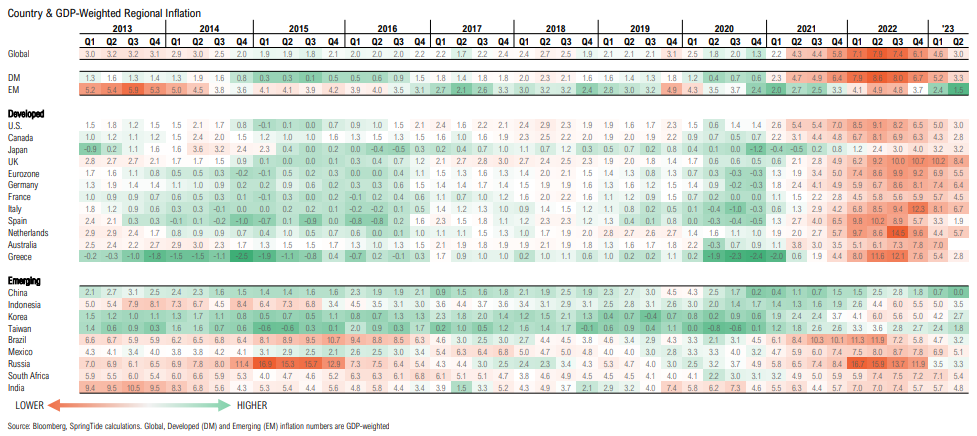
Global Inflation
Global inflation continues to cool, but remains at elevated levels; after many months of near double-digit prints, inflation in the U.K. dropped to 7.9% in June in the first signs of easing
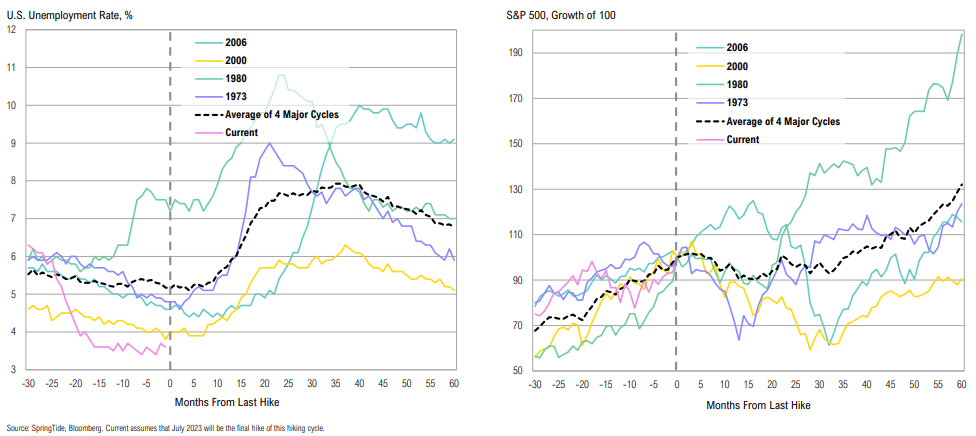
Unemployment
Previous extreme rate hiking cycles have only seen unemployment pick up long after the final hike; current unemployment is at the lowest of all prior rate hike cycles
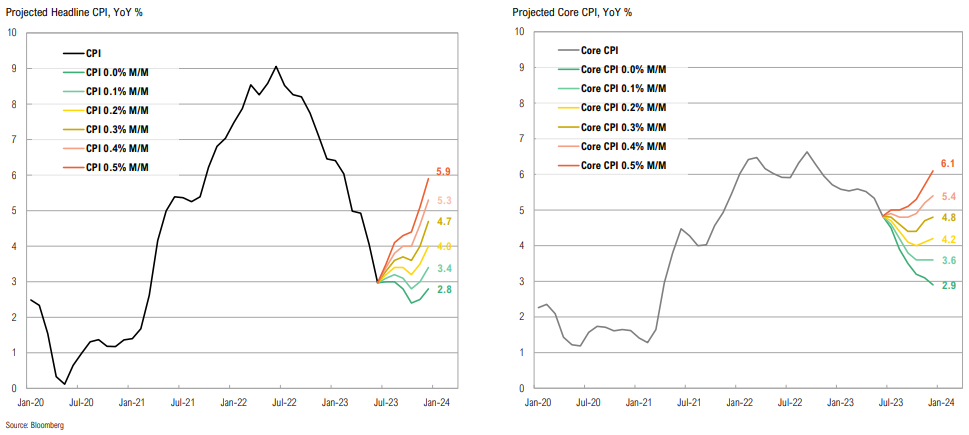
U.S. Inflation
There are no more ‘easy’ CPI prints left to push inflation lower; unless average month-overmonth inflation stays below 0.25%, CPI will rise toward the end of the year due to base effects
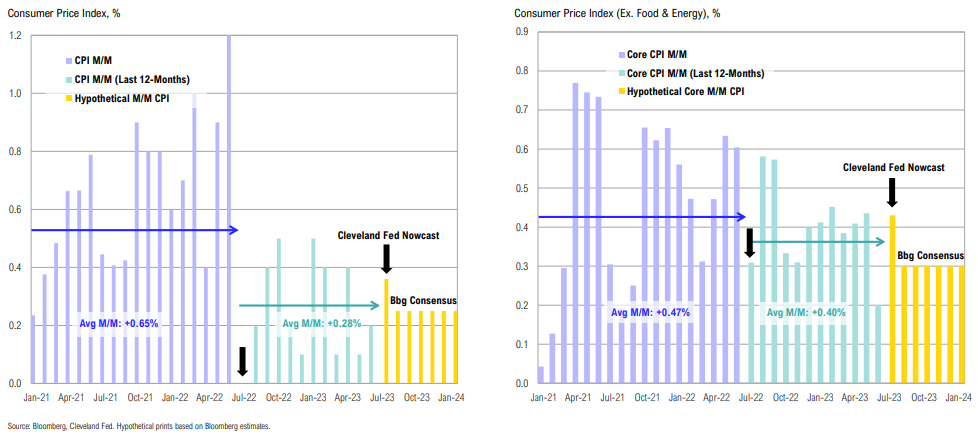
We may see an increase in headline CPI toward the end of the year, even potentially breaching 4.0% again; core CPI should decline, but may also remain above 4.0% at year end
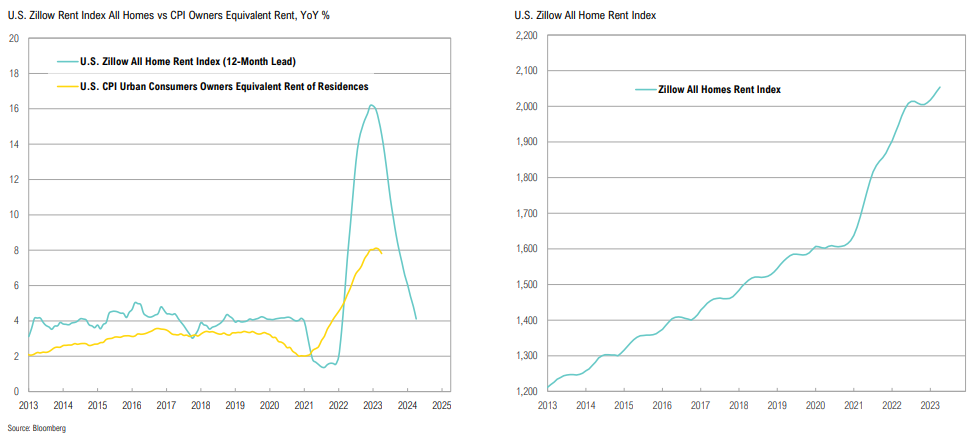
U.S. Rent Inflation
There are signs that the pace of rental price increases have moderated, which will be reflected in CPI in coming months; concerningly though, the Zillow home rent index continues to rise
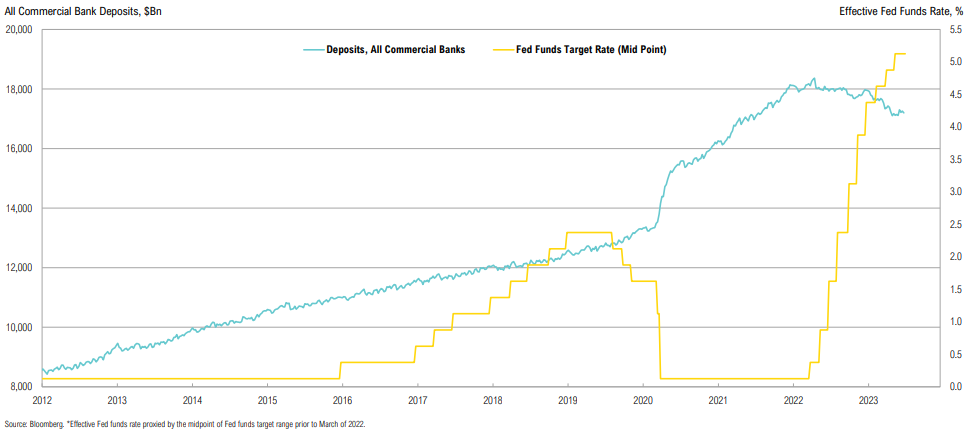
U.S. Banks
Total U.S. bank deposits increased by $2.9 trillion in 2020 (or 21.9%); it was easy for banks to retain and build deposits at near 0% interest rates, but this is no longer the case
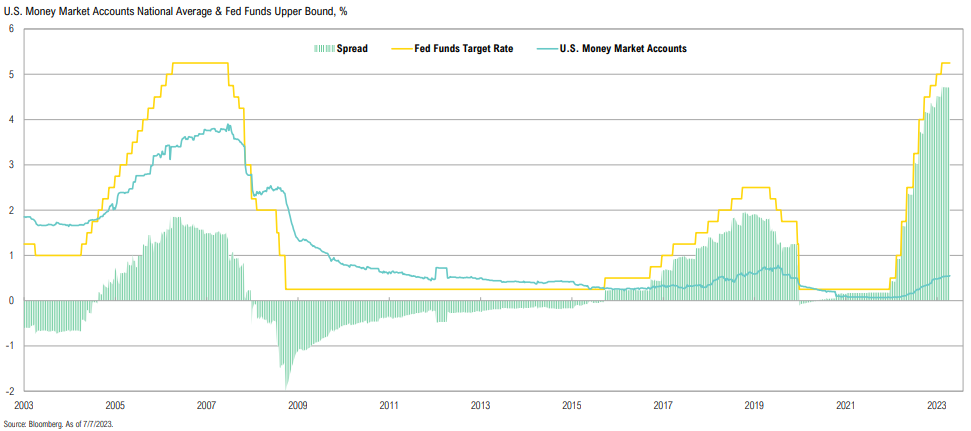
U.S. Banks
Big banks lend to the Fed at rates that dwarf what they pay on deposits, benefitting from higher interest rates; these extreme interest rate spreads contributed to the banking crisis instability that started in March
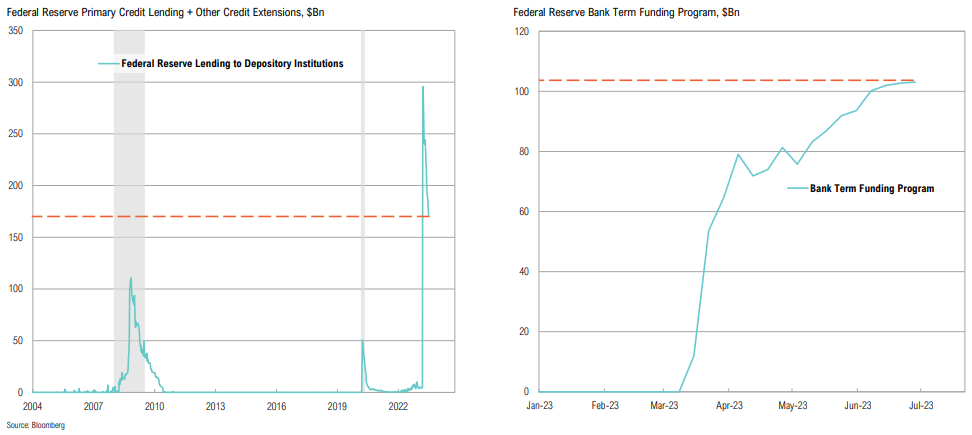
The usage of the Fed discount window (including other credit extensions) remains elevated; Bank Term Funding Program use is at new record levels as banks continue to rely on the Fed for liquidity
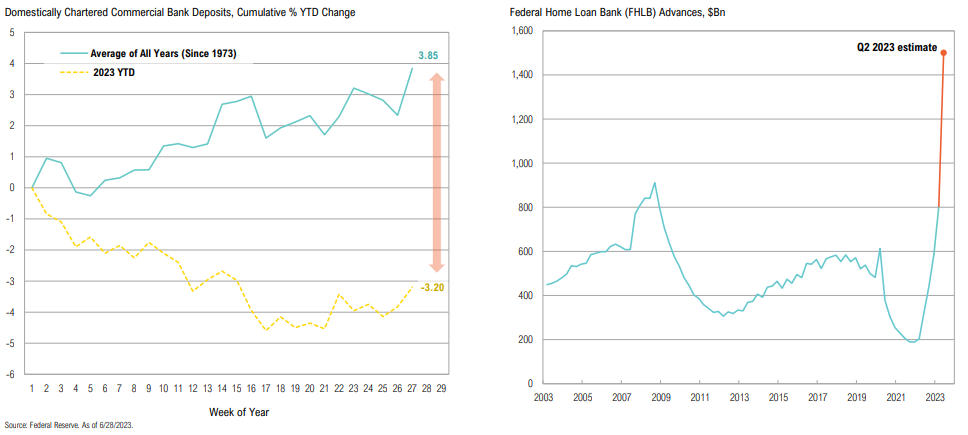
Bank Deposits
Commercial bank deposits remain unable to catch up to the average level; banks continue to tap into FHLB as they lose core deposits
Real Earnings
Real wage growth has finally started to outpace inflation for the first time since 2021, ending the longest period of negative wage growth (24 consecutive months) on record
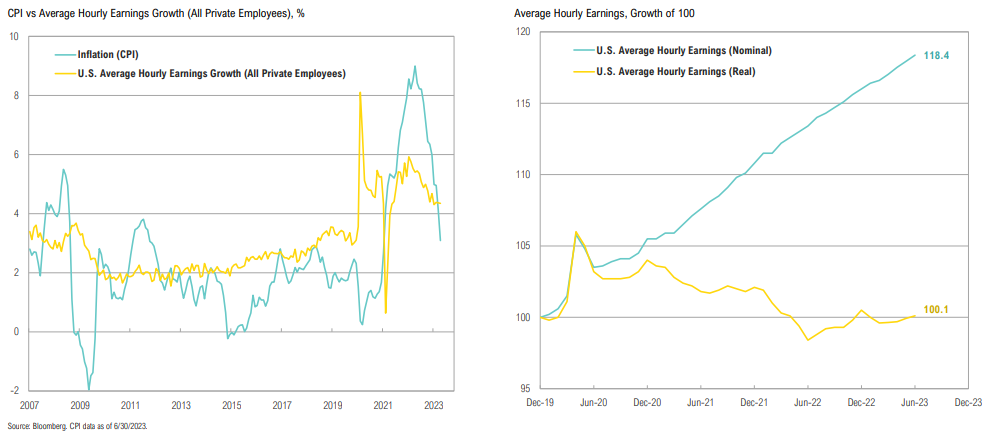
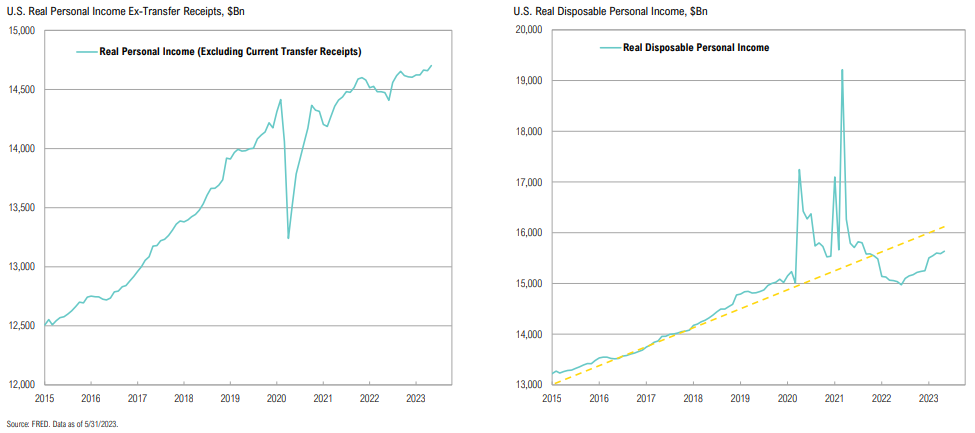
Personal Income
Real income, excluding government transfers, is still grinding higher; total disposable income remains well below average expected trends
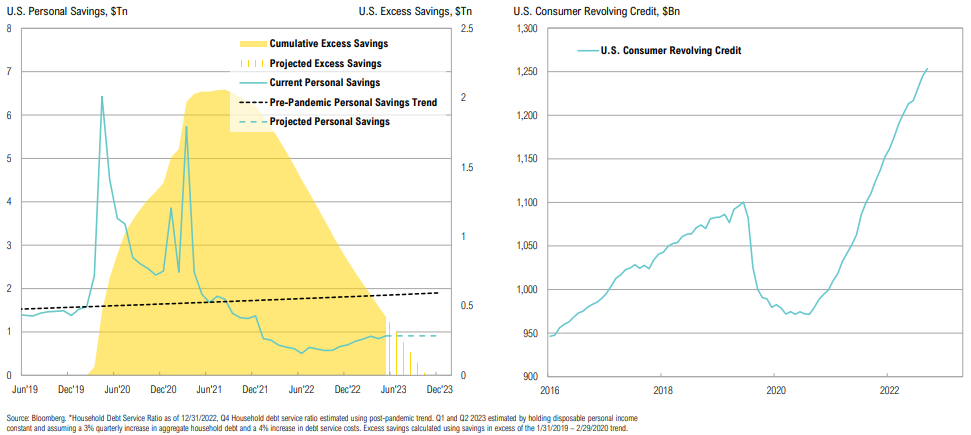
Personal Savings & Debt Payments
While still below the 5-year pre-COVID savings rate of 7.6%, personal savings rates have started to recover, now at 4.6%; if this savings rate continues, excess savings will be depleted by November ‘23
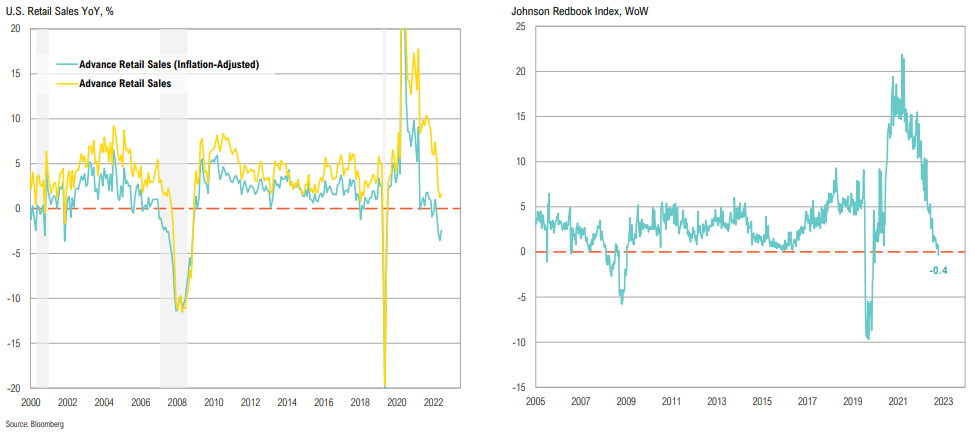
Consumer Spending
When adjusting for inflation, retail sales are still negative; in June, the Johnson Redbook Index recorded its first negative reading outside of the GFC and the pandemic
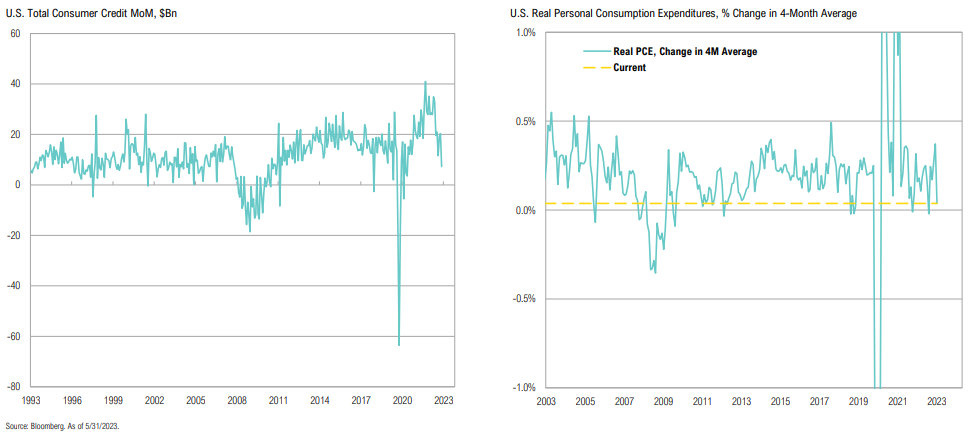
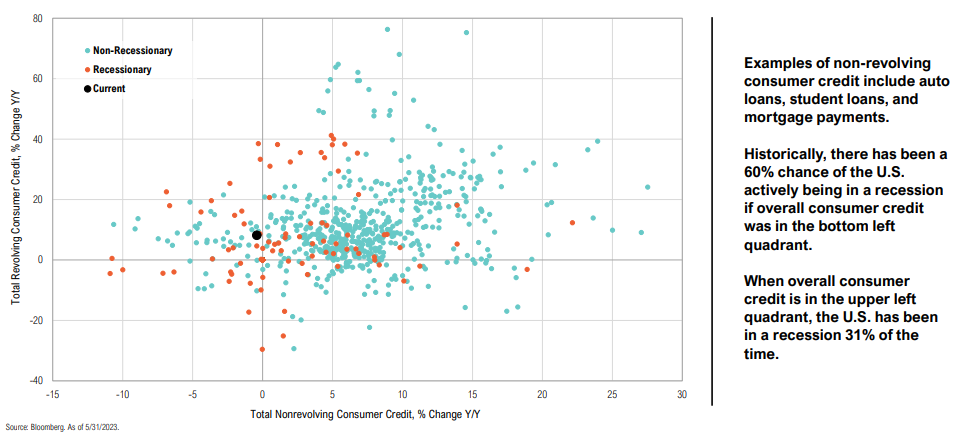
Consumer Credit & Personal Consumption
U.S. consumer borrowing increased by $7.2 bn in May, the smallest month-over-month change since 2020; spending also stalled as personal consumption pace starts to slow
Consumer Credit
Apart from April 2020 (in the midst of the pandemic), June marked the first outright contraction in non-revolving consumer credit since 2011
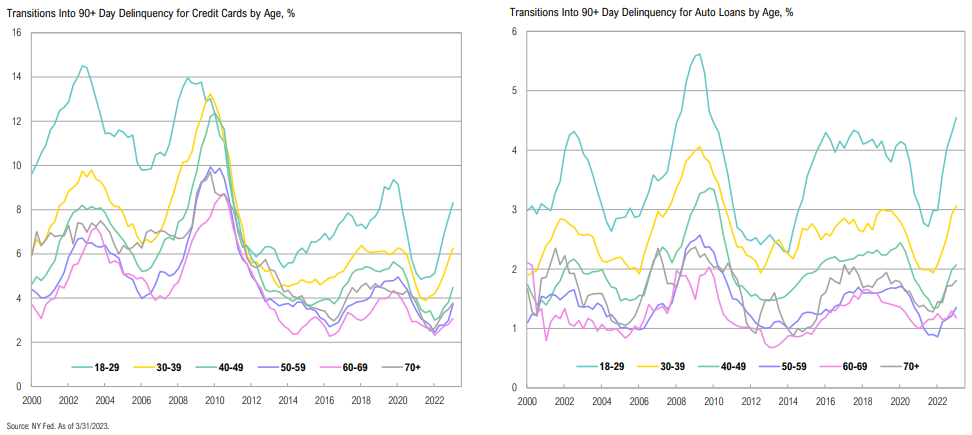
Consumer Credit & Personal Consumption
Credit card delinquencies have started to pick up amongst all age groups, but are most prominent between ages 18-40
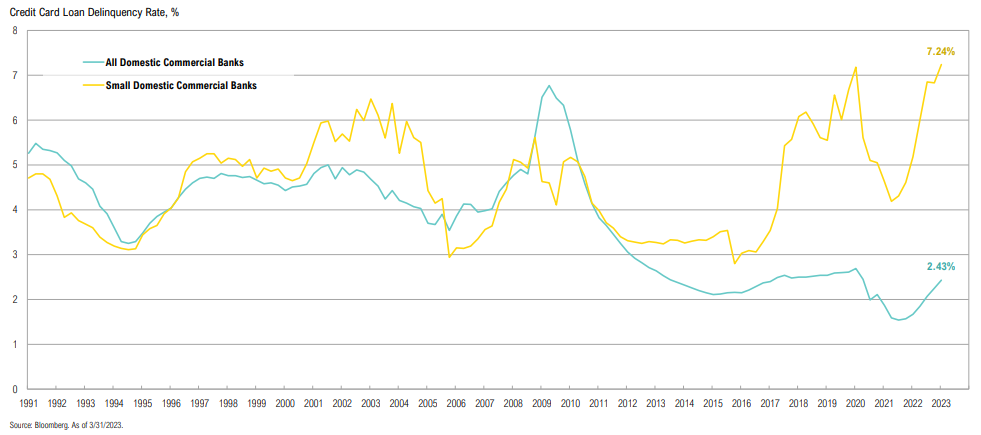
Consumer Loans
Credit card delinquency rates at small banks, who may be hit hardest by these rising delinquencies, are significantly higher than overall delinquency rates
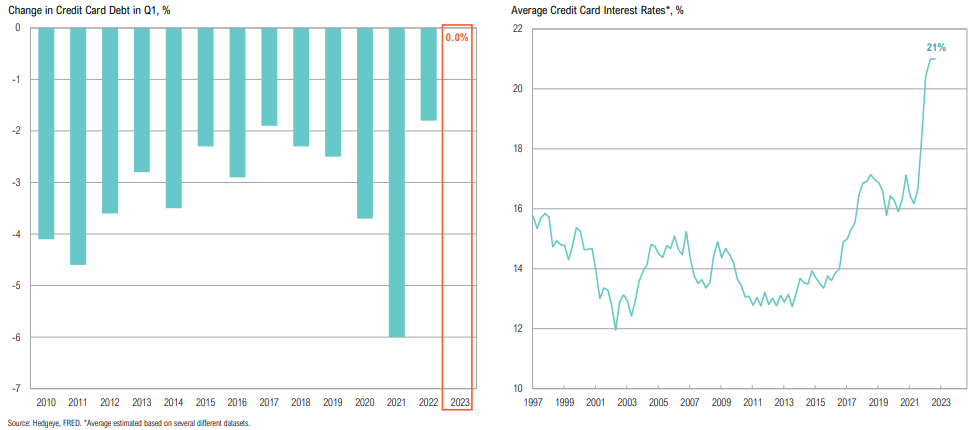
Consumer Credit
A portion of recent consumer spending has been sustained with credit: no credit card debt was paid down from Q4’22 to Q1’23; interest on credit cards is almost 21%
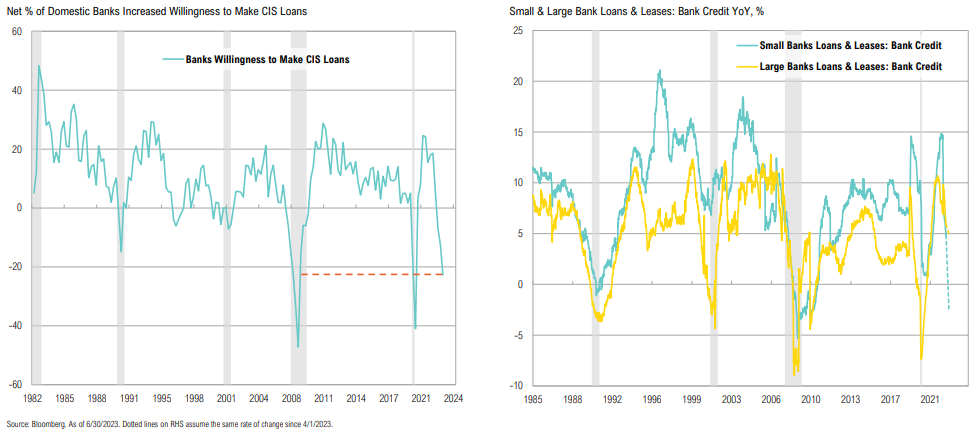
Bank Lending
Both small and large bank lending growth are slowing rapidly; higher rates could continue to drag down loan demand
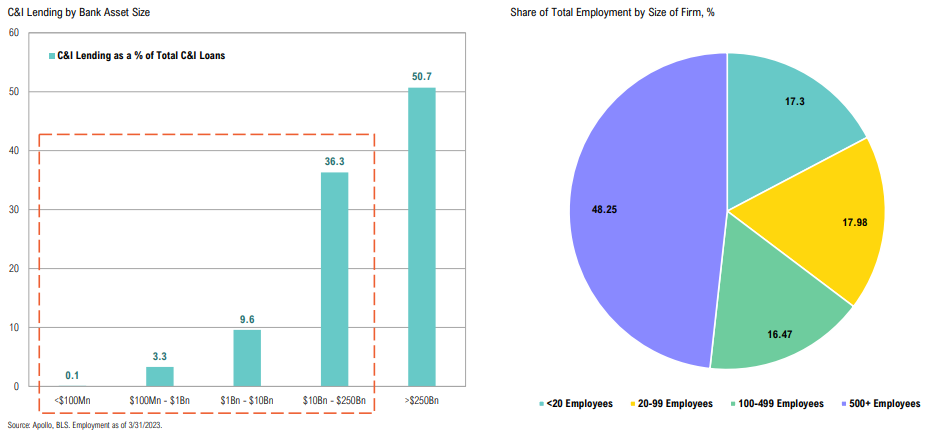
Bank Lending & Small Businesses
Smaller banks and smaller businesses matter! Almost half of C&I Loans are from banks with less than $250Bn in assets; more than half of U.S. employment is at firms with <500 employees
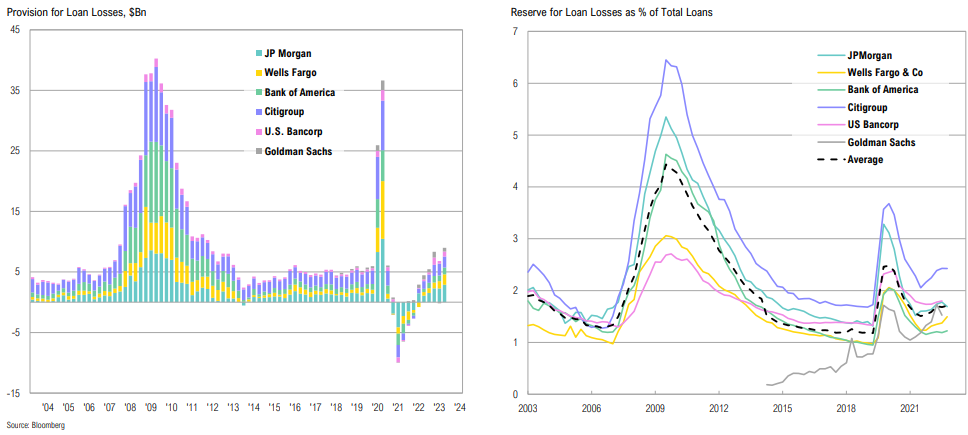
Loan Loss Provisions
While large banks have increased their provisions for loan losses, they remain well below GFC and COVID highs
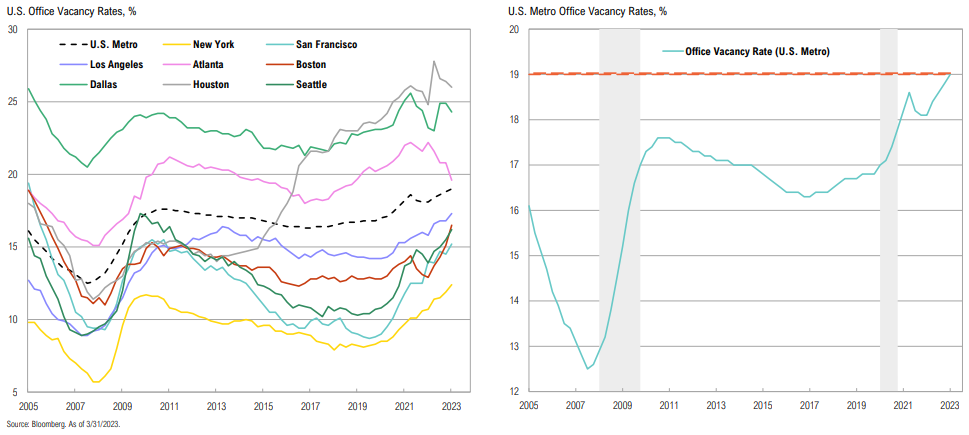
Office Vacancy Rates
U.S. metro vacancy rates have climbed to 19%: LA has reached a record 17.3% and Boston is at 16.5%; only minimal improvements from already-high vacancy rates in Dallas, Atlanta
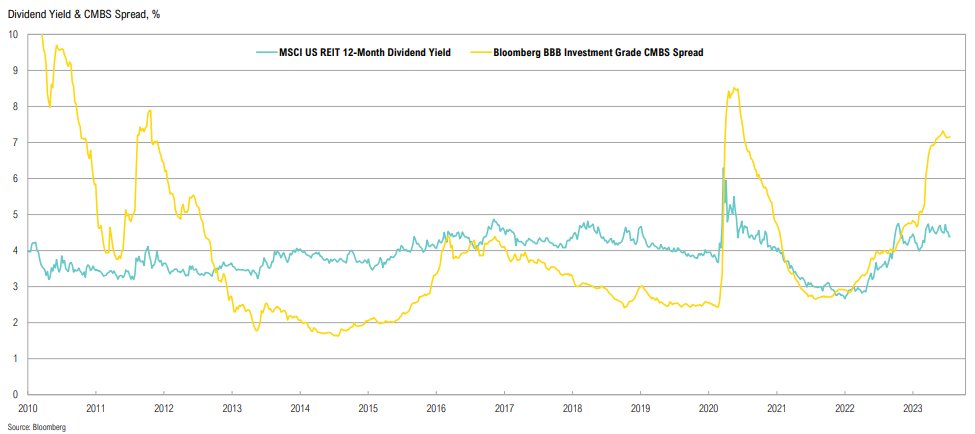
Commercial Real Estate
BBB rated investment grade CMBS securities are showing signs of stress, as spreads have widened to levels last seen in 2020; the sell-off in U.S. REITs has seen dividend yields expand to 4.5%
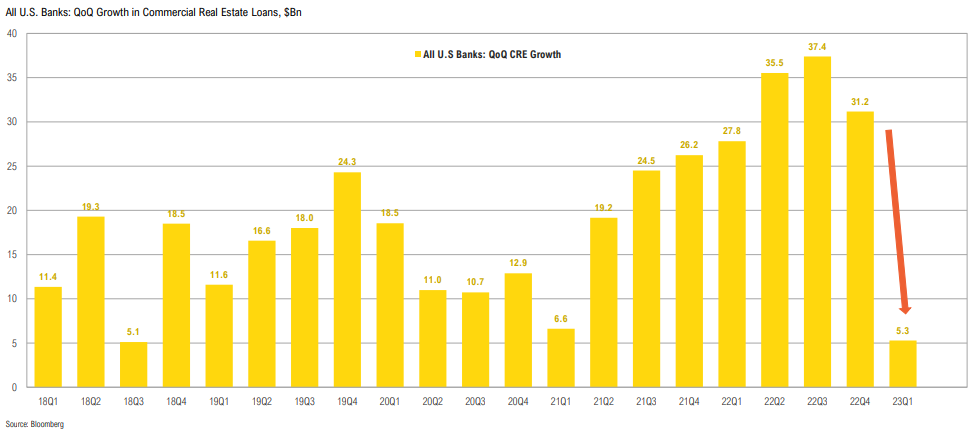
Commercial Real Estate
Commercial real estate loan growth stalled in early 2023 with only $5.3 billion net increase in 23Q1, the smallest quarterly increase since 2018
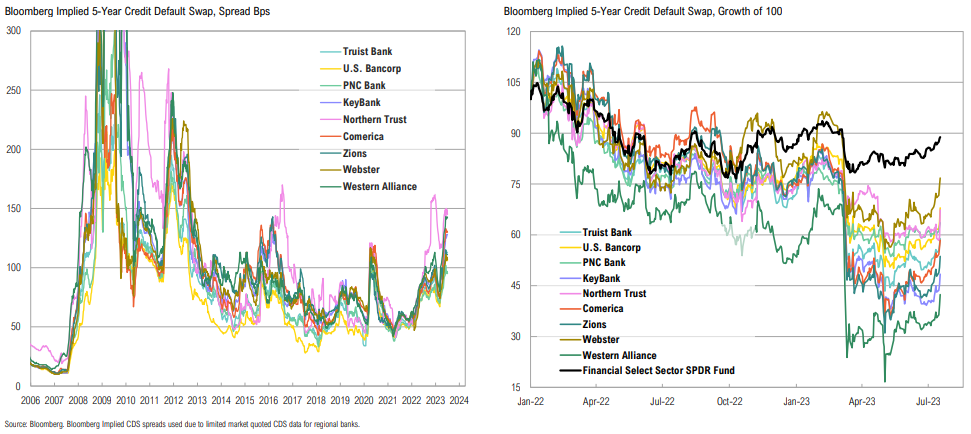
U.S. Banks
Market seem to be starting to give the all-clear on regional banks, but under-the-surface issues may still be lurking; the cost to insure against regional bank defaults remains elevated
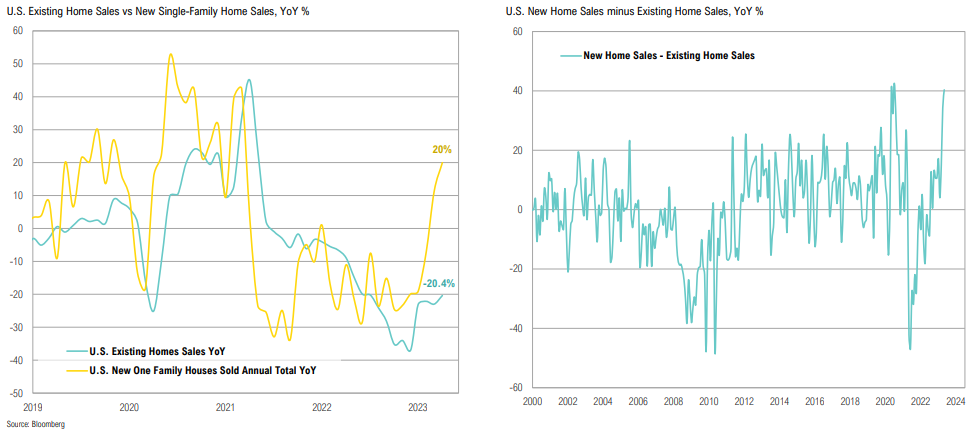
Residential Real Estate
New home sales have fared well, largely due to supply challenges of existing homes and the ability of homebuilders to offer homebuyers lower mortgage rates on new homes
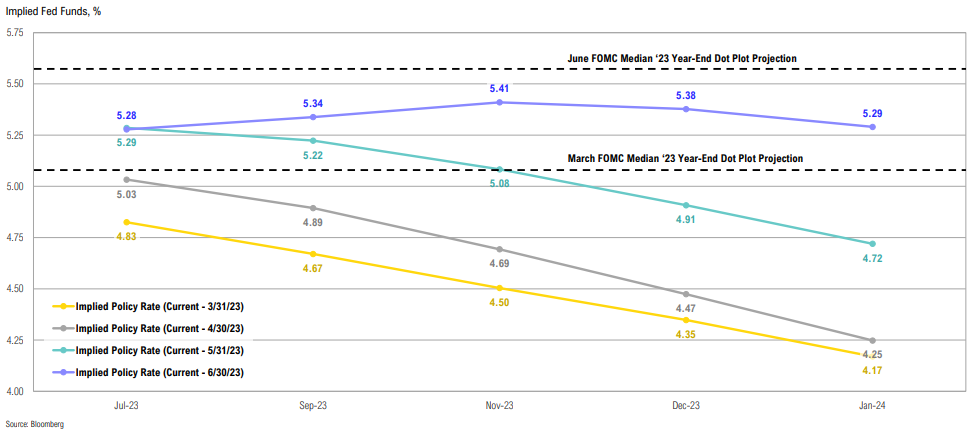
Implied Fed Funds
Year-end Fed Funds projections shifted higher over the quarter due to strong economic data; markets are anticipating at least one more rate hike this year, with a cut only in early 2024
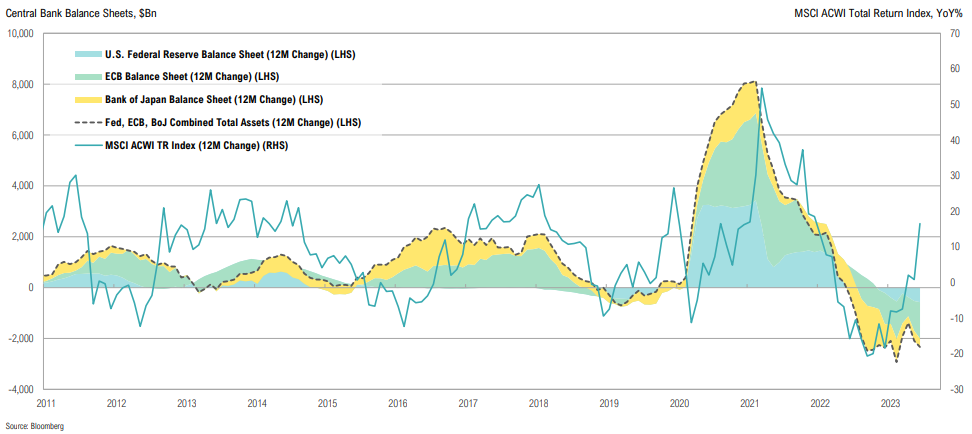
Central Bank Balance Sheets
Fed, ECB and BoJ combined 12-month change in assets has been negative since June 2022; this has historically corresponded to poor global stock performance, making the current divergence unusual
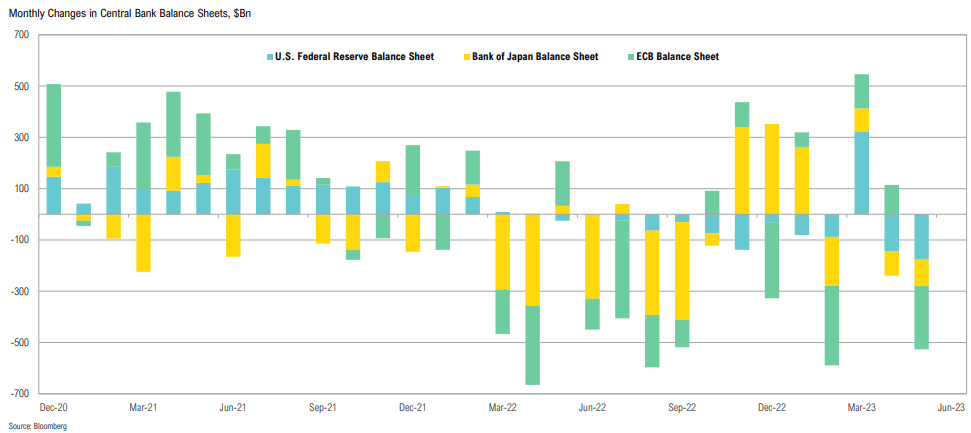
Central Bank Balance Sheets
The Fed has done > $300bn of QT in the last 2 months; in US dollar terms, both the BoJ and ECB have seen balance sheet reduction, but this is due to currency movements rather than actual QT
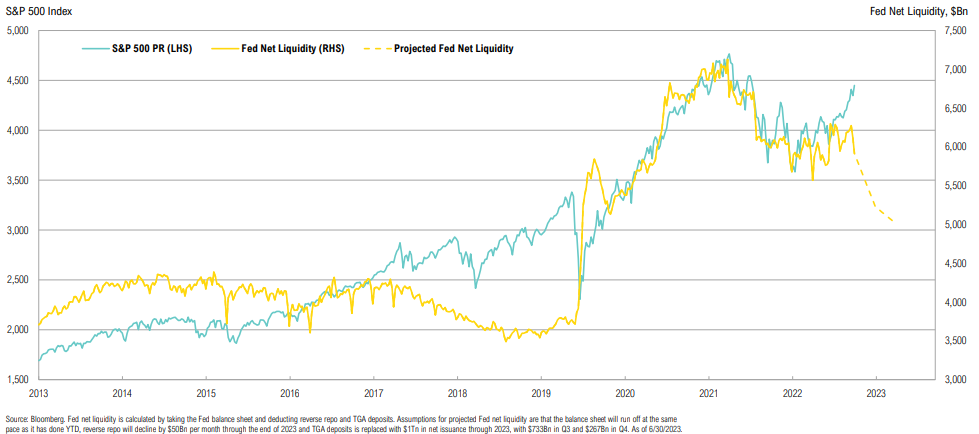
Fed Liquidity
Fed net liquidity has had a tight correlation with stock market returns post-COVID; assuming the Fed continues with QT, liquidity should dry up throughout the rest of the year
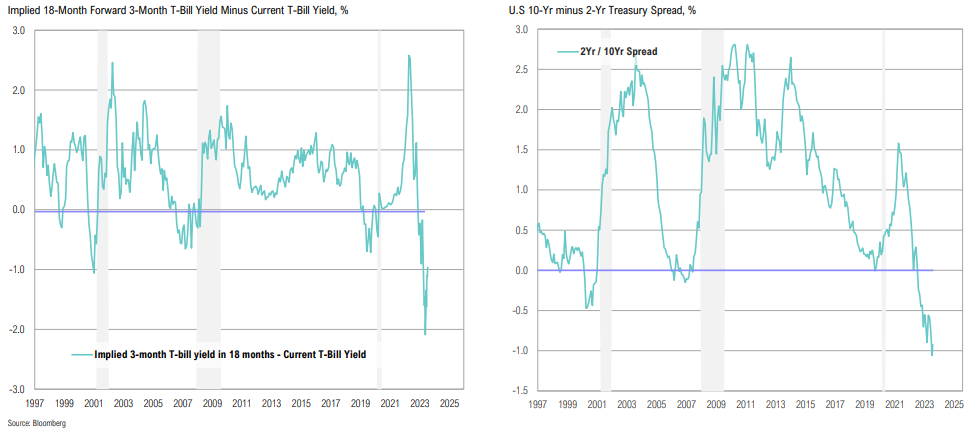
Powell Yield Curve Indicator & 2/10
The “Powell yield curve indicator” marginally eased its inversion over the quarter; the 2/10 inversion continued to deepen over the quarter, ending June at -1.06—the deepest inversion since the 1980s
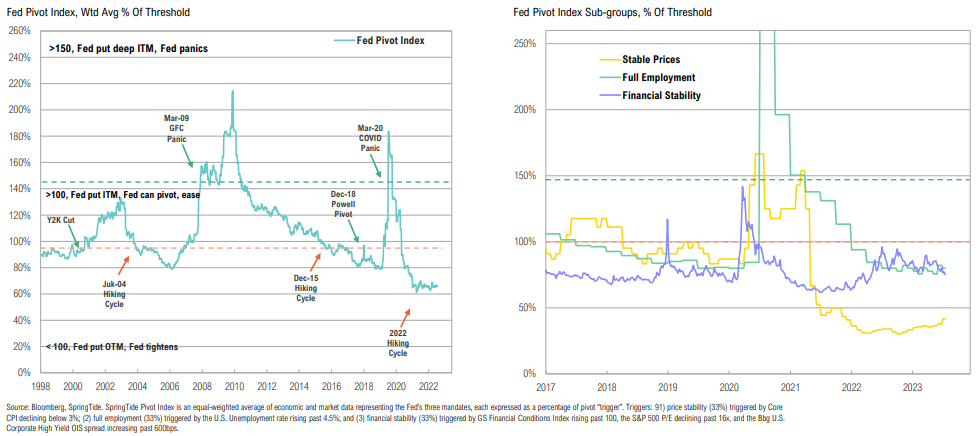
The Fed Pivot Index
A Fed pivot isn’t justified by the data—it would risk extending inflation shock and further eroding the Fed’s credibility, however, increasing banking system stress could cause pivot
There is no margin of safety in stocks that price in world domination.
Palm Valley Capital Management, June 2023 Commentary
Equity
Q2 was favorable for all risky assets with U.S. large cap stocks performing best, up 8.7%; emerging markets stocks struggled to capitalize on the risk-on environment, gaining just 0.9%
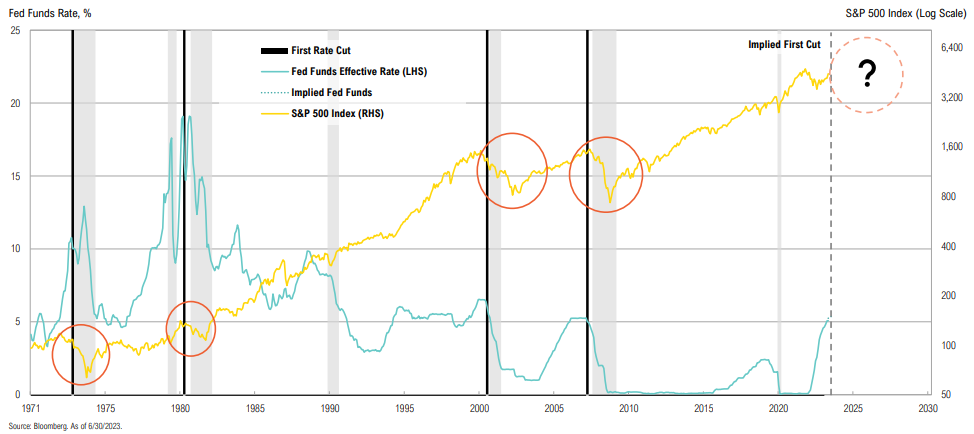
Historical Fed
The Fed has continued to raise rates; while a pause/rate cut could be on the horizon, history shows that the Fed cutting rates doesn’t necessarily mean pain in the stock market is over
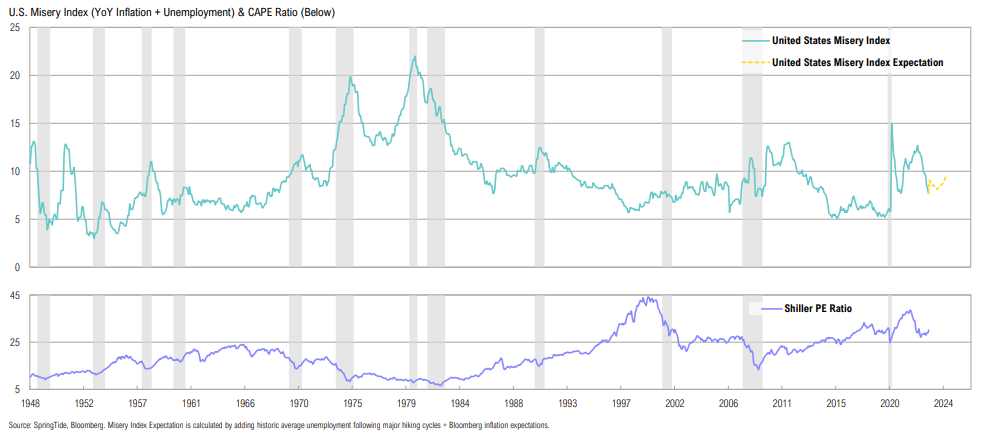
Misery Index
Did the Misery Index just bottom? Even though inflation is expected to stay contained, further declines in CPI may require the labor market to crack, which would drive it higher (with potential implications for equity valuations)
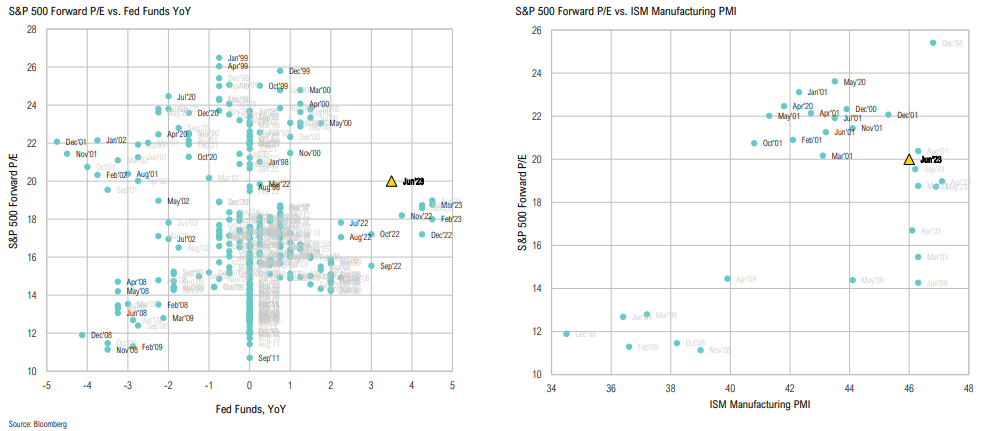
Forward P/Es
Conflicting signals: we currently have the highest fwd. P/E ever, given YoY change in FFR; the last time we had recessionary manufacturing PMIs with these forward P/Es was the Tech Bubble
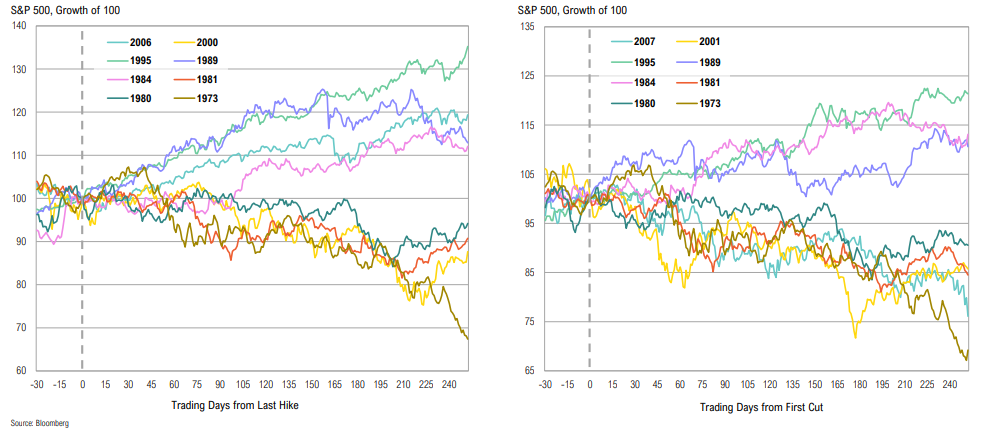
Historical Fed
Win big or lose big: markets have had very different outcomes following the first rate cut; the historical probability of a decline is slightly higher than that of a rally
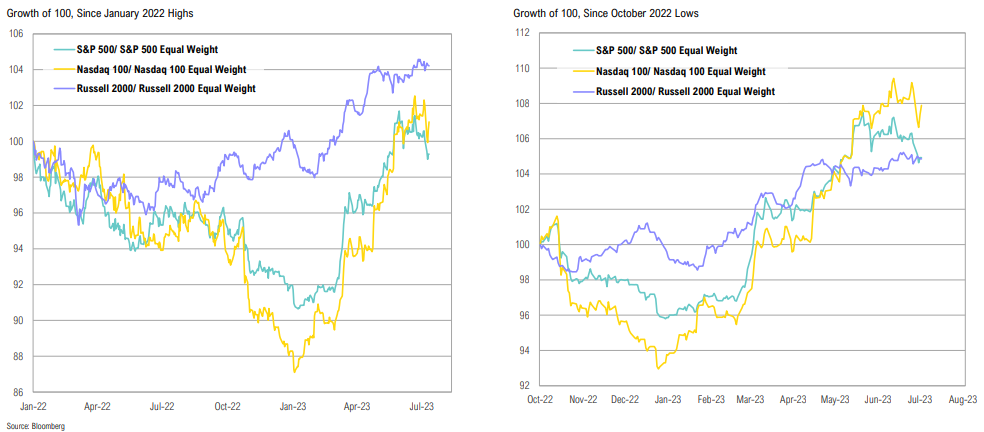
Market Breadth
The breadth of the stock rebound has been poor across large caps, small caps, and the tech-heavy Nasdaq, hinting at an unsustainable crowding into names that already weren’t cheap
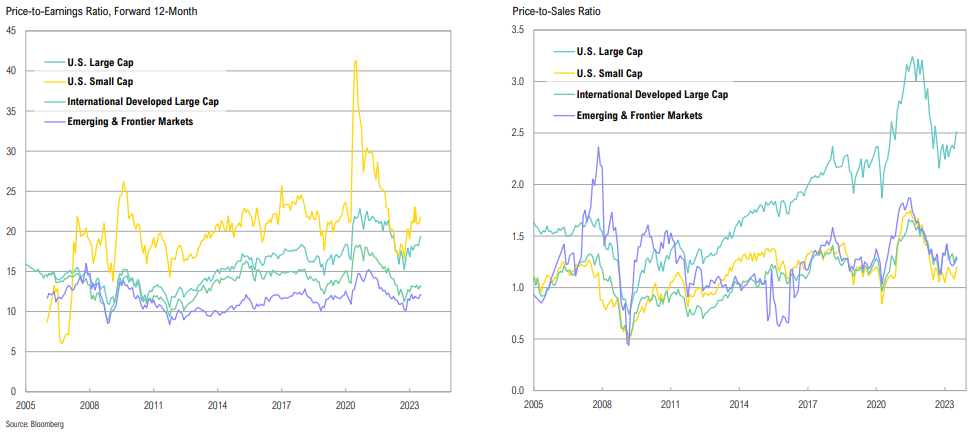
Market Valuations
Valuations crept higher over the quarter as stocks rallied; EM stocks remain relatively cheap vs. developed markets, but ‘value trap’ risk remains if recent growth optimism doesn’t materialize
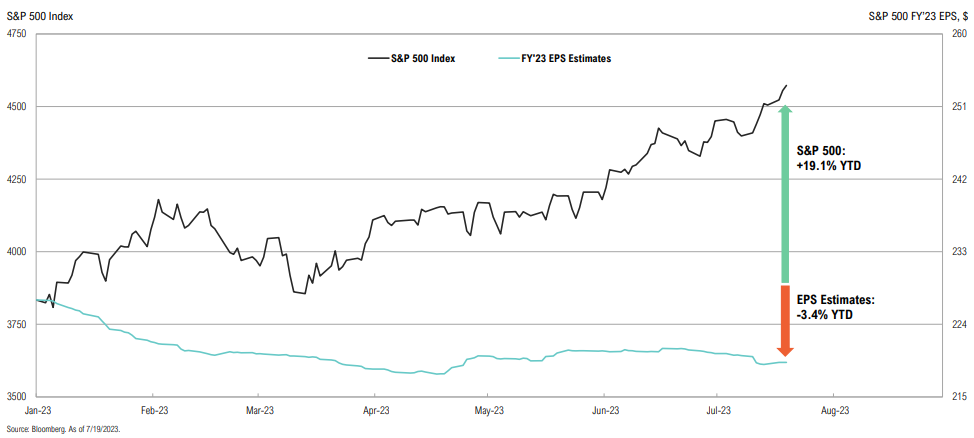
S&P 500 Earnings
Divergence (alligator jaws): the S&P 500 is up 19.1% YTD despite full-year earnings expectations declining by 3.4%, to $219 per share
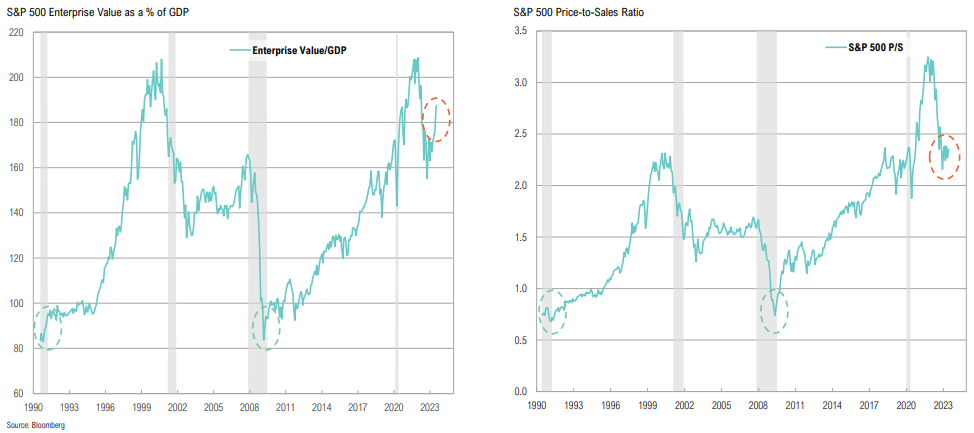
S&P 500 Valuations
U.S. large cap valuations continued to move higher, now well above historical average; earnings expectations have come in, showing a mild contraction over FY’23
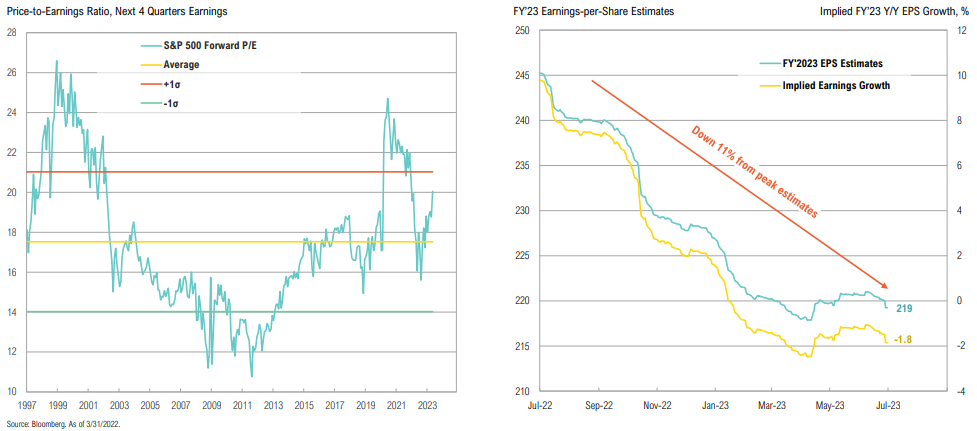
Counter to “it’s all priced in”: adjusting for record-high margins, equity valuations are not remotely compelling (but this won’t matter until it does, which could take years)
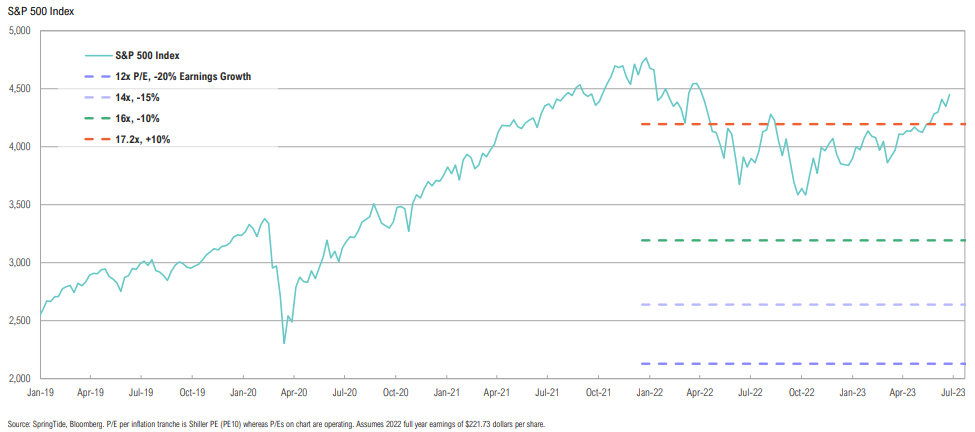
S&P 500 P/E Multiples
Depending on the path of inflation and earnings growth, where might the S&P 500 trend to? Below are 12x, 14x, 16x and 17.2x (LT average) P/Es applied to various EPS scenarios
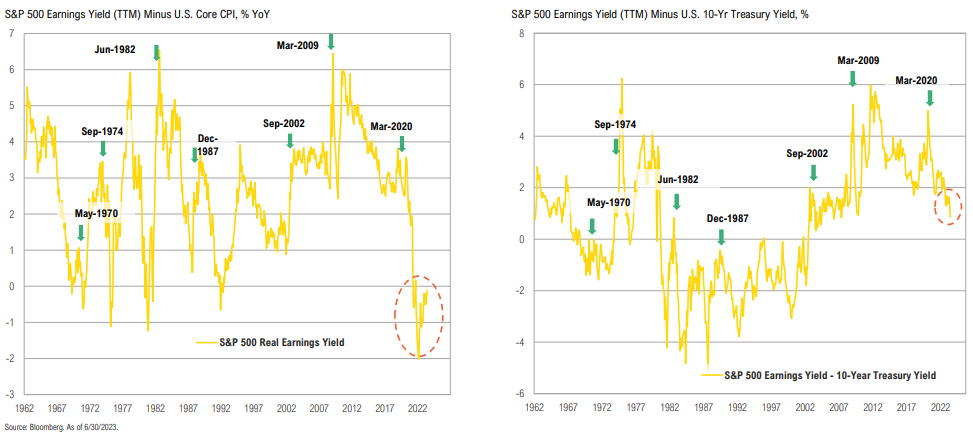
S&P 500 Valuations
The S&P 500 real earnings yield is still negative (based on core CPI), looks nothing like historical bear market troughs (or peaks in earnings yield)
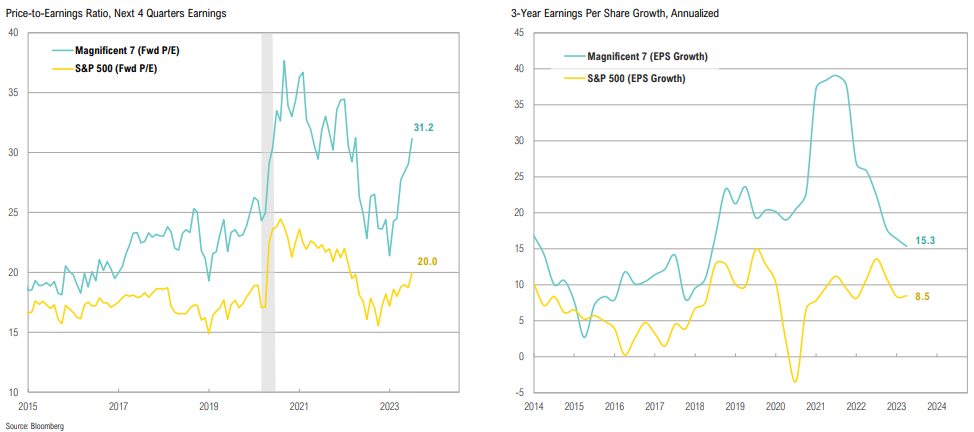
Magnificent 7 vs S&P 500
Back to the future: fueled by the AI buzz, the outperformance of the Magnificent Seven in 2023 (up +68% YTD) mirrors their underperformance in 2022
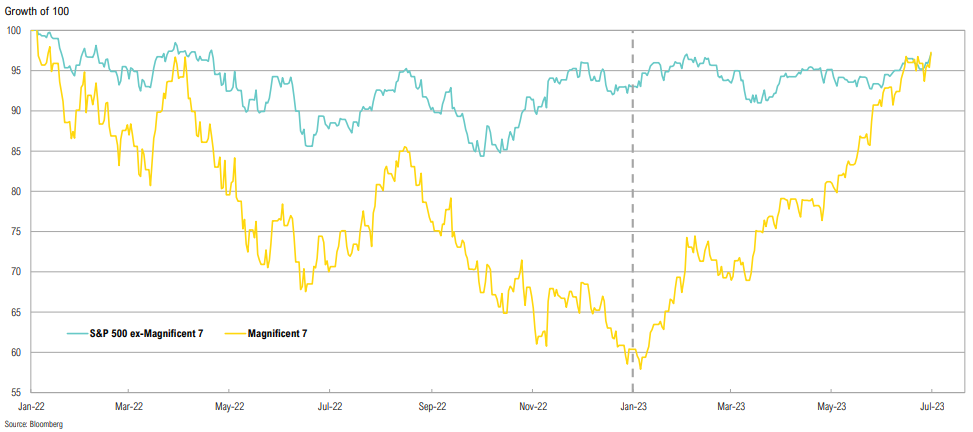
As investors have crowded into the Magnificent Seven, they’ve driven valuations back up to COVID levels, even though EPS growth has slowed drastically
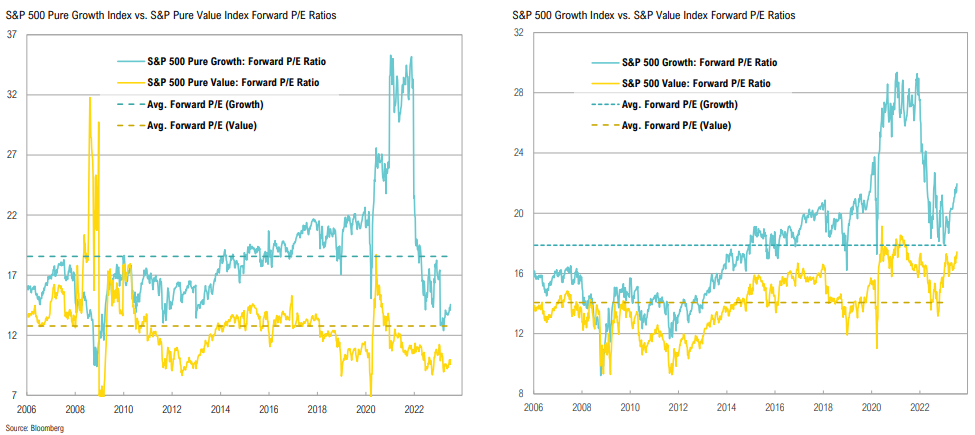
S&P 500 Value vs. Growth
Depending on the index considered, S&P 500 valuations look either expensive or cheap; nevertheless, both sets of indices have been highly affected by reconstitutions
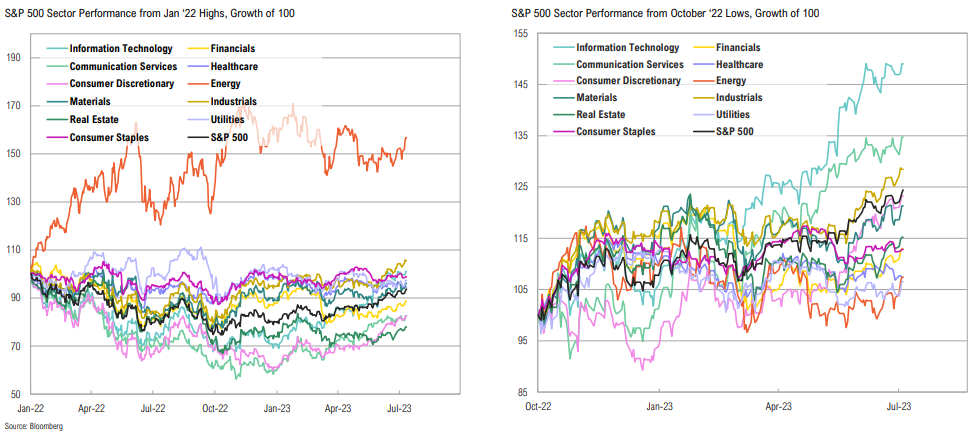
S&P 500 Sector Performance
Communication Services and Tech, which led the market to the downside in 2022, have now led the market to the upside since the October 2022 low
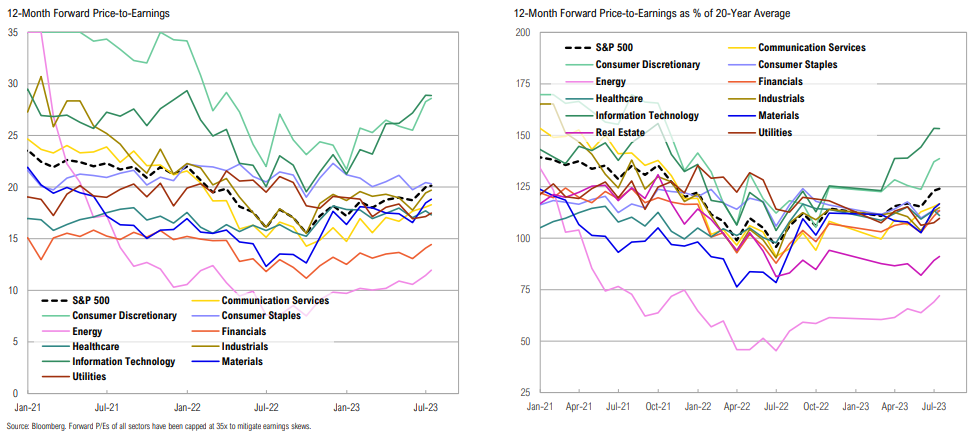
S&P 500 Sector Valuations
Energy and Real Estate are currently the only two sectors which are trading below their 20-year average valuations
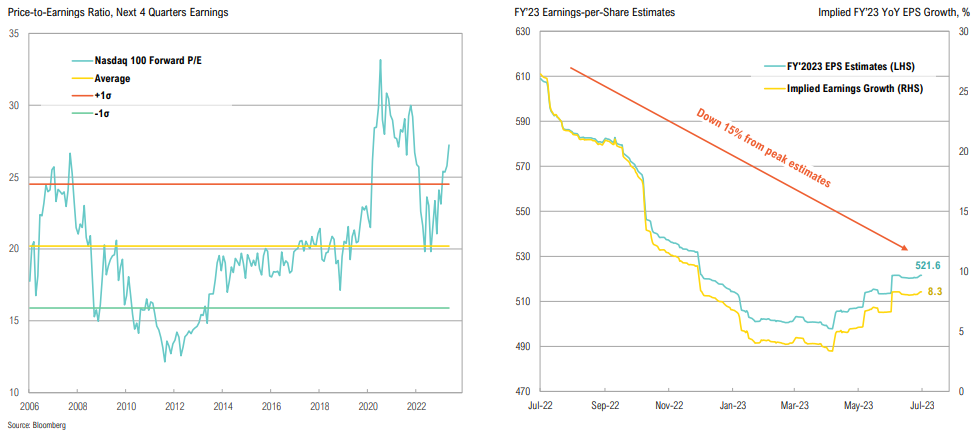
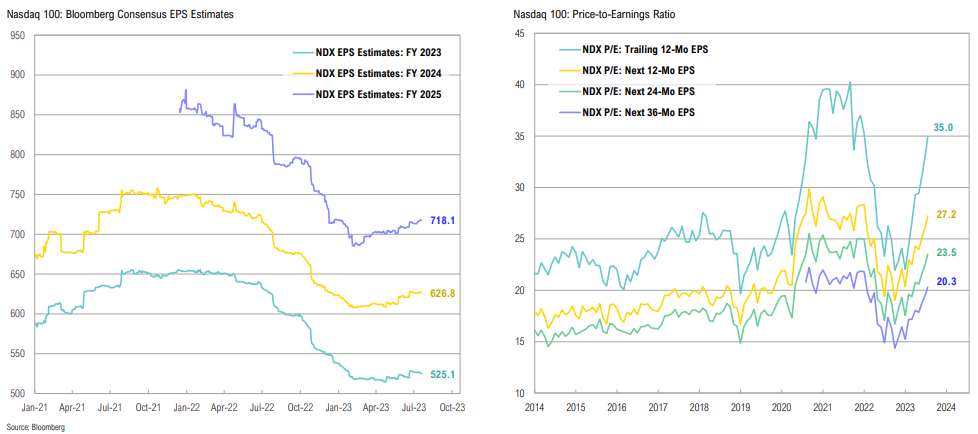
Nasdaq 100 Valuations
Nasdaq forward valuations have continued to move higher to well above historical averages; earnings growth has fallen more than 15% from peak estimates
Nasdaq 100 Valuations
While earnings estimates have fallen sharply from peak, markets are still pricing in strong EPS growth over coming years; using 3-yr forward EPS estimates, NDX P/E ratio falls to 20.3x vs current 35.0x
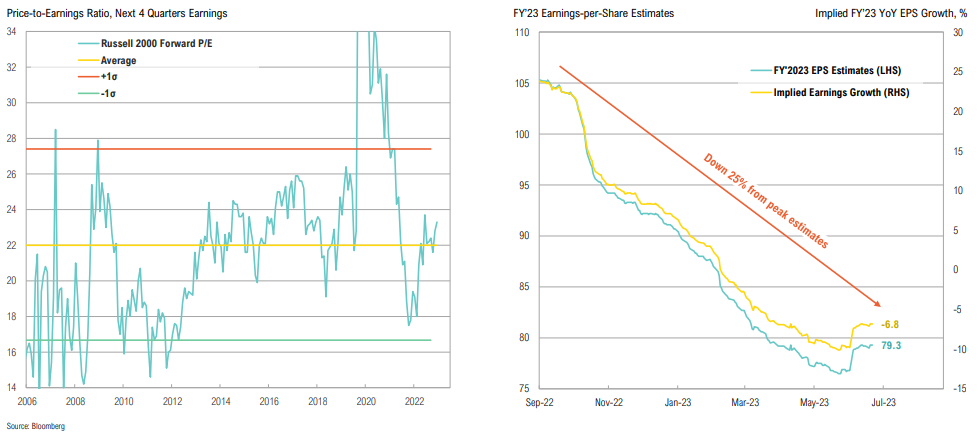
Russell 2000 Valuations
U.S. small cap forward valuations have moved higher, trading just above historical average; focus now shifts to FY’23 earning expectations, which have fallen 25% from 2022 peak
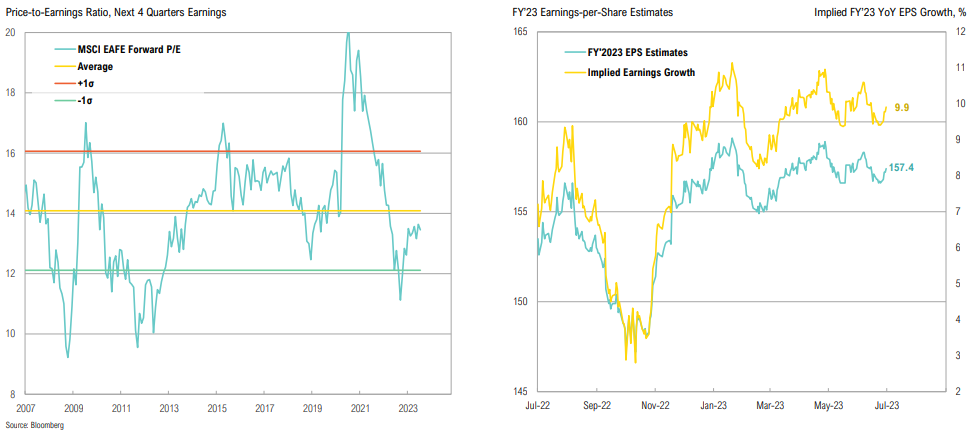
MSCI EAFE Valuations
Developed international forward valuations also moved higher, and are now slightly below historical average; FY’23 earnings expectations indicate 10.0% YoY growth
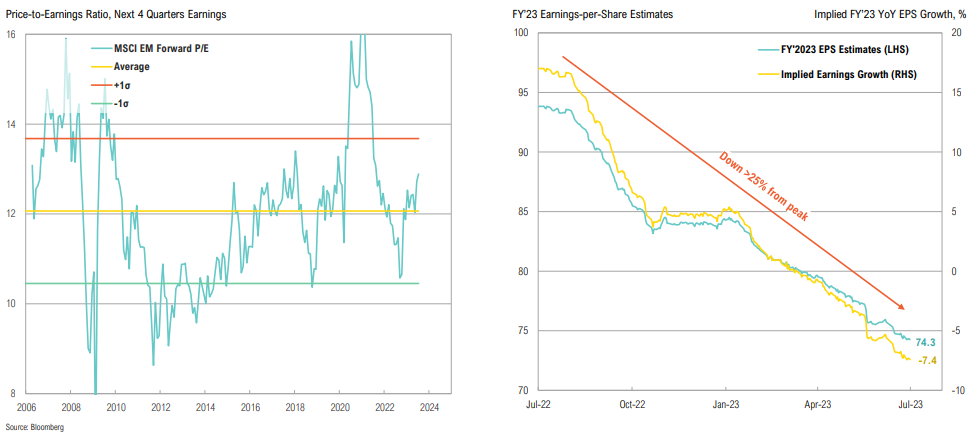
MSCI EM Valuations
Emerging market forward valuations are well above their historical average; earnings expectations continue to trend lower, down > 25% from their peak
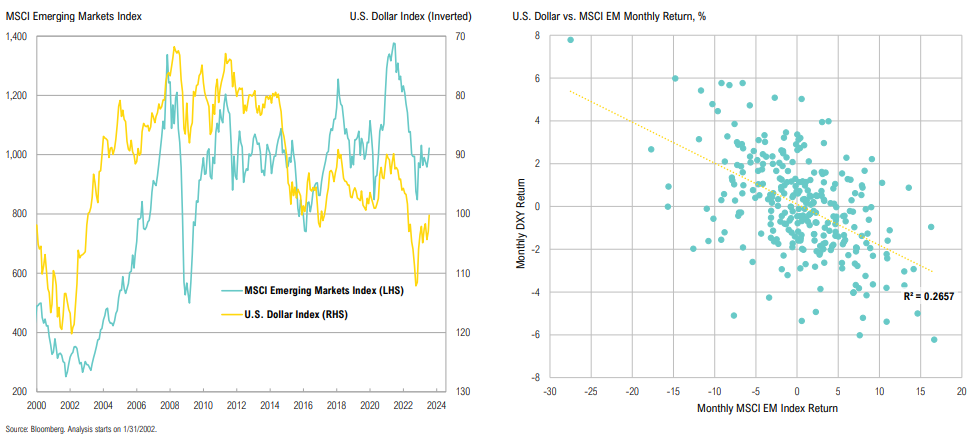
EM vs. USD
Dollar bulls probably want to be underweight EM and vice versa; in the absence of a strong opinion on the USD, we don’t have a strong opinion on EM
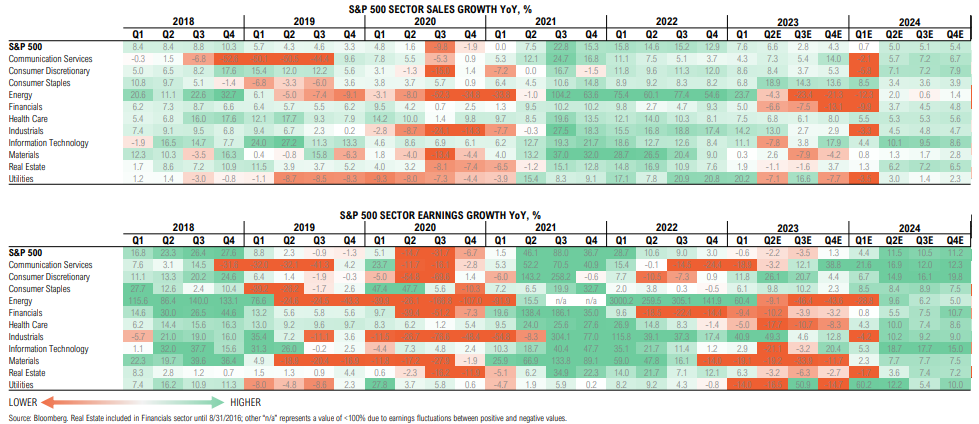
Sales & Earnings Growth
Sales growth is expected to slow in 2H23 before increasing to a modest +5% YoY; but earnings growth is expected to jump by >10% YoY… What’s going to drive margins?
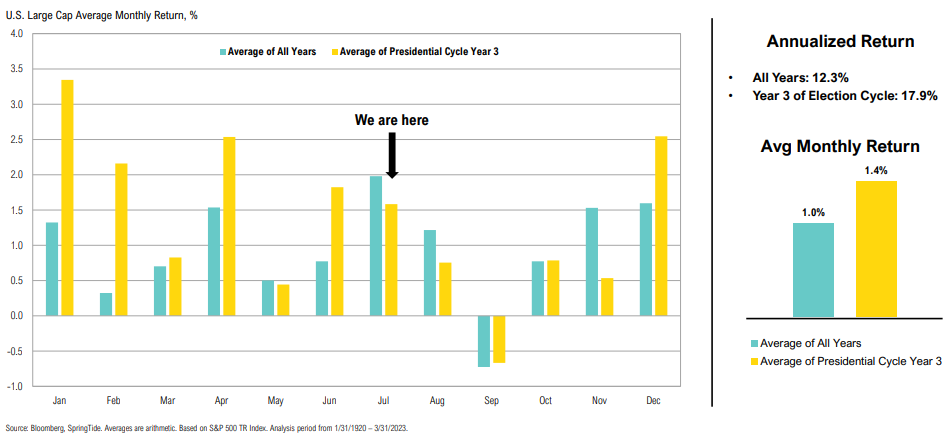
Election Cycles
The historic outperformance of year 3 of the election cycle is mostly prominent at the start of the year—we are past that point now
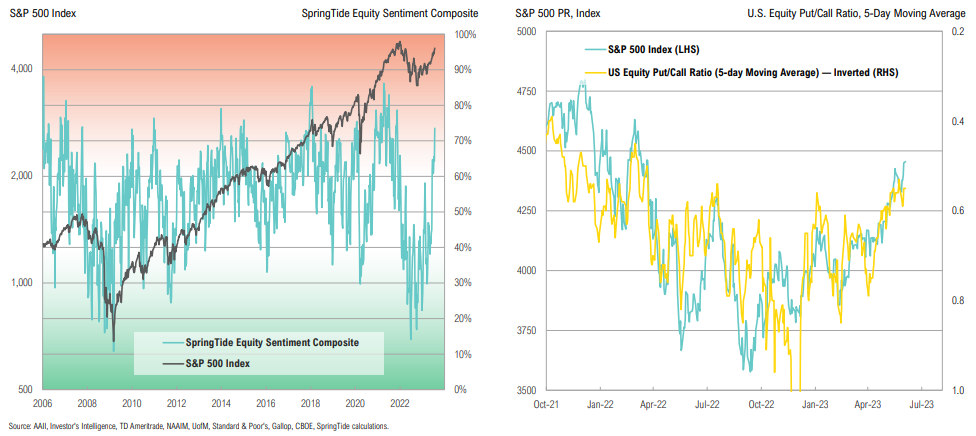
Equity Sentiment
Overly bearish sentiment cleared over the quarter, making way for bullish sentiment; put/call ratio is showing increased bullishness at 0.55, rising to levels last seen in January
Equity Sentiment
Bullish sentiment jumped up over the quarter, as did equity allocations; say-do spread dropped to more reasonable levels
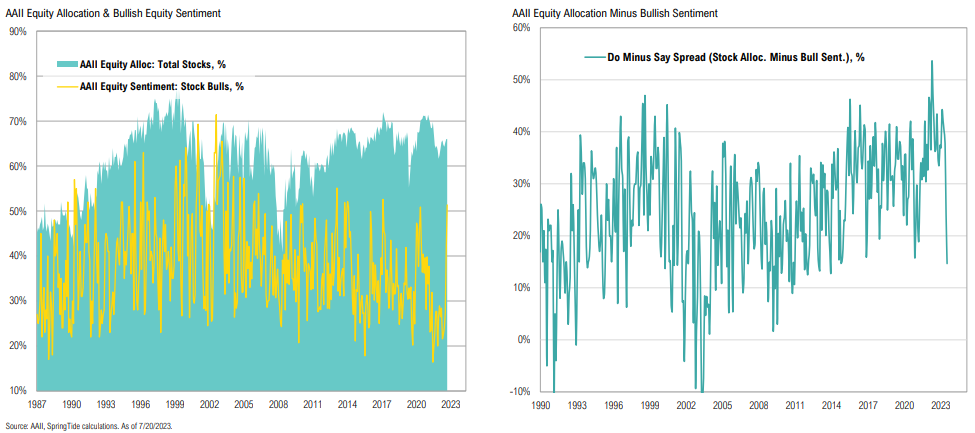
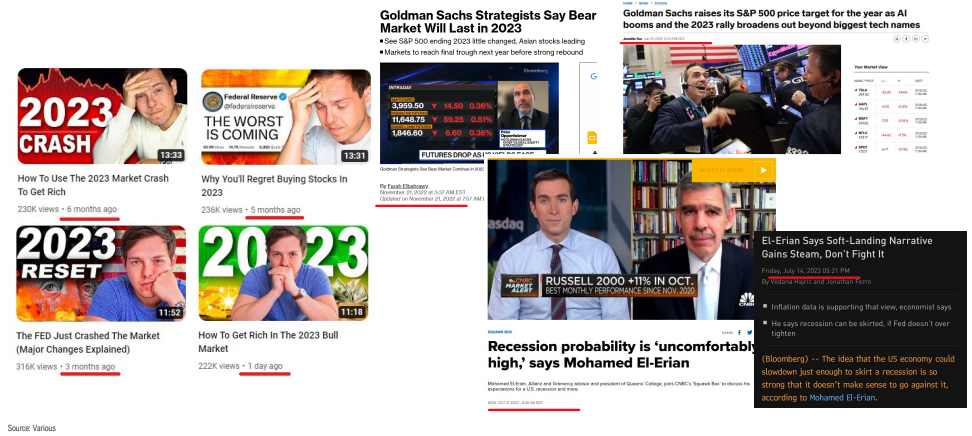
Equity Sentiment
Nothing like price to change sentiment
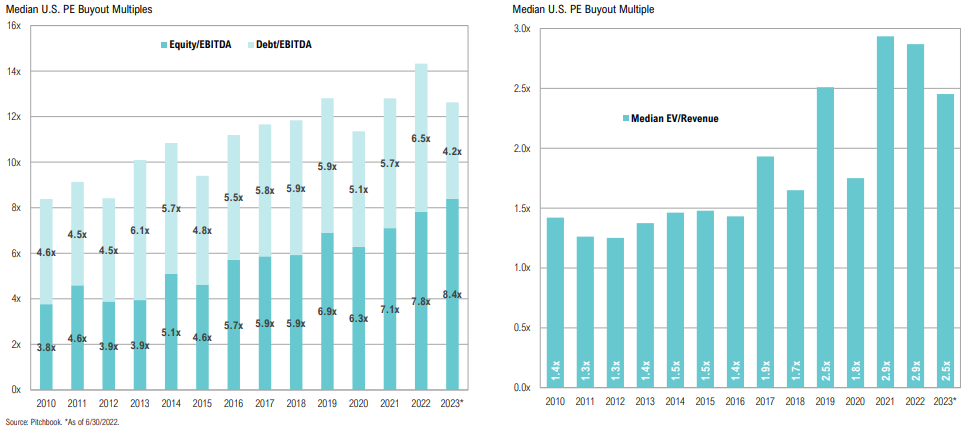
Buyout Multiples
Median equity share in new buyout deals is now over 60% for the first time since the GFC; higher equity share indicates increased price risk and an inability to tap into debt markets
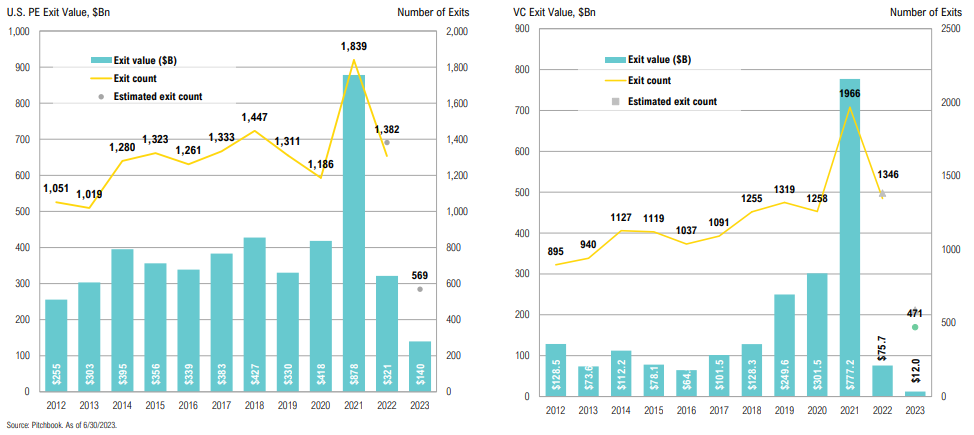
Private Equity Exits
The lack of exit options in 2022 has increased the importance of the secondary market
Secondaries Fundraising
After a record year in 2020, secondaries fundraising has fallen back to more typical levels
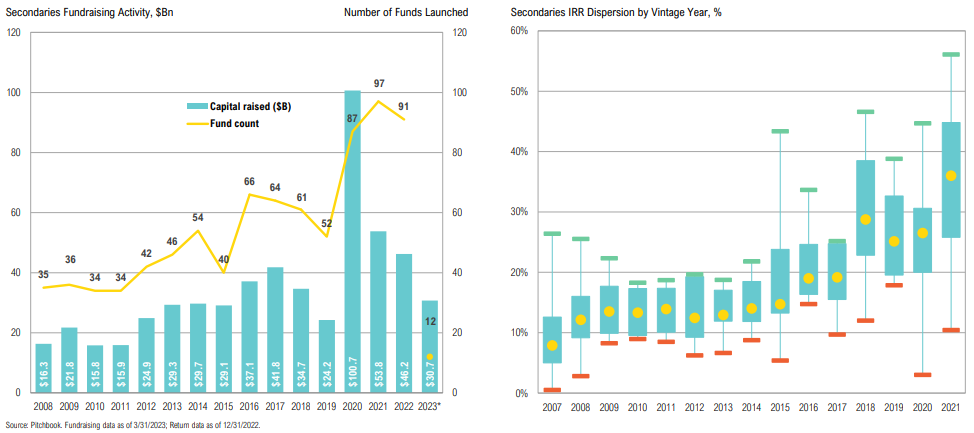
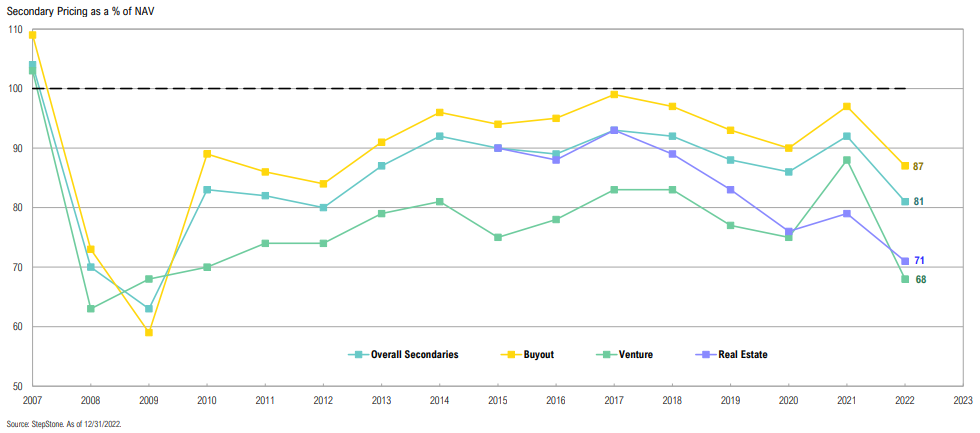
Secondaries Pricing
After record years in 2020 and 2021, secondaries fundraising fell back to its historical average in 2022
As the old saying goes: Liquidity is a coward, it disappears at the first sign of trouble.
Barton Biggs, Morgan Stanley Investment Strategist
Fixed Income & Credit
Market Returns Summary
Q2 fixed income returns were a mixed bag: Both U.S. taxable and muni bonds declined while HY bonds and bank loans posted positive returns; international developed bonds performed worst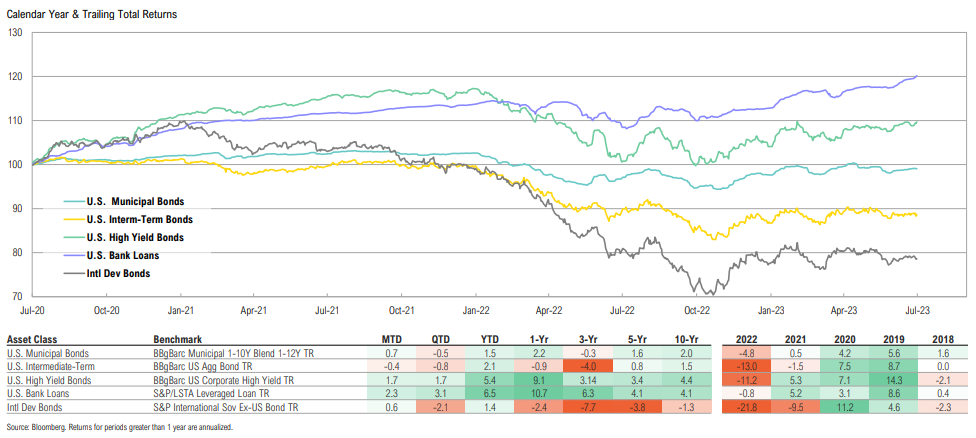
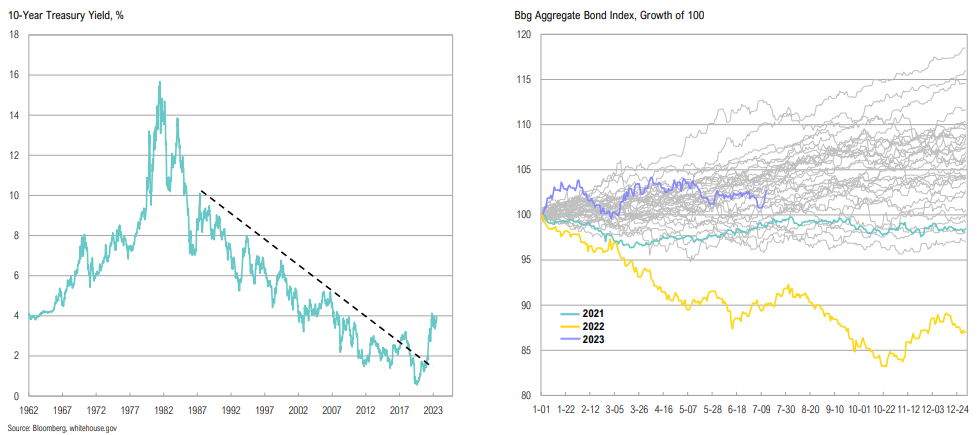
Treasury Market
Context is important for Treasury markets: while we want to be contrarian, we have to consider we’ve entered a more challenging regime for bonds
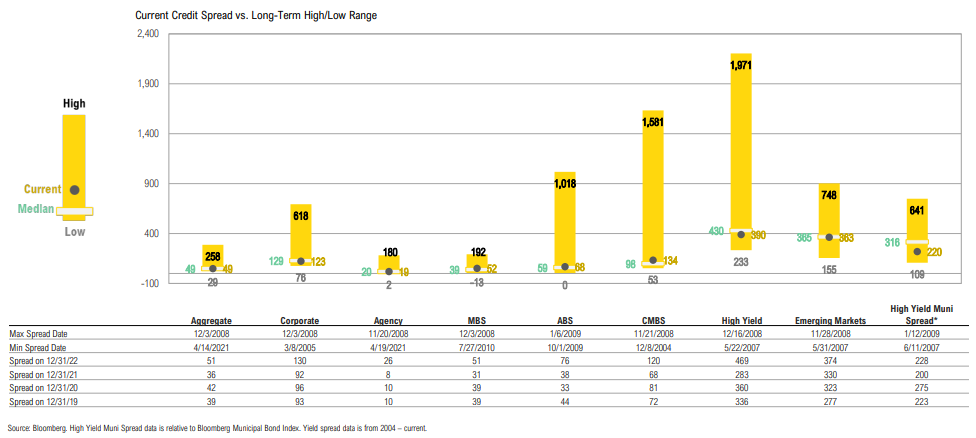
Spreads by Sector
Credit spreads are at or near average across most sectors; while a recession still seems probable based on manufacturing data, current spread levels don’t corroborate that view
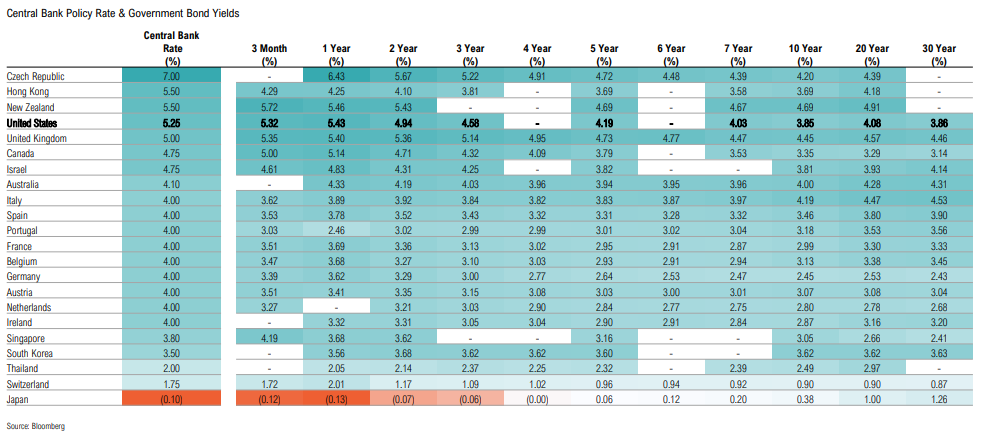
Global Rates
Last year’s U.S. dollar strength was driven by safe-haven bid and attractive relative yields, but this has been changing on the margin
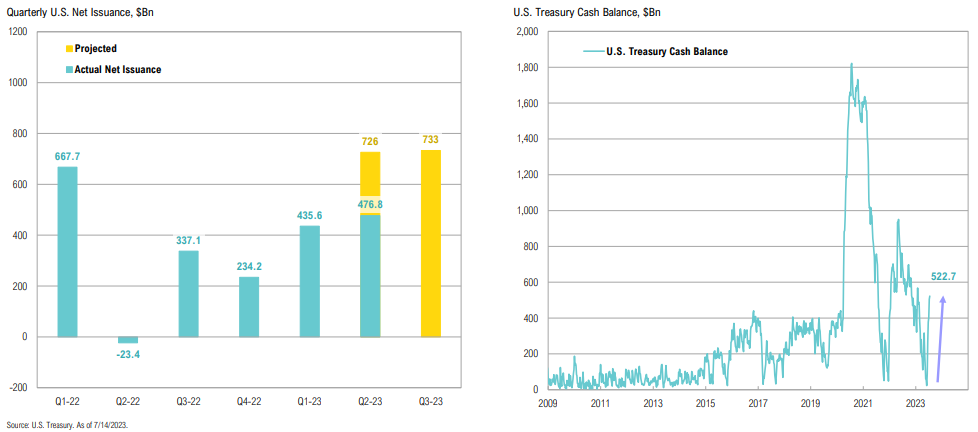
Treasury Issuance
Q2 2023 net issuance was expected to be $726Bn, but fell short due to prolonged debt ceiling negotiations; Treasury is now playing ‘catchup’ with $550bn issued in June and a further $700Bn expected in Q3
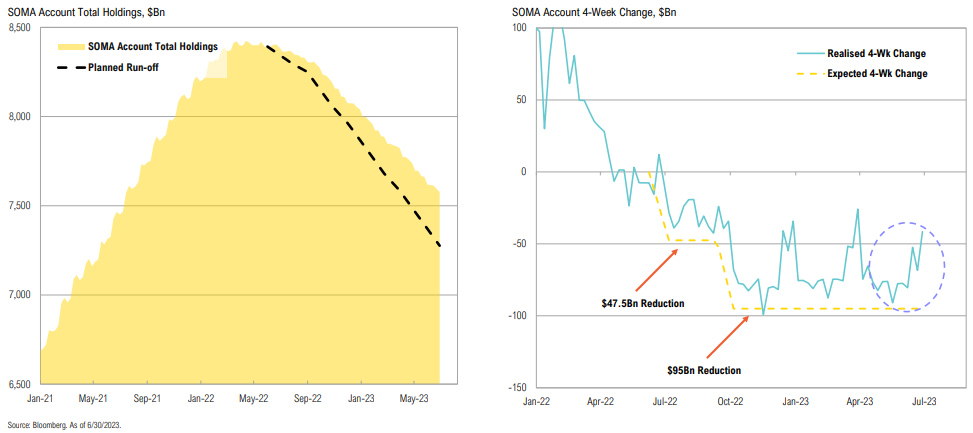
Fed Assets
The Fed slowed its balance sheet reduction in June as just $41 billion rolled off over the month, potentially due to Treasury restarting new debt issuance; SOMA account runoff is currently ‘behind’ by >$300bn
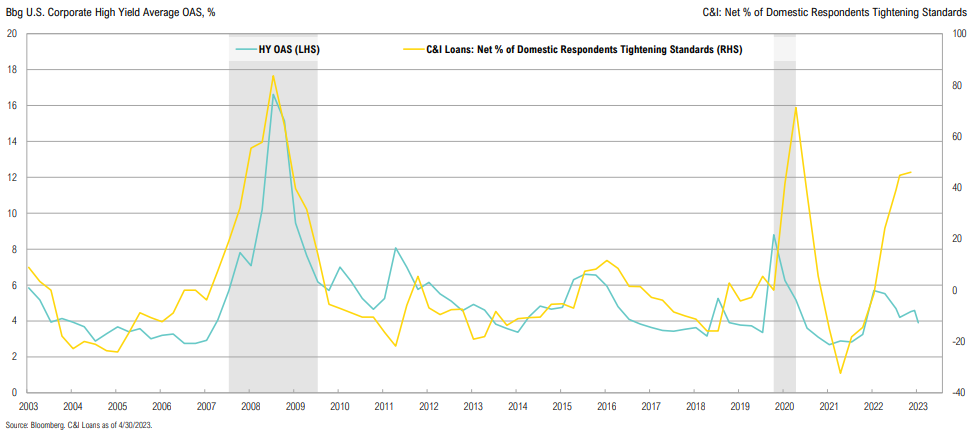
HY OAS vs. Loans
Domestic banks continue to tighten lending standards, citing liquidity concerns and lower risk tolerance; banks expect conditions to tighten further throughout the rest of the year
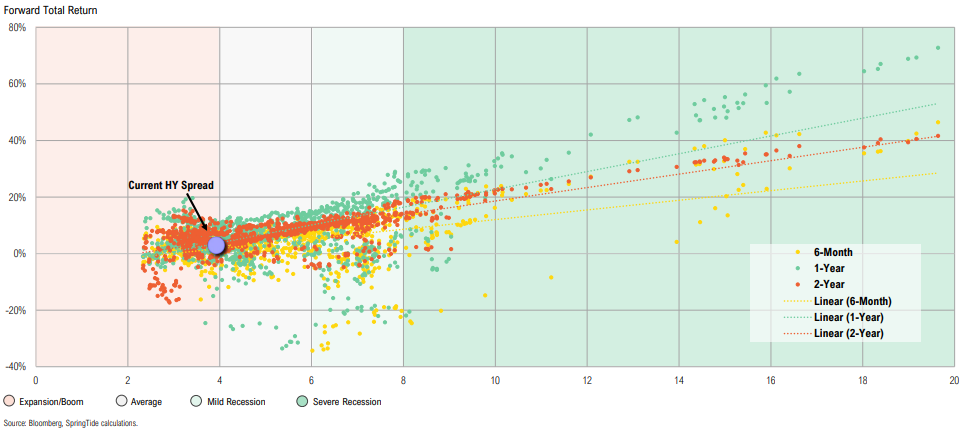
High Yield Spreads
Tranching in high yield bonds: some spread levels to consider are 6%, 8%, and 10%, with the goal to have each tranche be incrementally larger; current spread is 3.9%
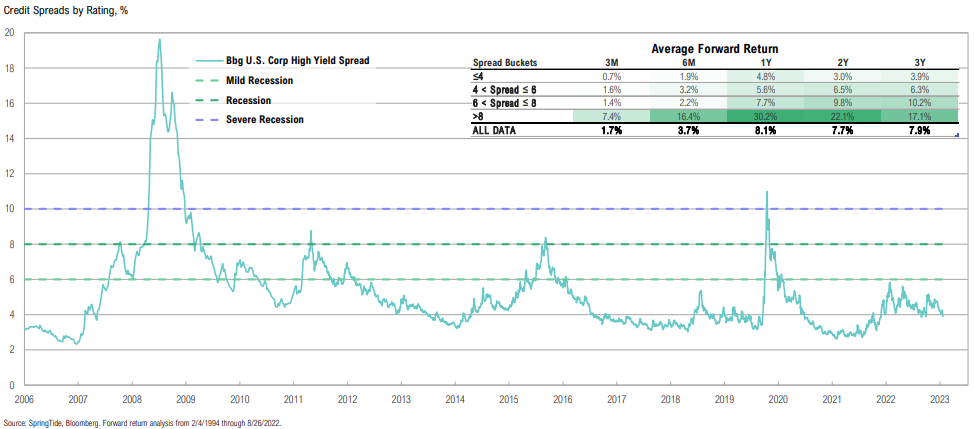
High Yield Spreads
Historically, high yield spreads above 6% have resulted in above-average forward returns; high yield spread is currently trading at a middling 4.0%
I thought real estate was the falling knife. Last I checked, the knife was still falling. I may think I’m smart and I may think I am surrounded by a very talented team, but I don’t know that they’re very good at catching knives, nor do I know anybody who is.
Sam Zell, American Investor
Real Assets
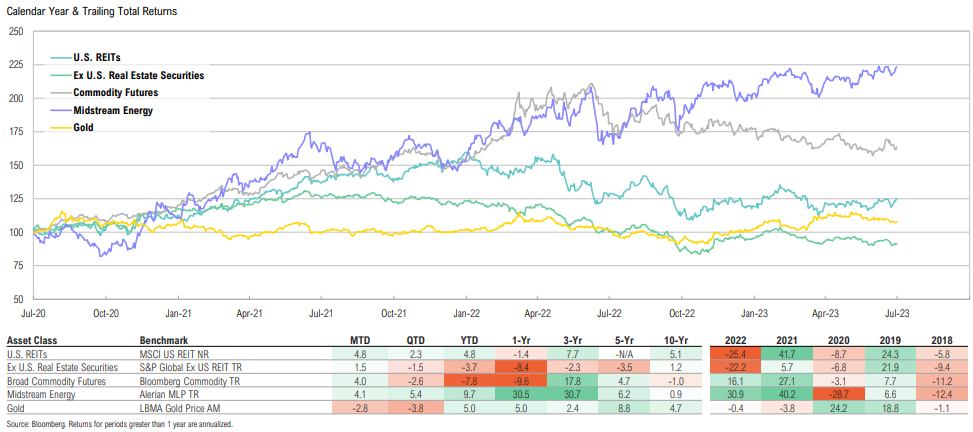
Market Returns Summary
Gold continued its recent correction, declining 3.8% over the quarter; despite weaker oil prices, midstream energy posted another positive quarter, adding 5.4% to its respectable YTD performance
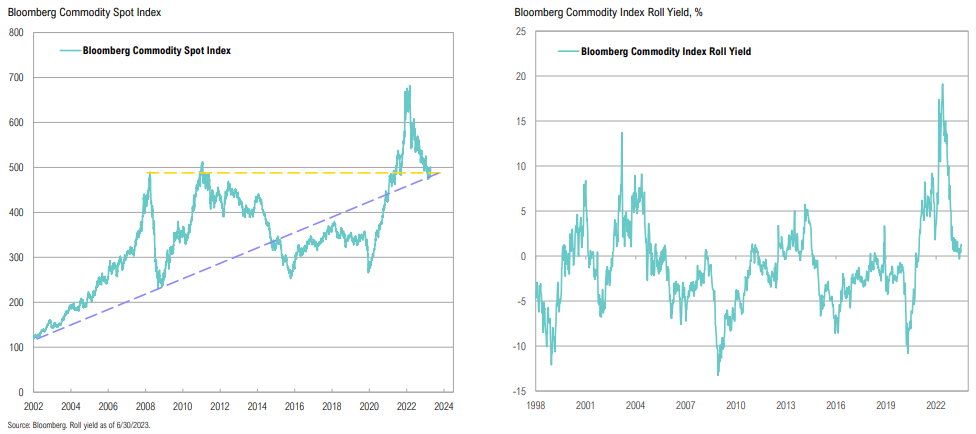
Commodities
Commodity roll yields have dropped sharply, currently at 1.3%, largely due to natural gas futures shifting back to contango, suggesting global commodity markets have loosened; crude remains in backwardation
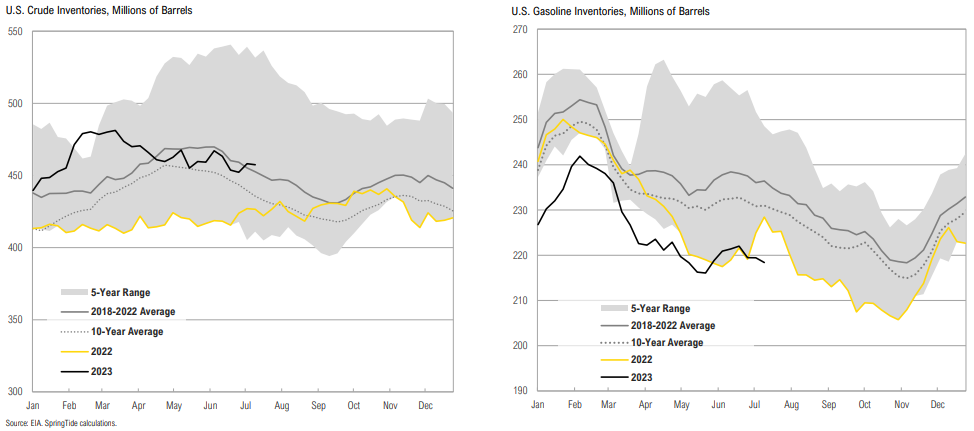
Inventories
Crude has started to rebuild inventory, and is now just above the 5-year average; gasoline inventories are still well below historical average levels
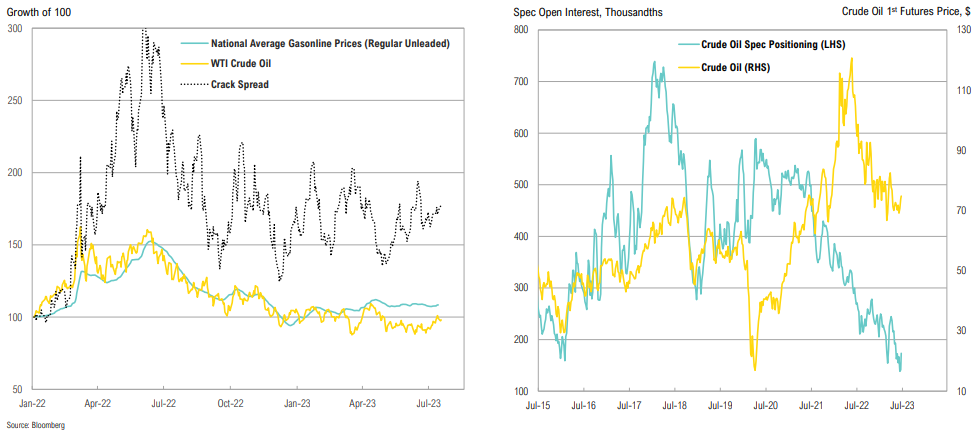
Gas Prices
Crack spreads remain elevated despite lower oil prices, signaling continued constrained refinery capacity; YoY gas prices likely bottomed in June and may start contributing to headline inflation by Q4
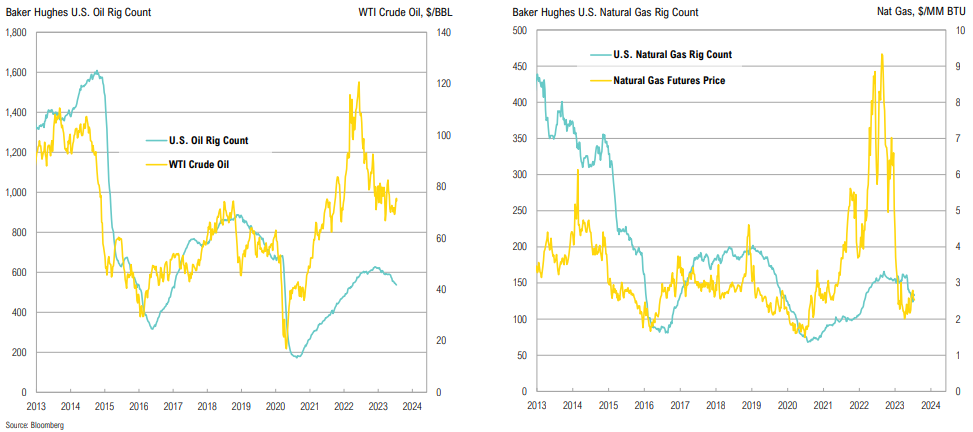
Oil & Natural Gas
Oil and natural gas rig counts continued to decline over the quarter as uncertainty continues; U.S. oil rig counts are down 14% from 2022 peaks, Nat Gas rigs are down 20%
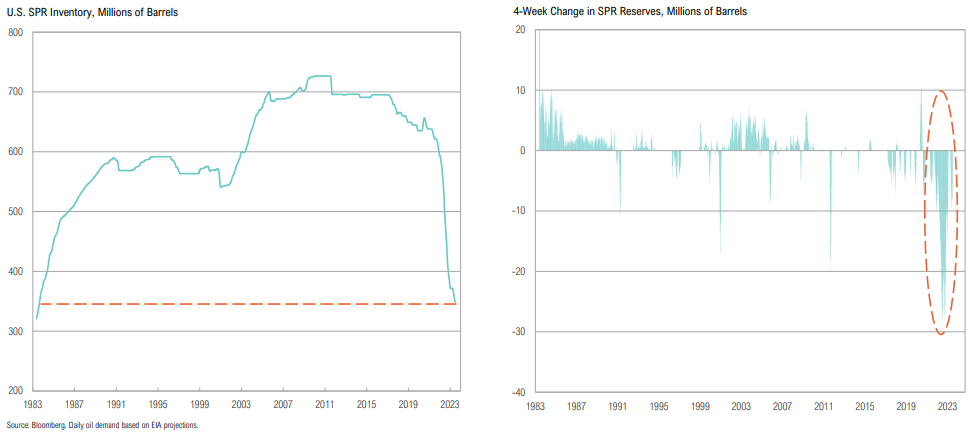
SPR
More than 275 mn barrels have been released from the SPR over the past two years and SPR levels are now at the lowest since August 1983; the DoE announced a 6 mn barrel replenishment in August
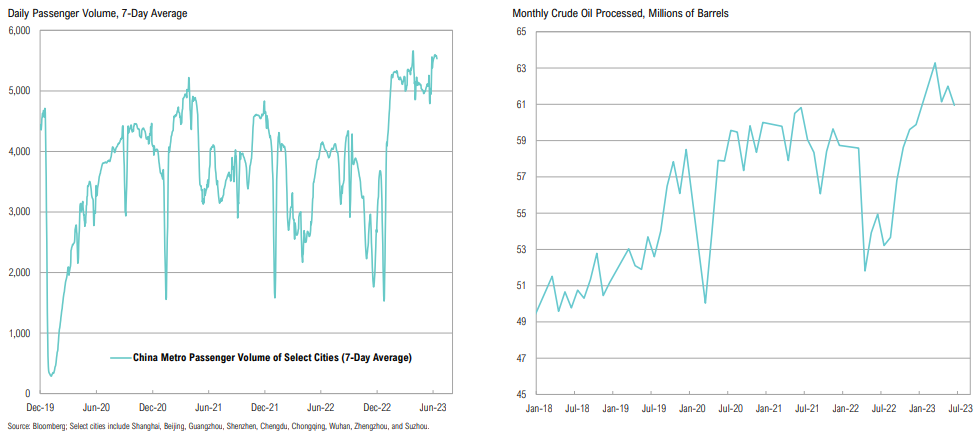
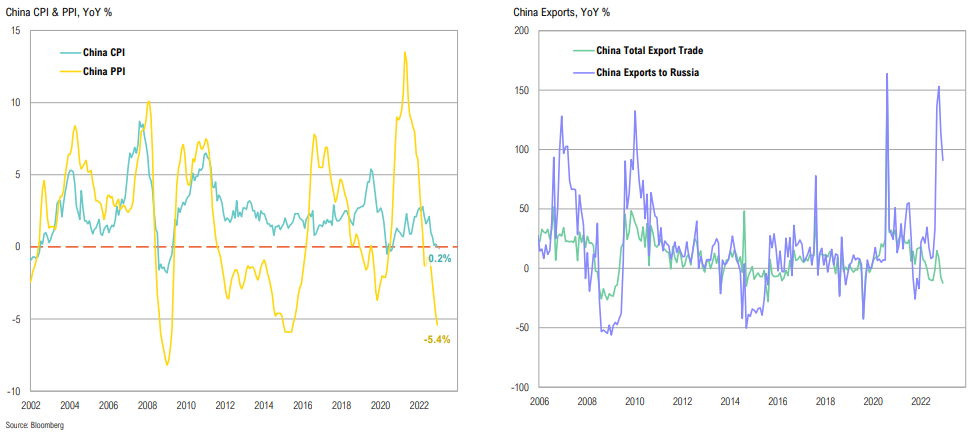
China
There are signs that mobility in China is normalizing; however, we are keeping an eye on Chinese crude processing, which has dropped from March’s record high levels
China’s recovery is faltering: CPI and PPI near deflation; exports dropped by 12.4% YoY in June to the lowest levels since 2016—exports to Russia remain elevated, but have been slowing
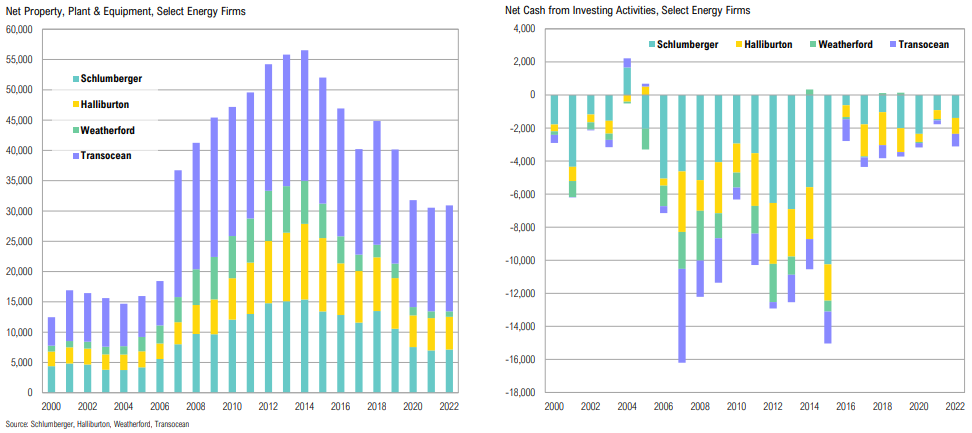
Oil CAPEX
Since COVID, drilling capex levels have been near the bottom of a 65-year range
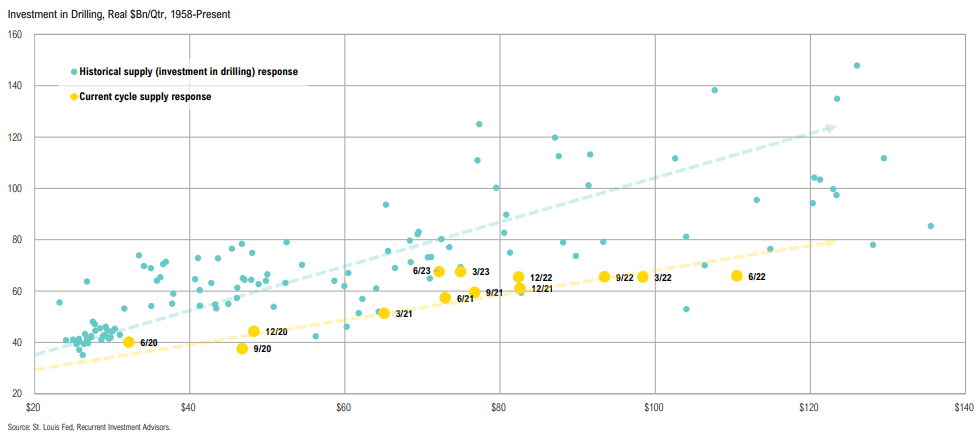
Energy firms have decreased investment from 2008-2018 levels
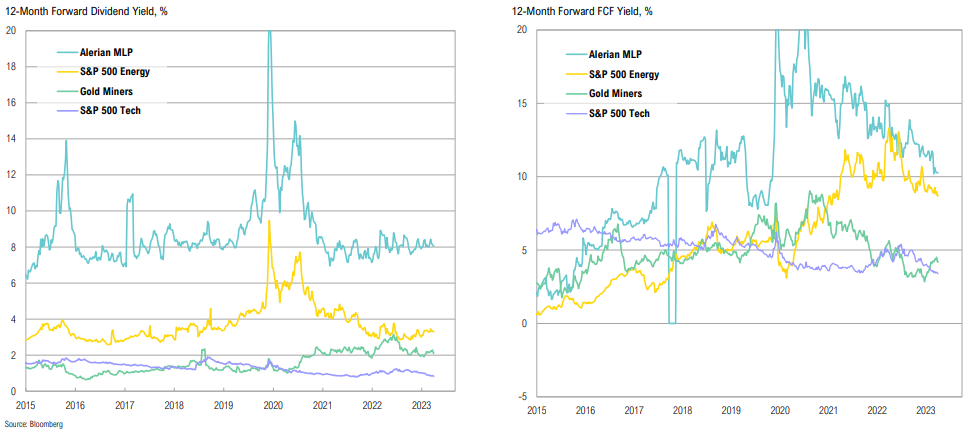
Yields
Midstream distribution yields trended lower as the sector broke out to upside but has seemingly stabilized around an attractive 8%; free cash flow yields of the energy sector have declined
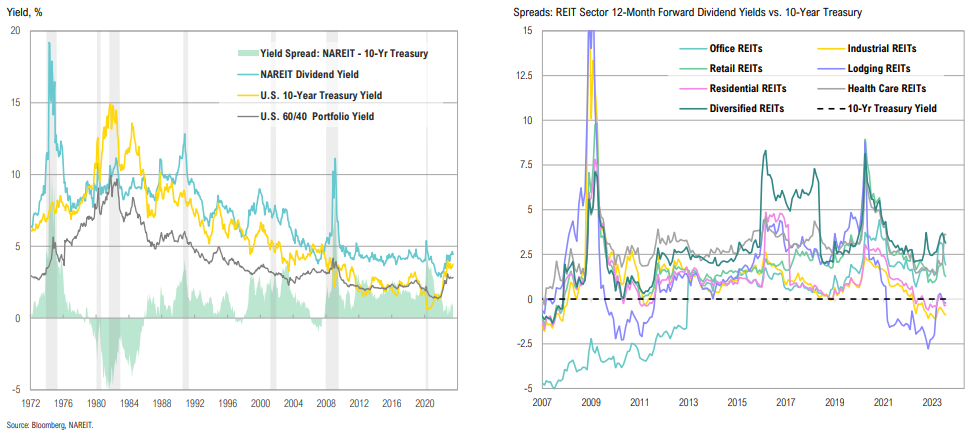
REITs
U.S. REITs have rallied 18% off 2022 lows, but still look wholly unattractive on a relative yield basis, despite looking more attractive on an absolute basis
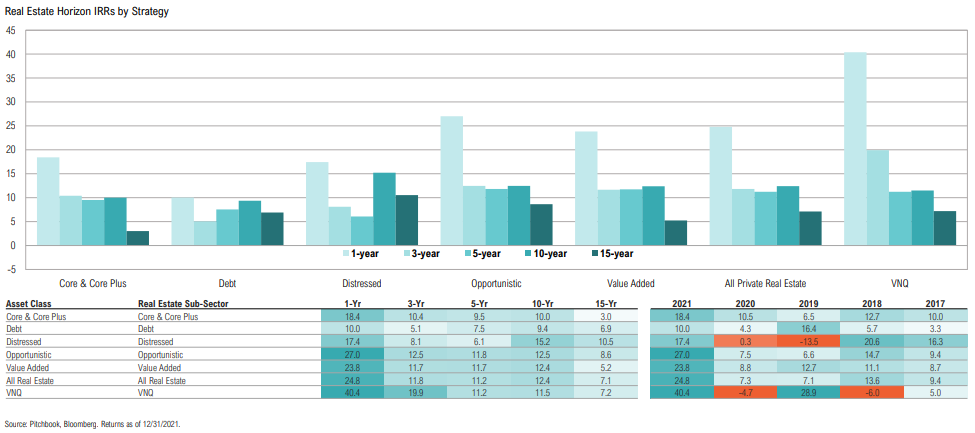
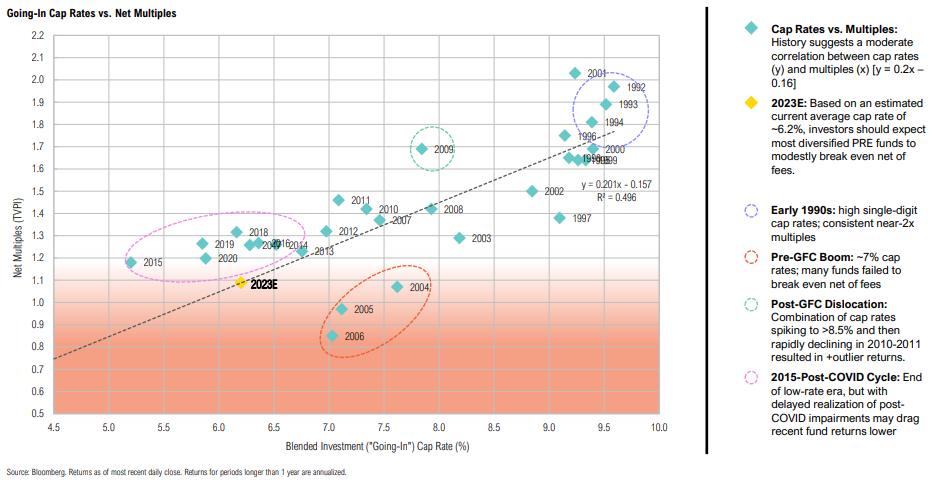
PRE Performance
PRE: Longer-term (lagged) returns for various private real estate markets show the impact of going-in cap rates on subsequent returns
PRE Valuations & Multiples
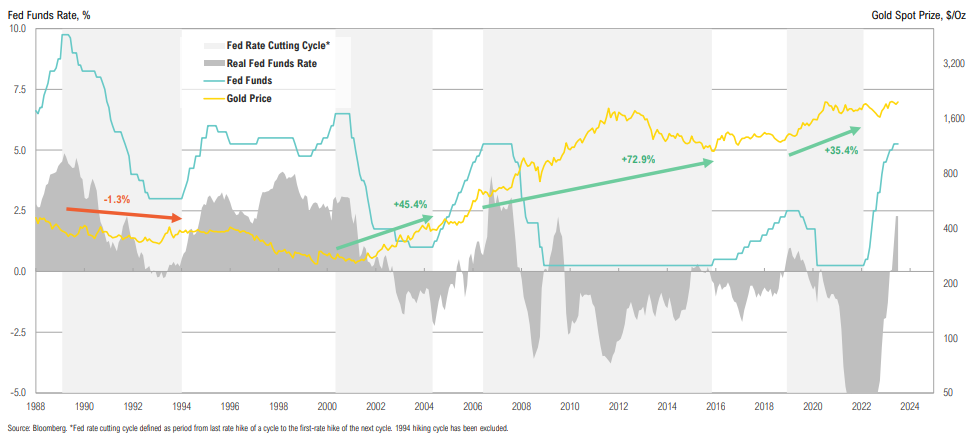
Gold vs. Fed Funds
Since the turn of the century, the end of hiking cycles has been positive for gold; this may be due to lower opportunity costs (falling real rates)
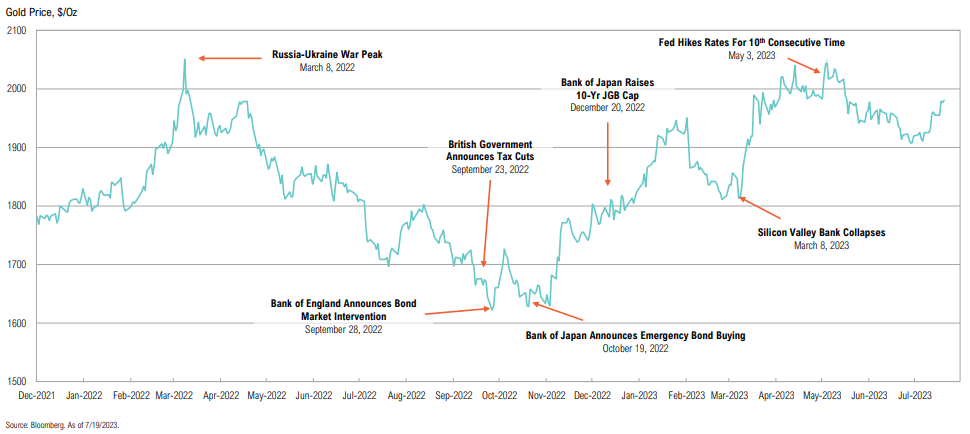
Gold
Gold continues to trade at elevated levels and is starting to behave more favorably as a financial crisis and fiat currency hedge
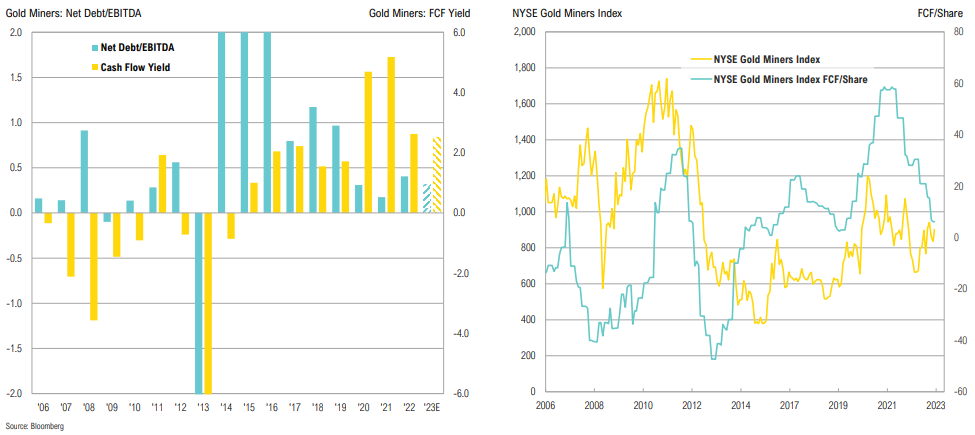
Gold Miner Fundamentals
Gold miners have rallied 50% from Sept ‘22 lows, but have sold off modestly in recent months on weaker spot prices; increasing operating costs remains a key risk for miners
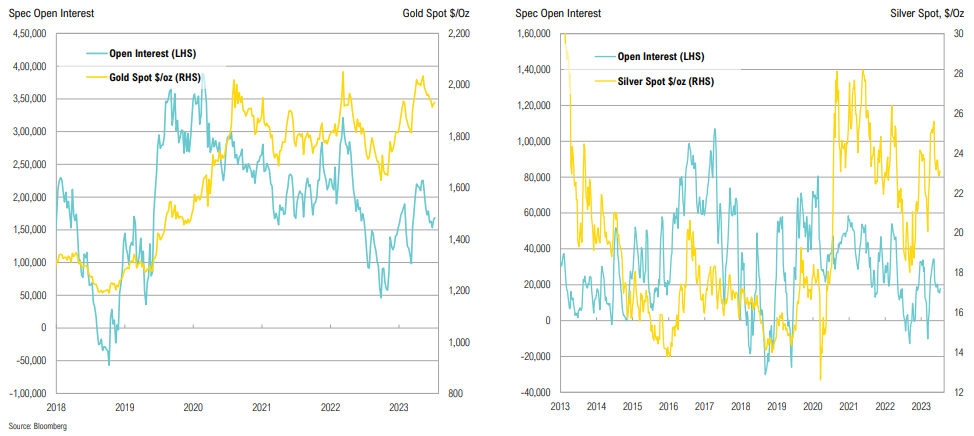
Gold Futures Positioning
Spec positioning in gold futures has pulled back modestly since May with spot prices declining; positive trend of prices and positioning since Sept. ’22 remains, but there are currently no strong signals
Volatility is a dear friend of the active, patient, value-sensitive investor.
David Rolfe, American Investor
Opportunistic
Market Returns Summary
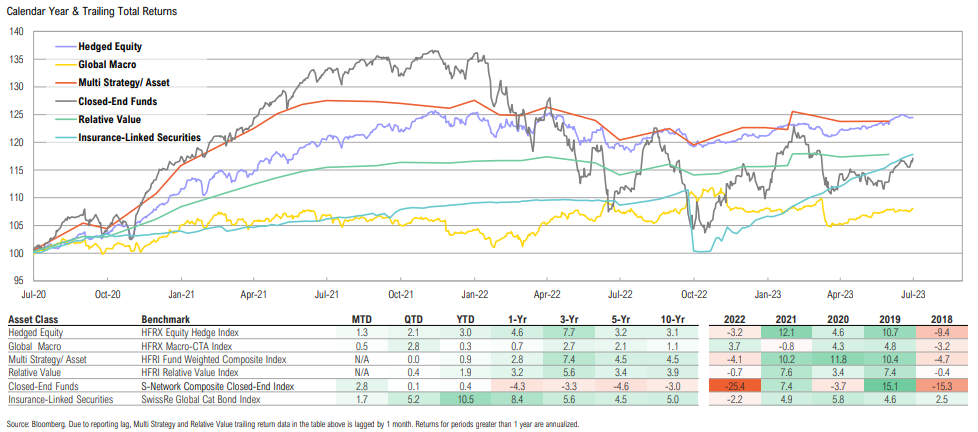
Insurance-linked securities were again the top-performing opportunistic asset class over the quarter, up 5.2%, while closed-end funds continued to stall, up just 0.1%
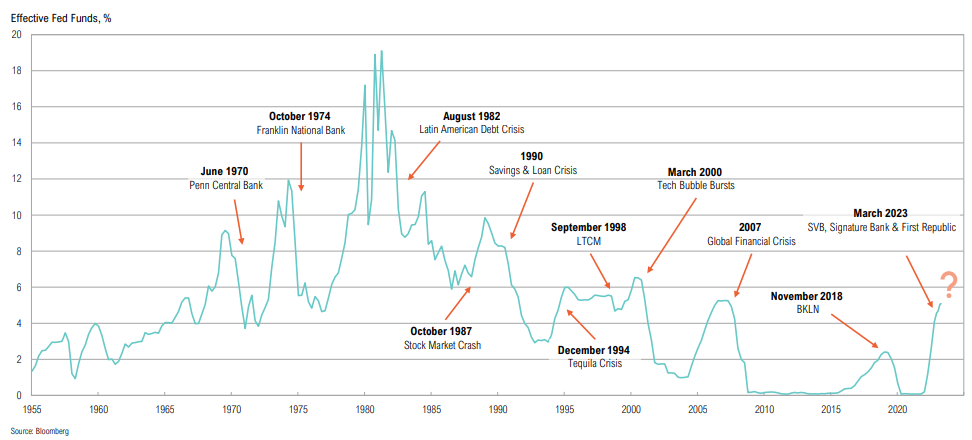
Rate Hike History
“Hike until something breaks” is typically how cycles play out
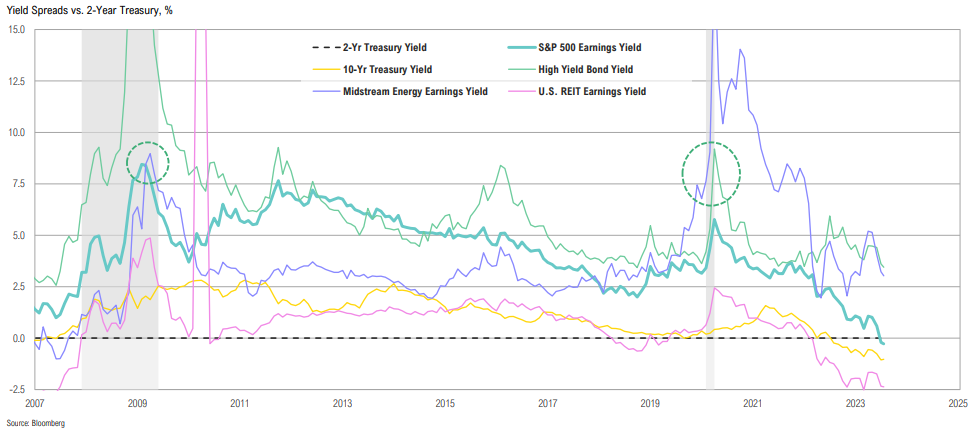
Yield Spreads
Most asset classes don’t look attractive relative to the 2-year Treasury yield; spreads have some way to go if past recessions are at all indicative
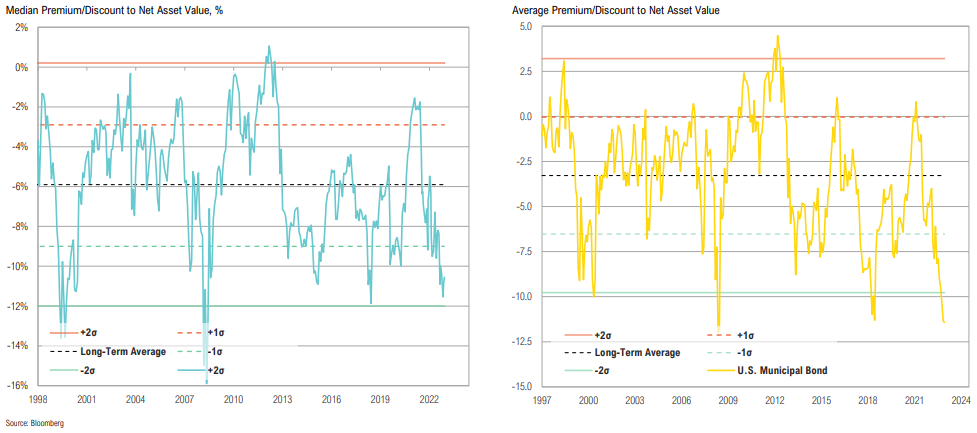
CEF Discounts
CEF discounts narrowed over the quarter and are currently at -10.8%; U.S. muni bond funds have seen discounts widen further, with an average sector discount of -11.4%, near record levels
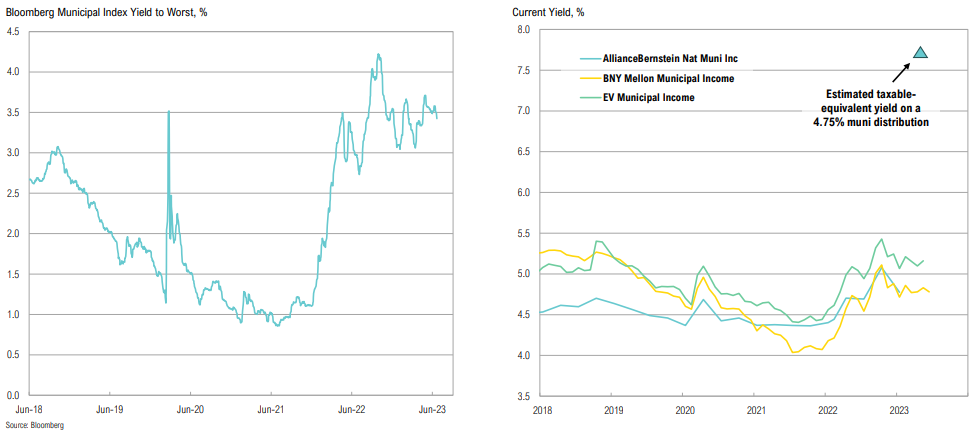
Muni CEF Yields
While discounts are compelling, fund cash flows (and distribution yields) have been hurt by increased leverage costs
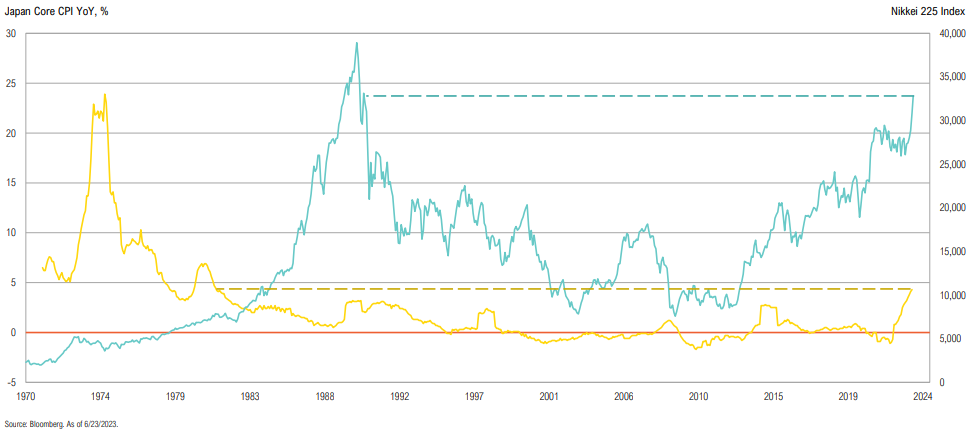
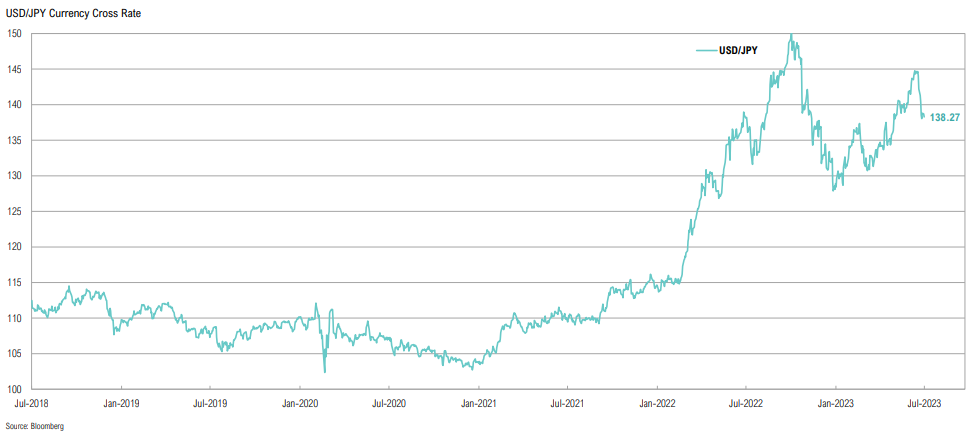
Japan
Japan’s core CPI is at the highest level since 1981 and the Nikkei Index is up 25% YTD, near levels last seen in 1990; BoJ Governor Ueda adamantly sticks to policy
10-Year JGBs seem to have been behaving better since the start of the new BoJ governor Ueda in April; have been below YCC level of 0.5 since mid-March
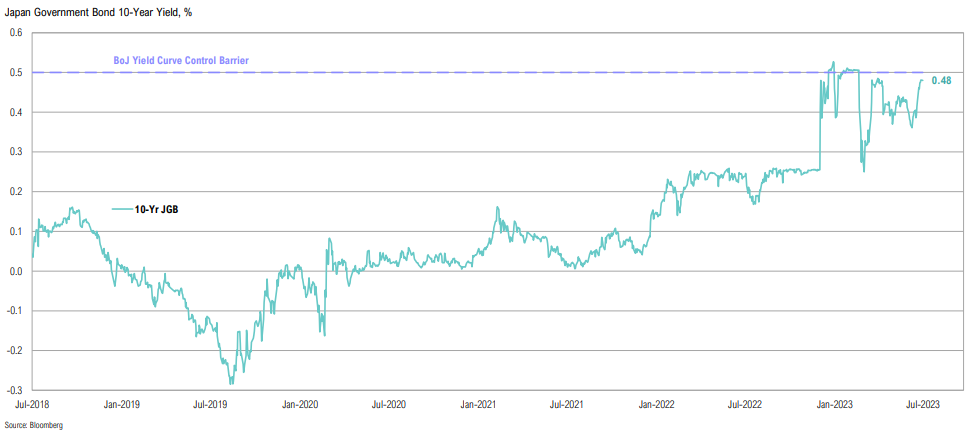
After hitting a YTD high of 144.76 yen, the USD/JPY retracted back to below 140; focus shifts to future Fed rate hikes and BoJ’s unwavering policy stance
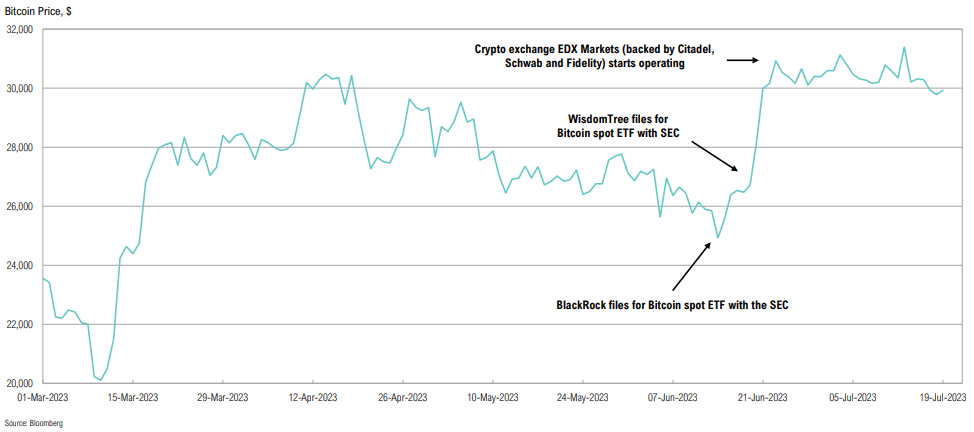
Bitcoin
It’s been busy in the crypto-verse: BLK filed an application for a Bitcoin spot ETF with the SEC, and a new crypto exchange launched; Bitcoin is up 19% since BLK filing
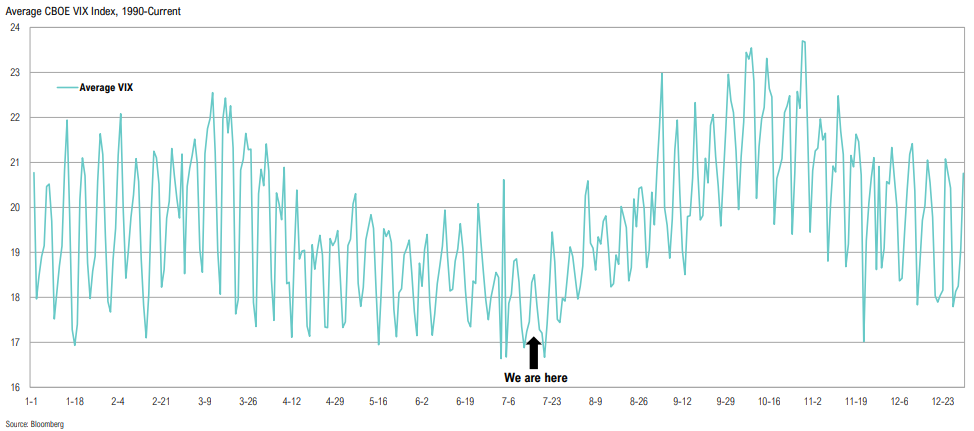
VIX
On average, the VIX tends to bottom around this time of the year, with the back half of July generally being the low point and volatility increasing into the fall
VIX vs. MOVE
The implied bond market volatility (MOVE) isn’t showing the same level of composure as equities (VIX); it is unlikely that both markets are correct

Usually, it takes events. It takes something happening that creates an opportunity.
Sam Zell, American Investor
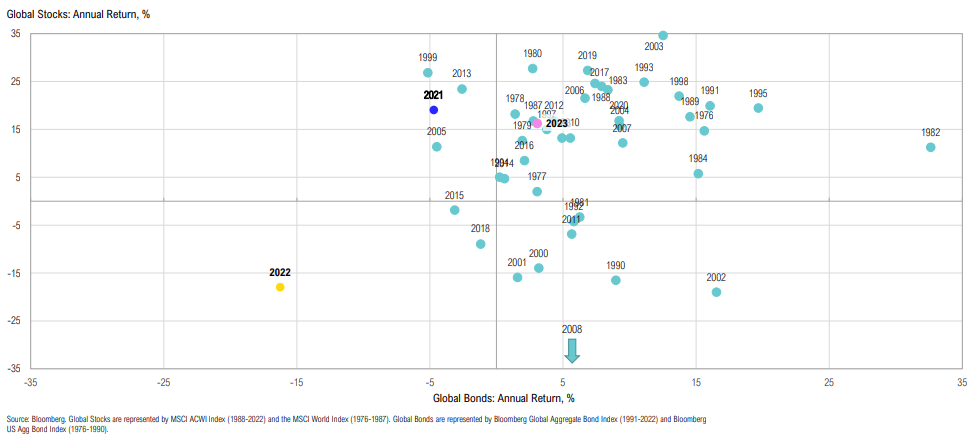
Asset Allocation
2021 was an unusual year for global stocks and bonds, 2022 even more so; 2023 is off to a great start
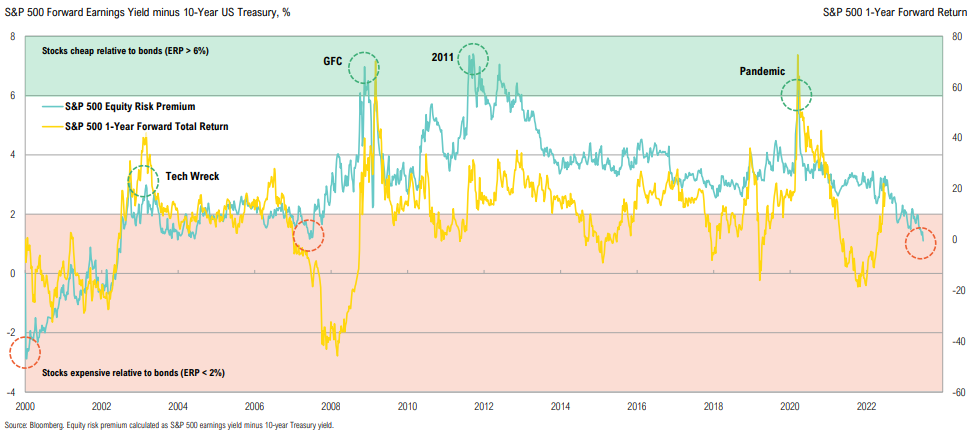
S&P 500 Equity Risk Premium
Despite stocks being well below all-time highs, stocks are less attractively priced vis-à-vis bonds than they were a year ago; in fact, the relative yield on stocks hasn’t been this low since the GFC
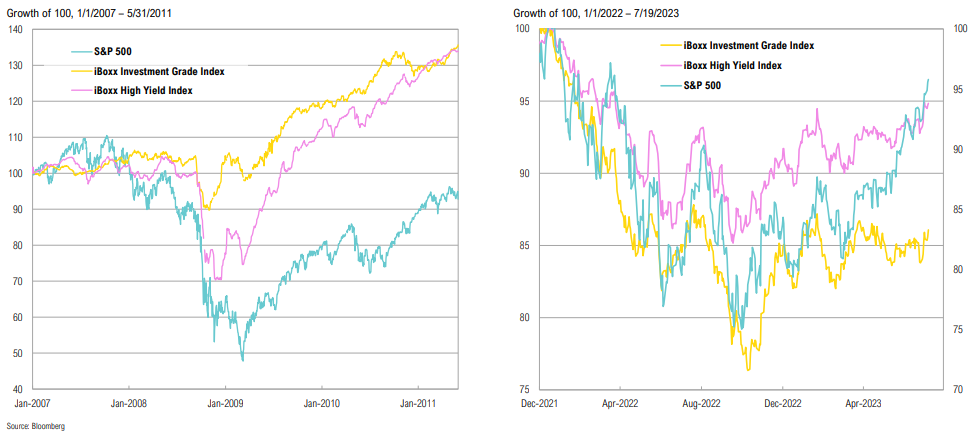
Credit vs. Equity
Can equities “wag the dog”? Credit tends to lead equities on the way out of bear markets; while there’s been a very constructive narrowing of IG and HY spreads recently, equities have decoupled
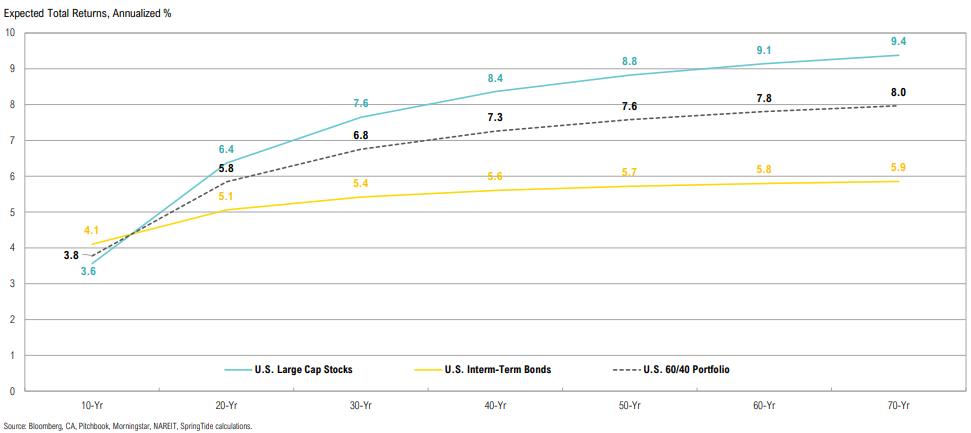
CMEs (As of 6/30/2023)
Expected 10-year returns for bonds rose with yields; expected return differential between small and large cap U.S. stocks is now 3%
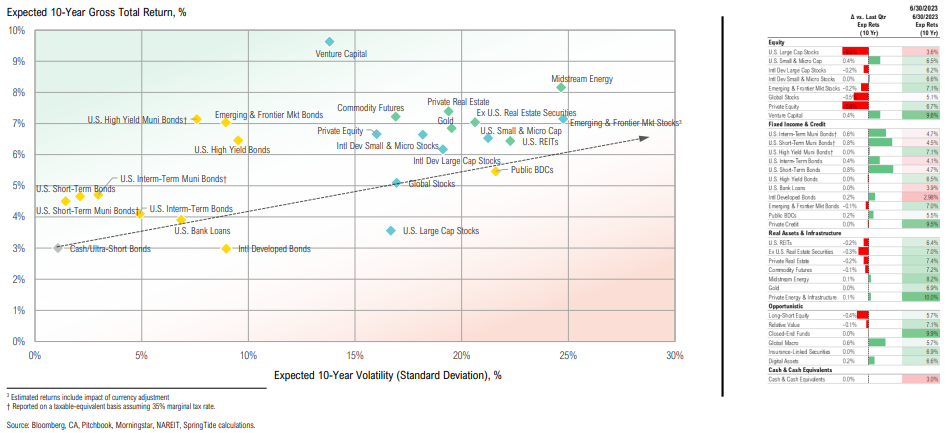
CMEs (As of 6/30/2023)
Fixed income returns are now expected to outperform U.S. large cap stocks over 10 years (pre-inflation, which is big unknown)