For much of the decade leading up to COVID-19, a combination of excellent profitability and some of the least volatile economic conditions in history implied that the U.S. stock market would trade at substantially higher valuations than long-term averages. But now, with economic growth much more volatile and inflation farther from the market’s 2% happy place than we have seen in 40 years, things suddenly look far less comfortable for investors.
– Matt Kadnar, GMO , July 2022
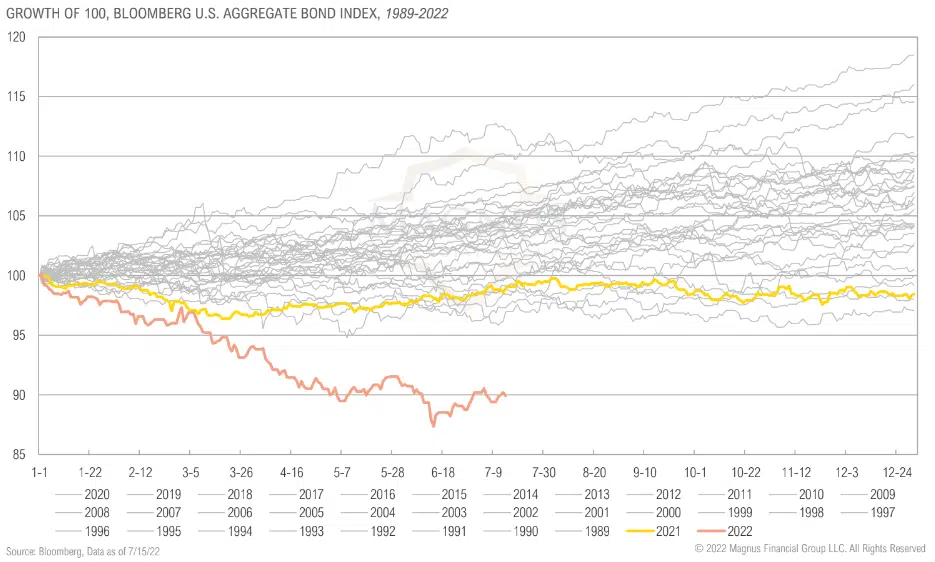
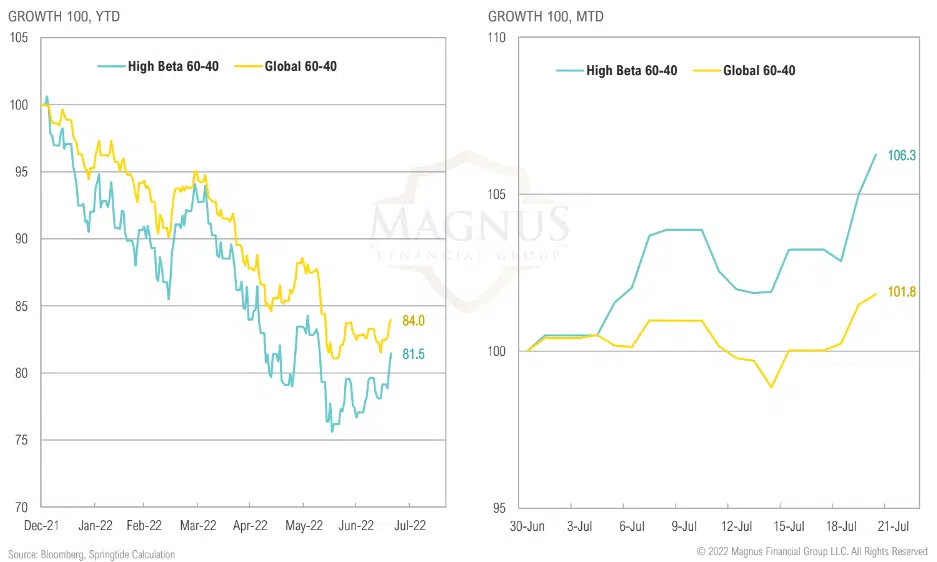
The late, great artist formerly known as Prince released “When Doves Cry” in 1984, and it ultimately spent five weeks as the number-one hit song in the U.S. In the song, he writes, “How can you just leave me standing? Alone in a world that’s so cold? Maybe I’m just too demanding.” In what has been an incredibly challenging year for capital markets, Prince’s lyrics eerily echo the mood of many investors. After benefiting from a 40-year decline in interest rates, capped off by far-above-average gains of 17.8% per year for a traditional “60/40” portfolio (60% U.S. stocks/40% U.S. bonds) for the three years ending December 2021, investors are now faced with the harsh reality of inflation and the terrible toll it takes on the value of financial assets.
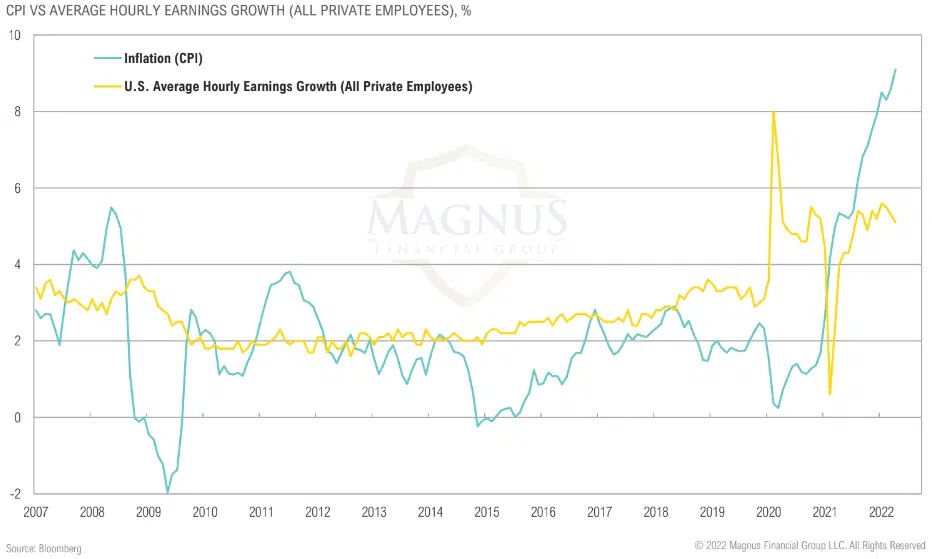
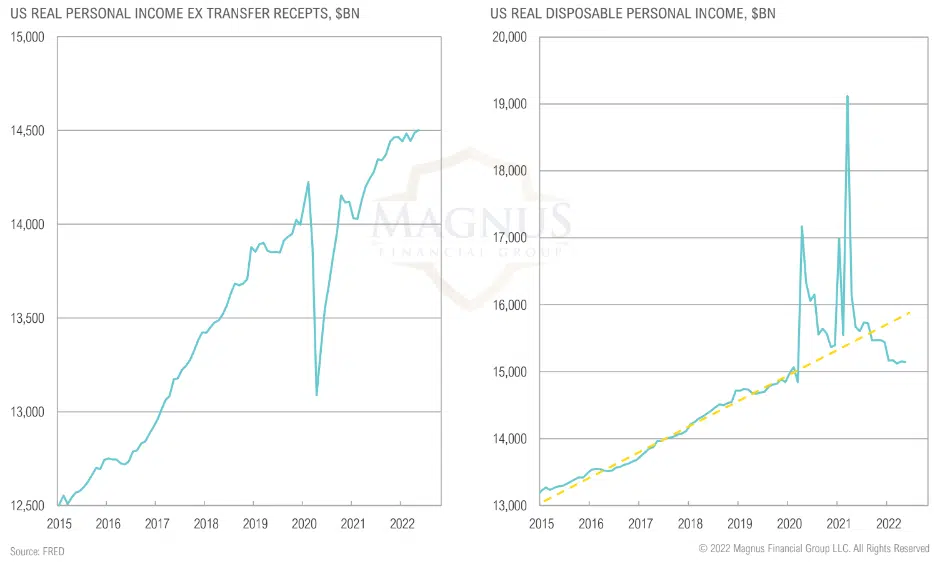
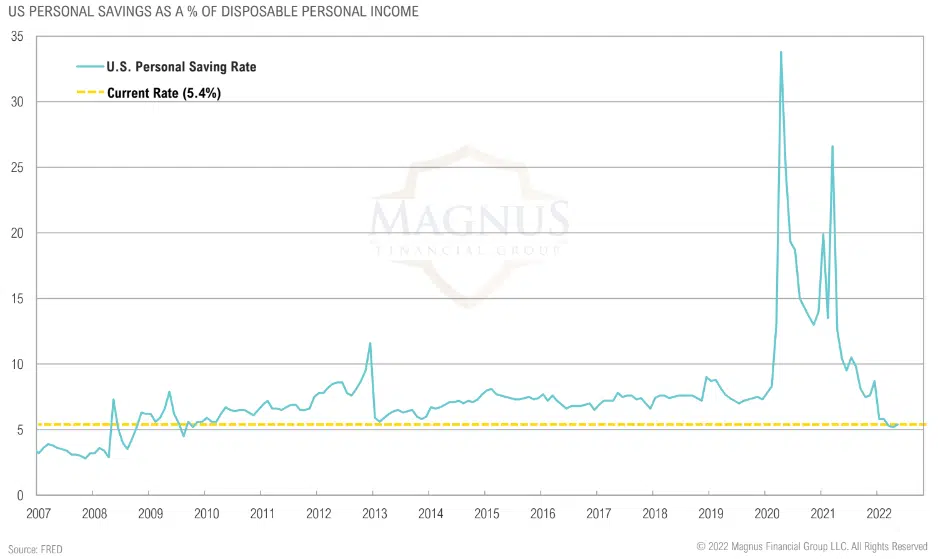
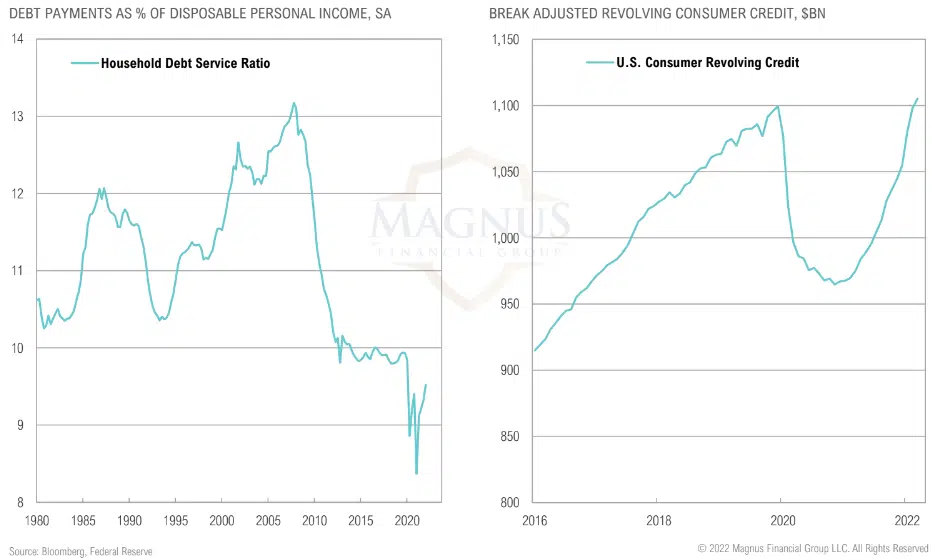
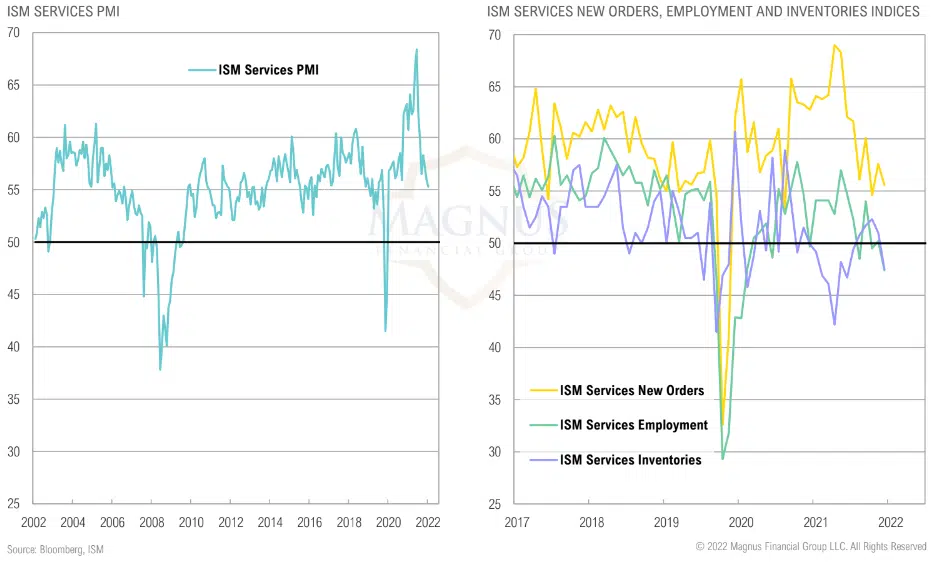
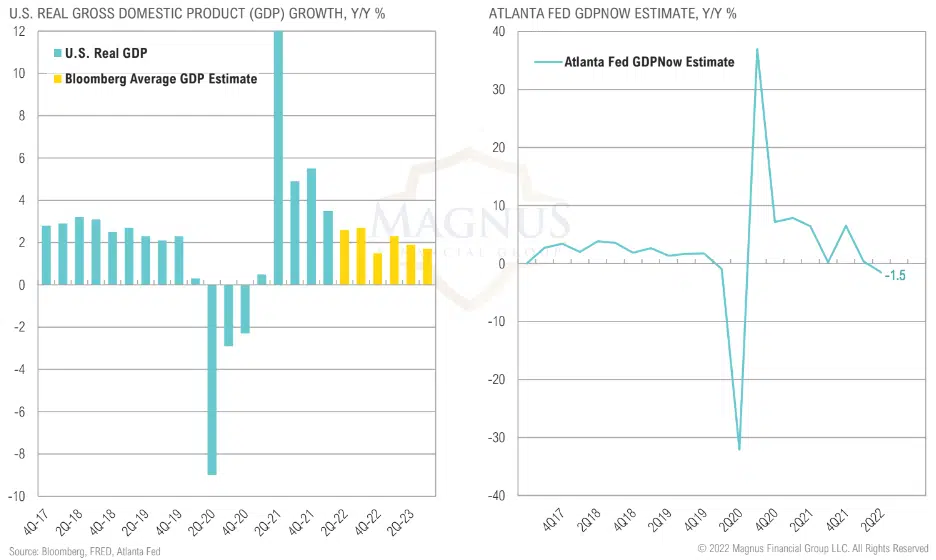
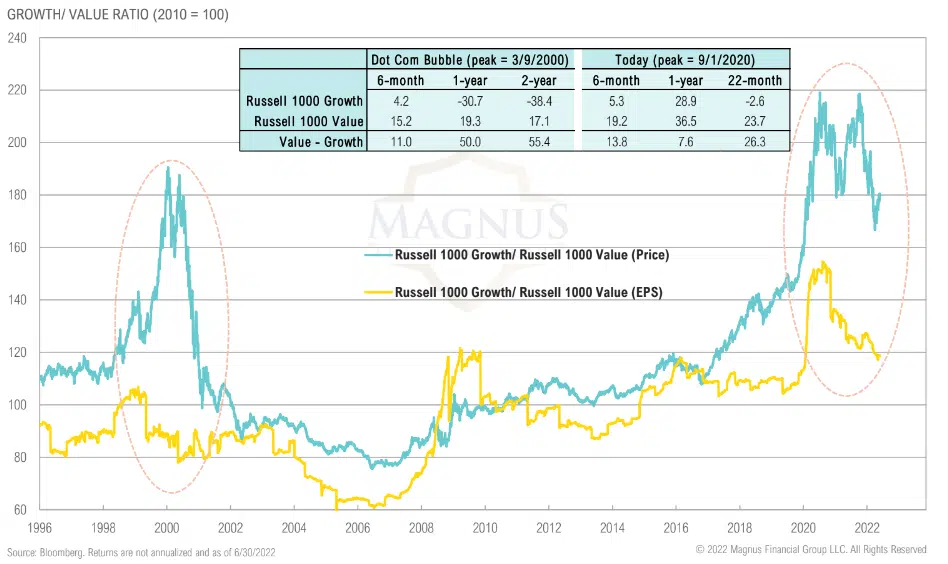
It’s not only that investors may have been too demanding, but the pivot by the Fed from one extreme to the other has exacerbated the situation, taking markets from “party like it’s 1999” to being “left in a world so cold.” By any standard, the first half of 2022 has been extremely difficult for markets. Both stocks and bonds suffered historic concurrent drawdowns. Today, stocks are in a bear market, and the economy is clearly slowing. In the most recent GDPNow projections released by the Atlanta Fed, second-quarter GDP growth is expected to come in at -1.2%. This comes on the heels of the first-quarter GDP growth of -1.6%. Real personal consumption expenditures have also slowed to 2.1% year-over-year amid signs that consumers are starting to overextend themselves. Revolving consumer credit increased at an annual rate of 19.6% to an all-time high at the end of April (the most recent data available). It appears that consumers, squeezed by higher prices, are stretching to fund even their reduced spending levels. Wage gains are not keeping pace with inflation; real wage growth dropped to a new low of -3.9% in May relative to the year prior.
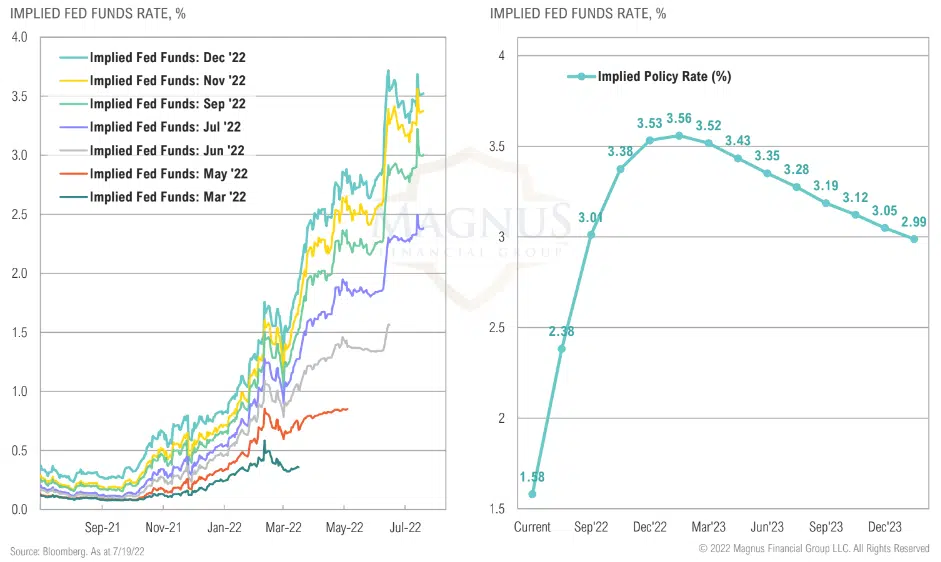
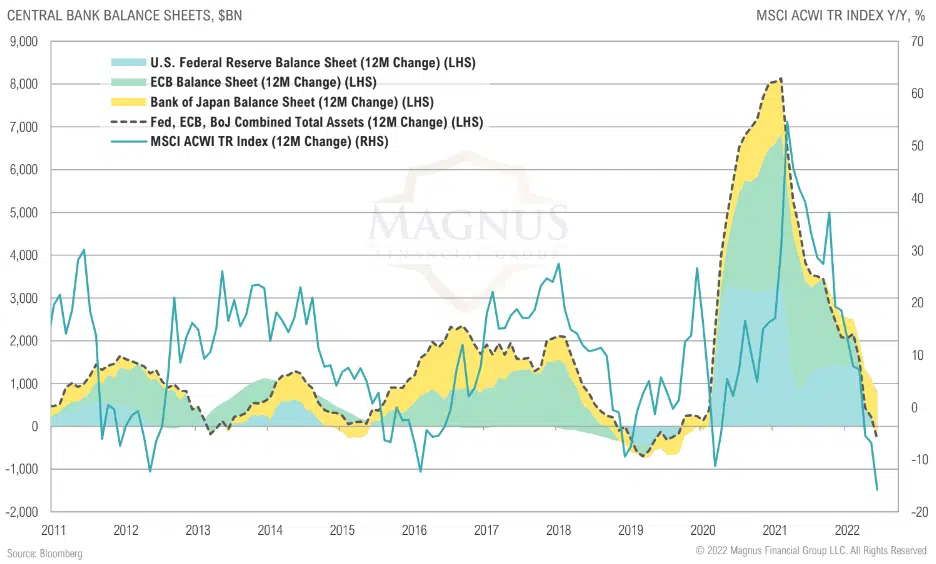
The Fed has just begun the process of withdrawing its unusually accommodative monetary policy over the past 13 years. It is attempting to slow demand, cool the red-hot labor market, and hopefully reduce inflation. Recent economic developments suggest the odds of a “soft landing”—a scenario where the Fed is able to cool the market just enough to stop inflation without doing harm to the economy—are too low to bet capital on. As a result, we think investors should still err on the side of patience when it comes to deploying capital. Although stocks and bonds are meaningfully below their record highs, the policy goosed prices of the past few years may have anchored investors to unsustainable levels of economic activity and market prices. In order to get more comfortable deploying more risk in stocks, we would like to see more compelling valuations (lower prices) or enough evidence of a material improvement in the inflation backdrop that would suggest an imminent pivot in monetary policy.
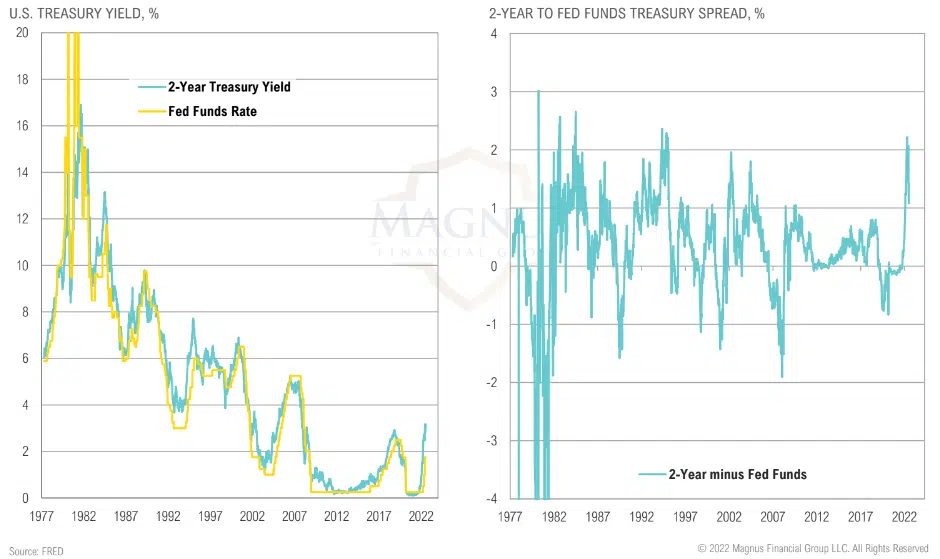
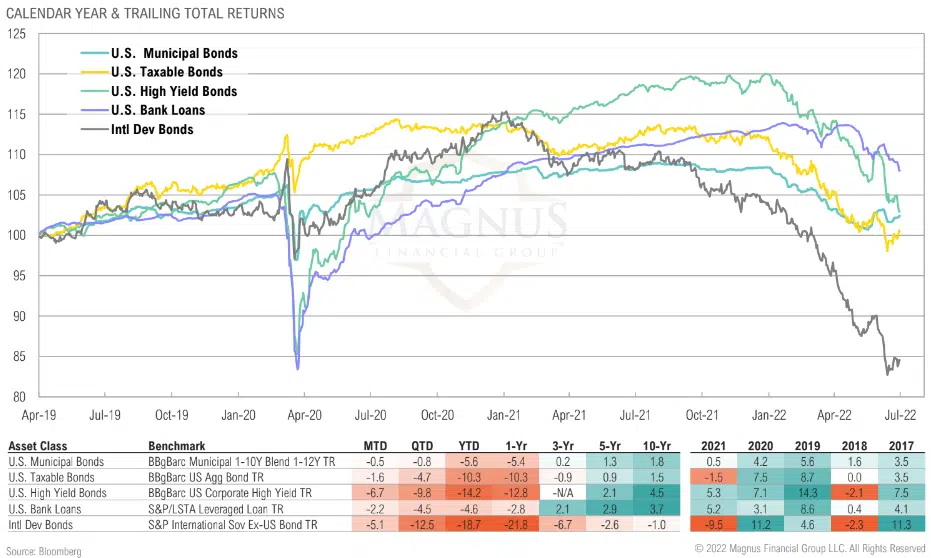
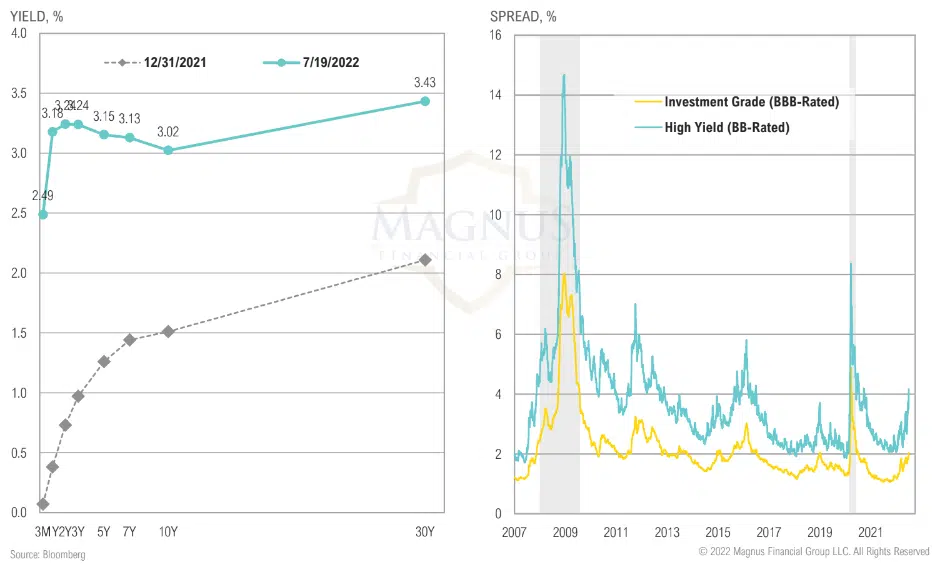
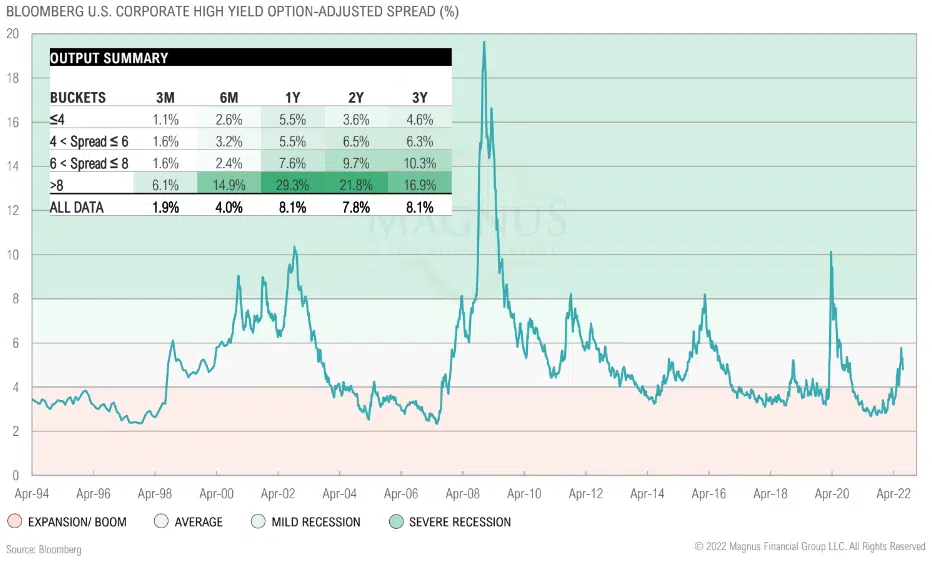
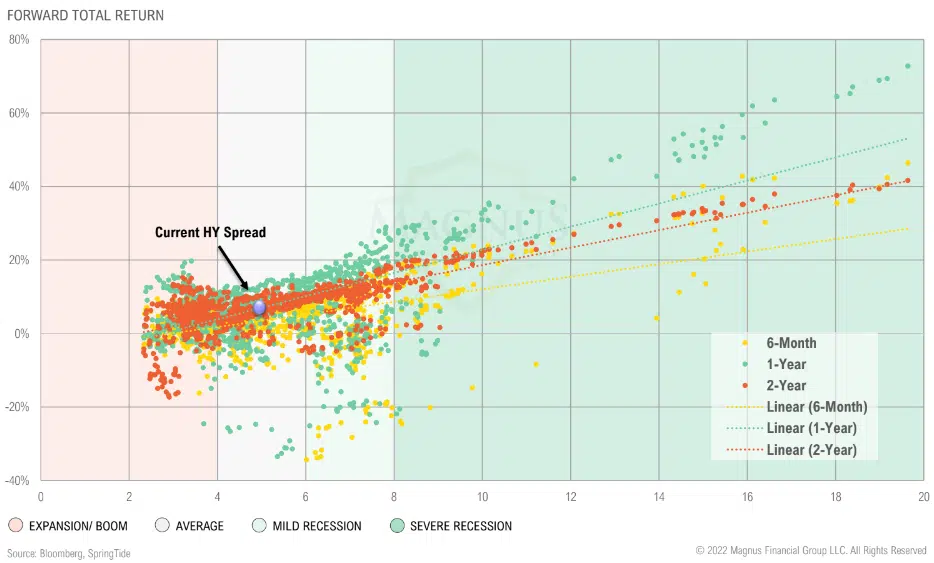
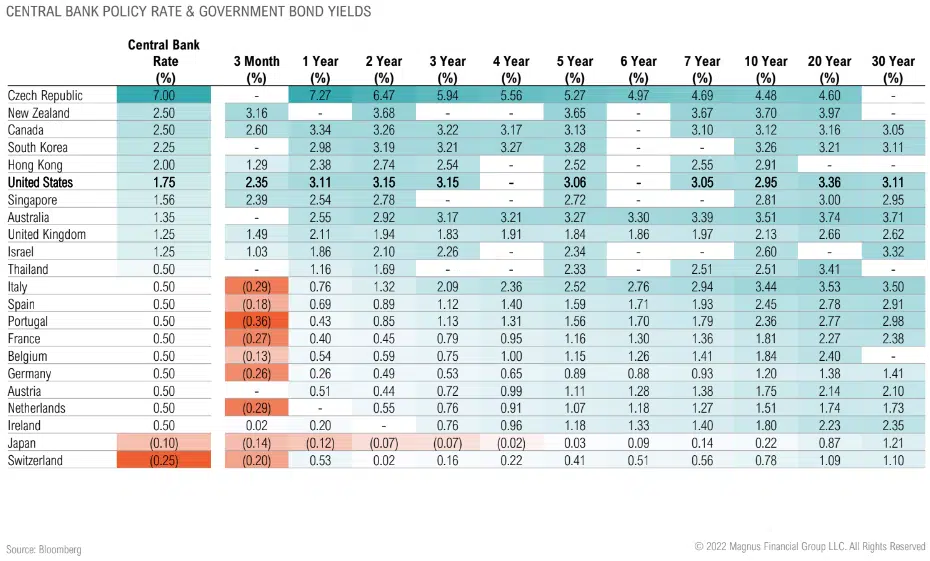
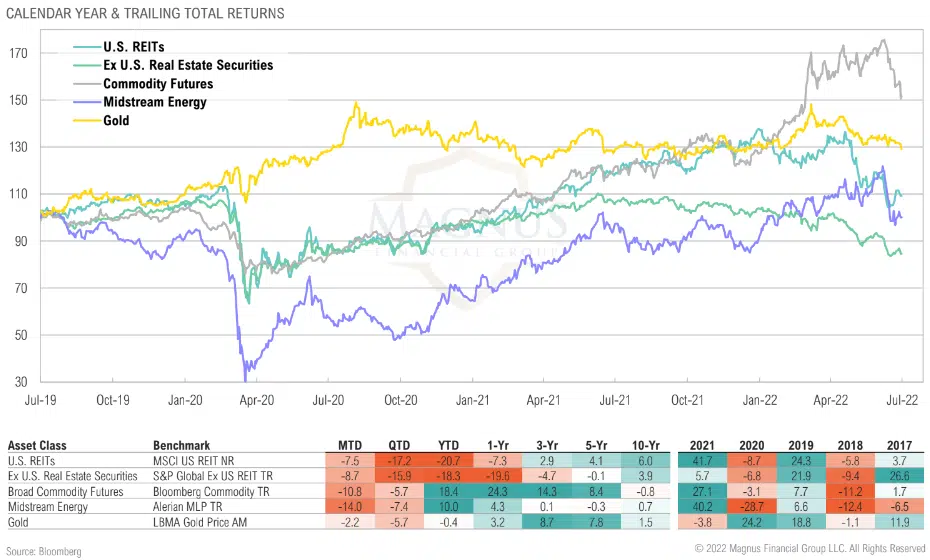
Despite this far-from-optimistic backdrop, there is good news. Lower prices are creating opportunities. Investors can now earn a 2.8% yield on a two-Year Treasury that yielded just 0.1% early last year. Further, the average high yield bond, as proxied by the Bloomberg High Yield Bond Index, now yields approximately 8%, its highest since February 2012. The pain felt today via lower prices (and higher yields) increases the return potential of all financial assets. In the adapted words of the late great Prince, “Dearly beloved, we’re gathered here today to get through this thing called… the bear market.”

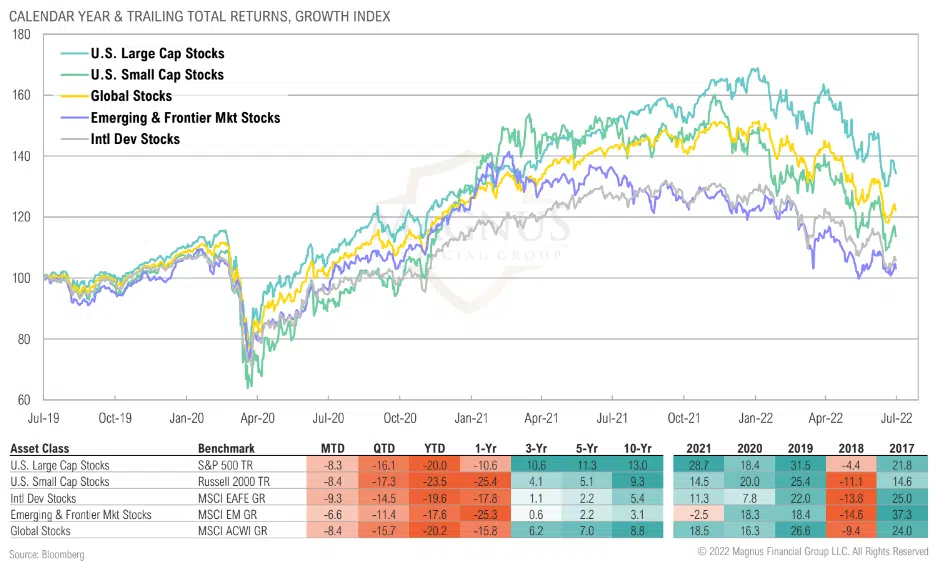
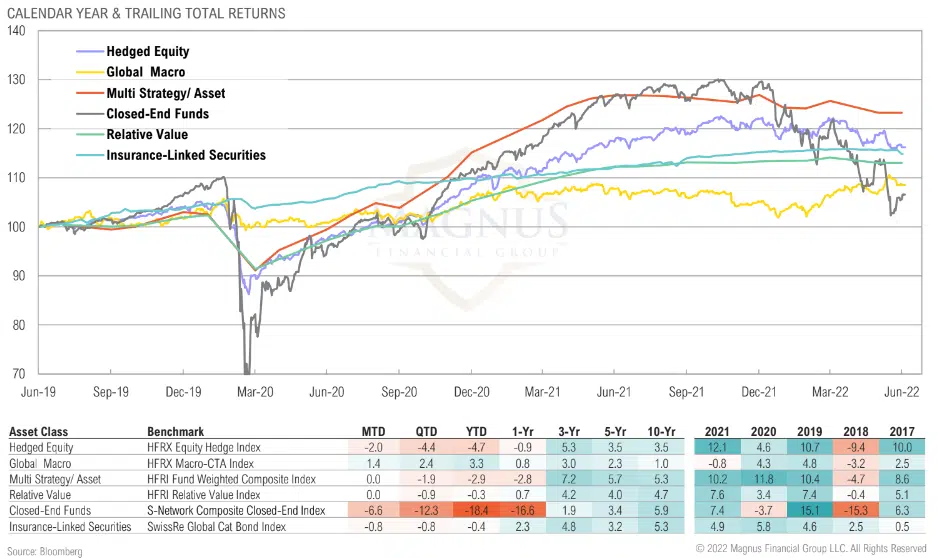
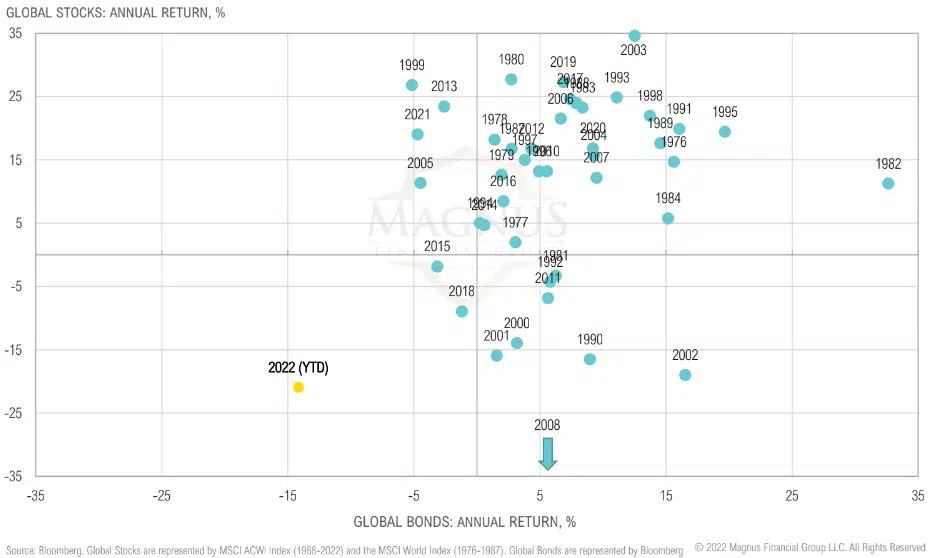
The second quarter was unusually challenging in that both U.S. large cap stocks (-16.1%) and bonds (-4.7%) declined together… again!

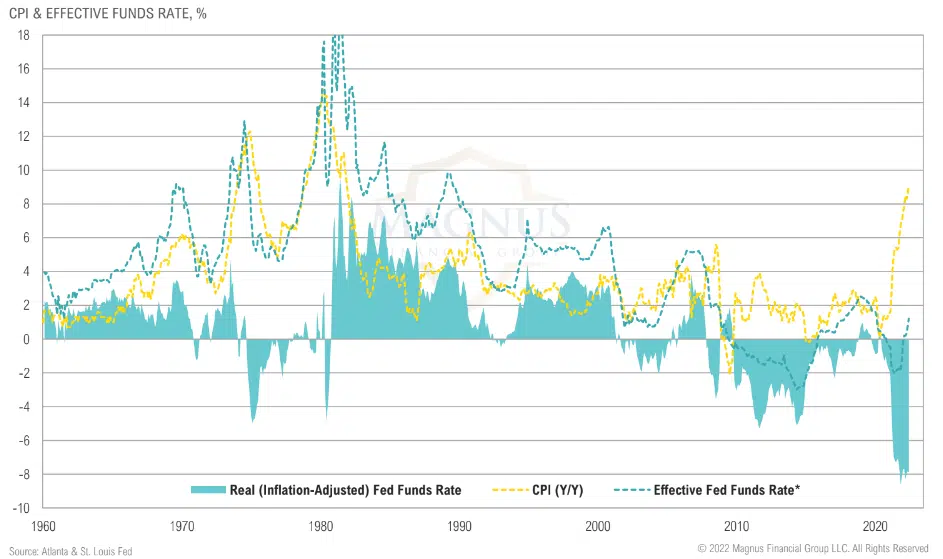
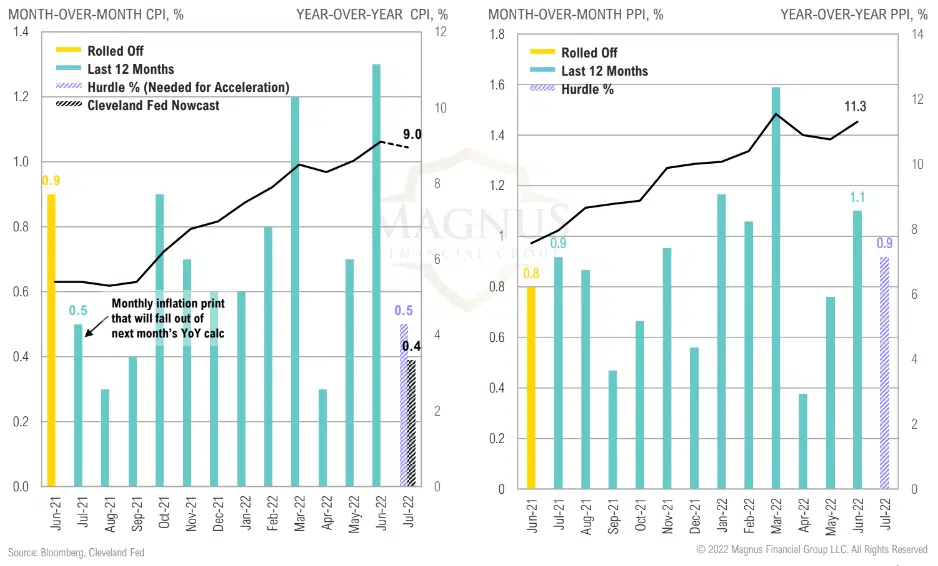
For inflation to moderate in July, MoM CPI change needs to be lower than 0.5% and below 0.9% for PPI
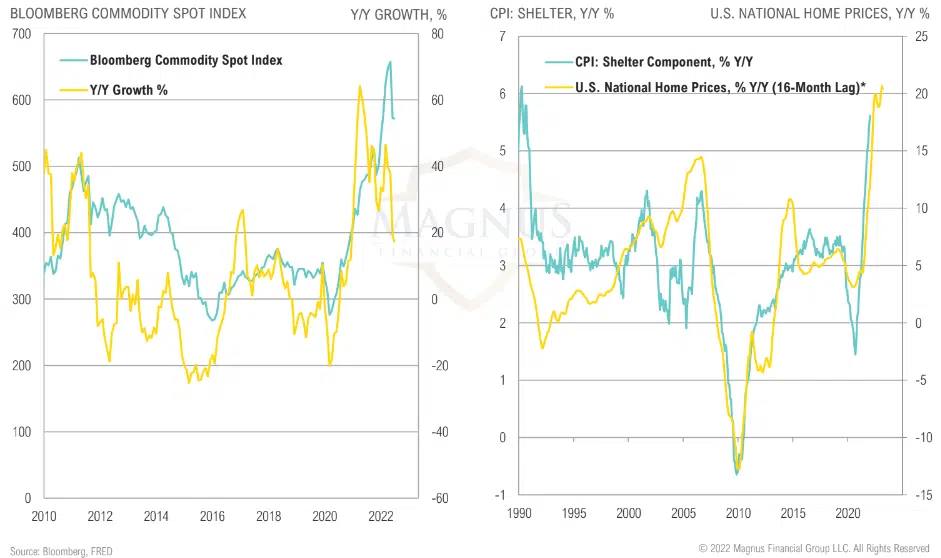
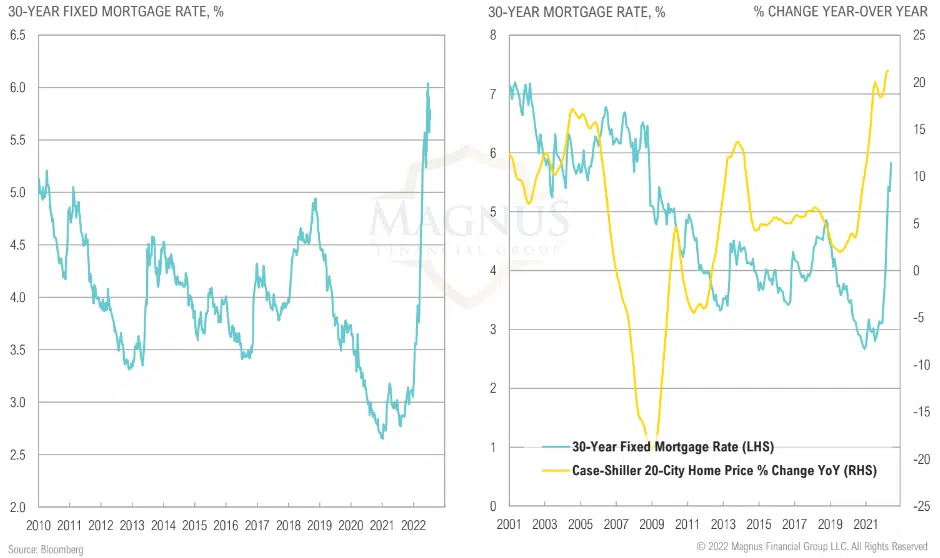
While commodity prices rolling over will help contain inflation, house prices impact the shelter component of CPI with a 12–18-month lag