SUMMARY
“…the nationwide rollout of Covid-19 vaccines, the persistence of ultralow interest rates, and expectations for torrid economic growth have convinced America’s money managers that the stock market still has more room to rise.”
-Semi-Annual Large Money Manager Survey, Barron’s, April 25, 2021
Q1, 2021 Market Review
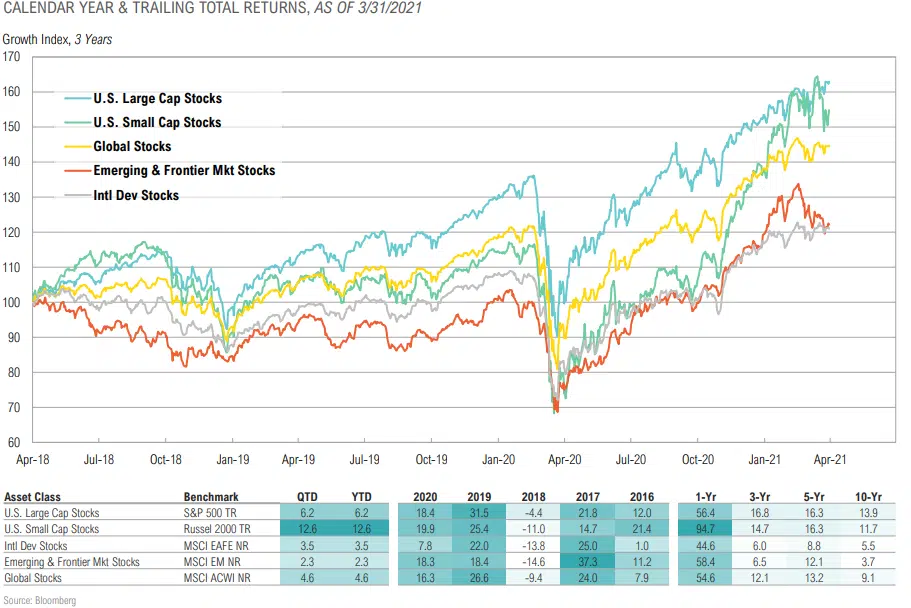
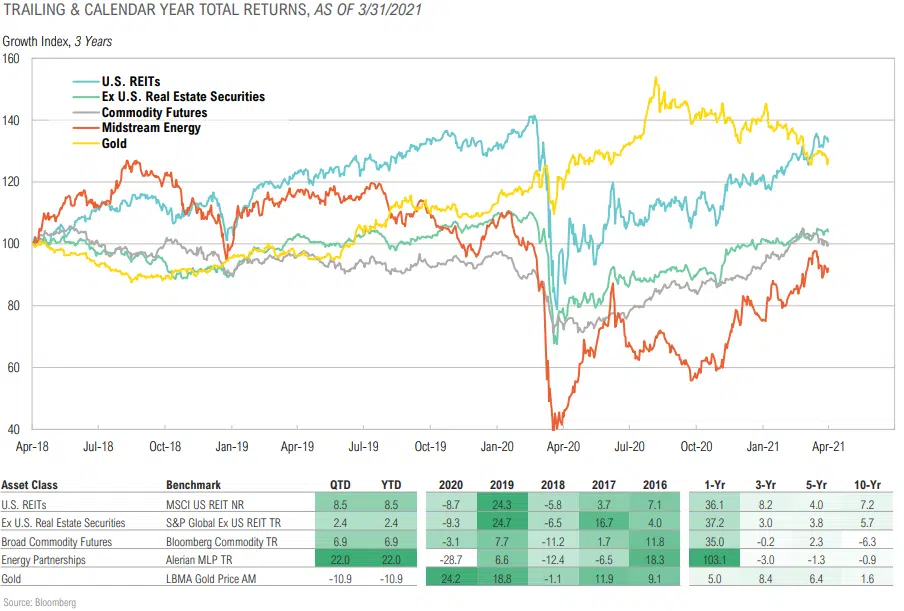
QTD TOTAL RETURNS
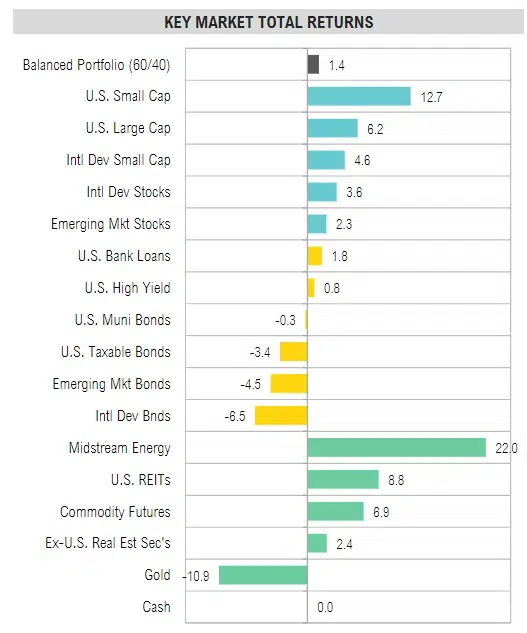
- Risky assets rallied with U.S. small cap stocks (+12.7%) and midstream energy assets (+22.0%) being top performers.
- U.S. large cap stocks, as measured by the S&P 500 Index, added 6.2% for the quarter.
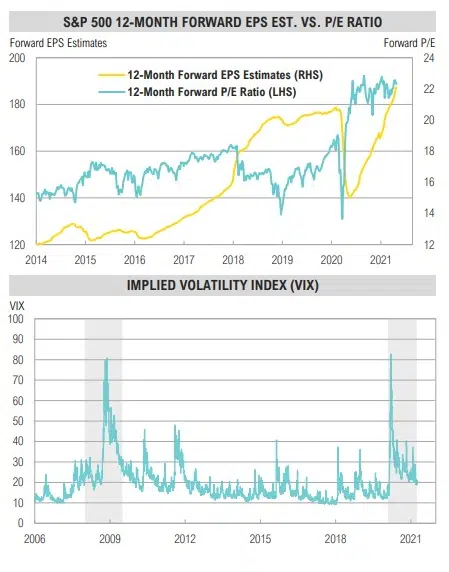
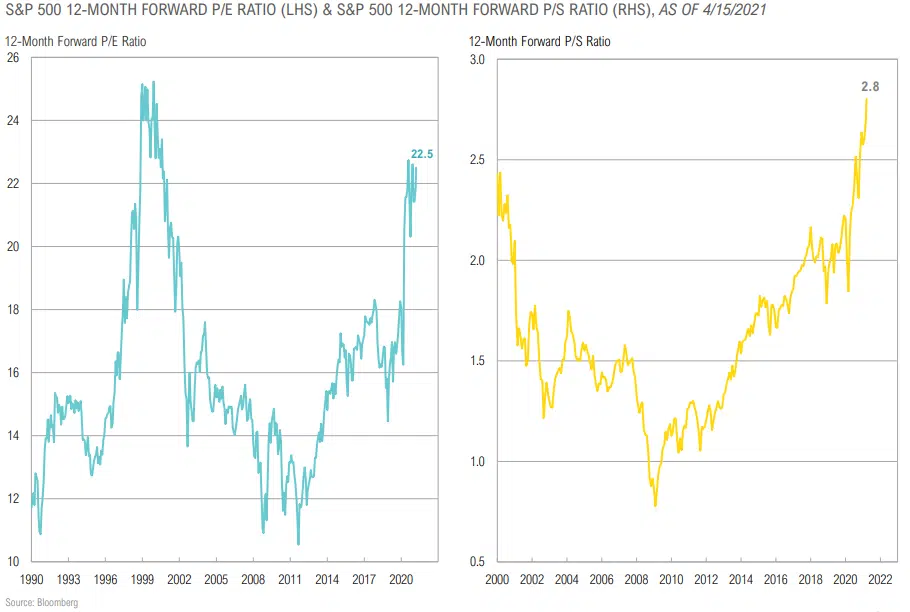
- The 12-month forward P/E ratio for the S&P 500 Index is currently 22.3x, near its highest level since 2000.
- Midstream energy added to its strong rally at the end of 2020, rising 22% in Q1. While gasoline demand (the largest end market) is stabilizing, volumes have ranged between 15% to 18% below prior-year levels, according to the EIA.
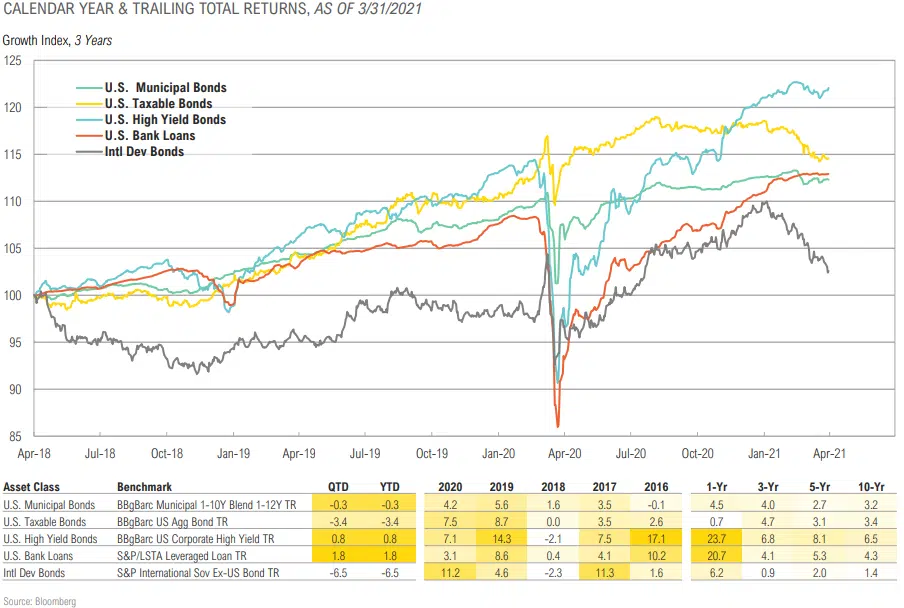
- Most credit markets rallied slightly as rates rose but credit spreads narrowed. High yield bond spreads ended the quarter at 3.4%.
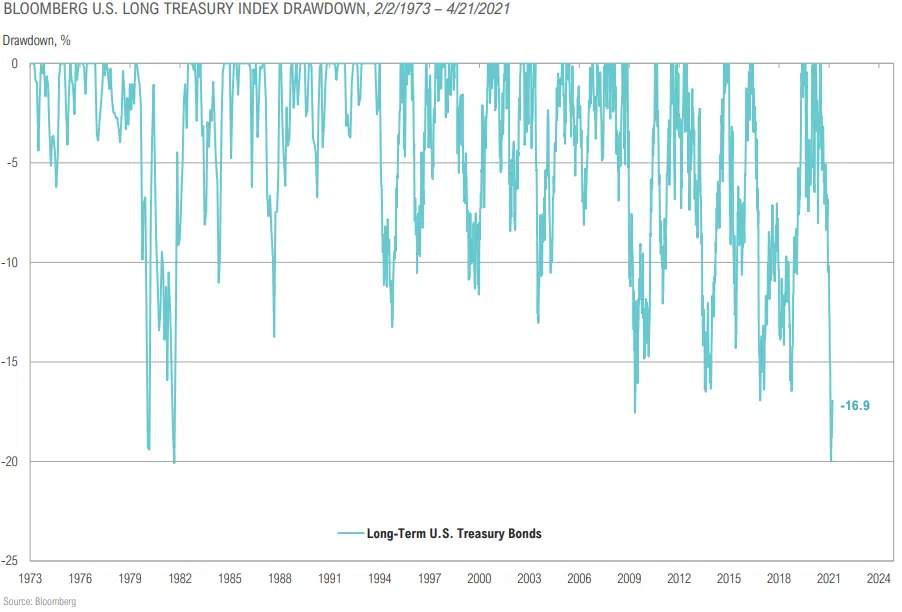
- Bonds suffered their worst quarterly loss (-3.4%) since the third quarter of 1981, when they lost 4%. To put this return in perspective, there have only been three quarters in history, all in 1980 and 1981, when the Bloomberg Aggregate Bond index lost more 3%.
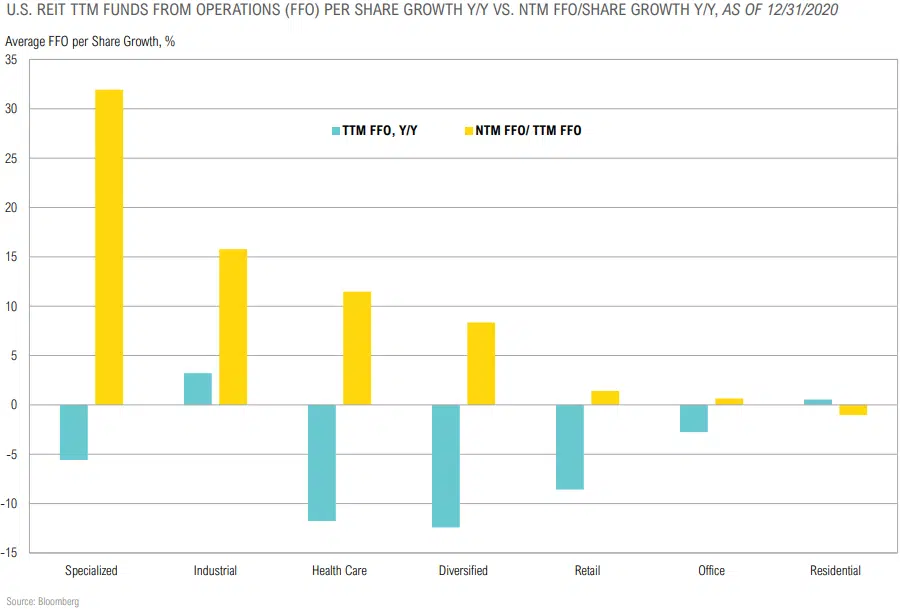
- Despite concerns about what post-pandemic demand will look like, publicly-traded real estate (REITs) rose 8.8%, driving index yields down to 3.6%.
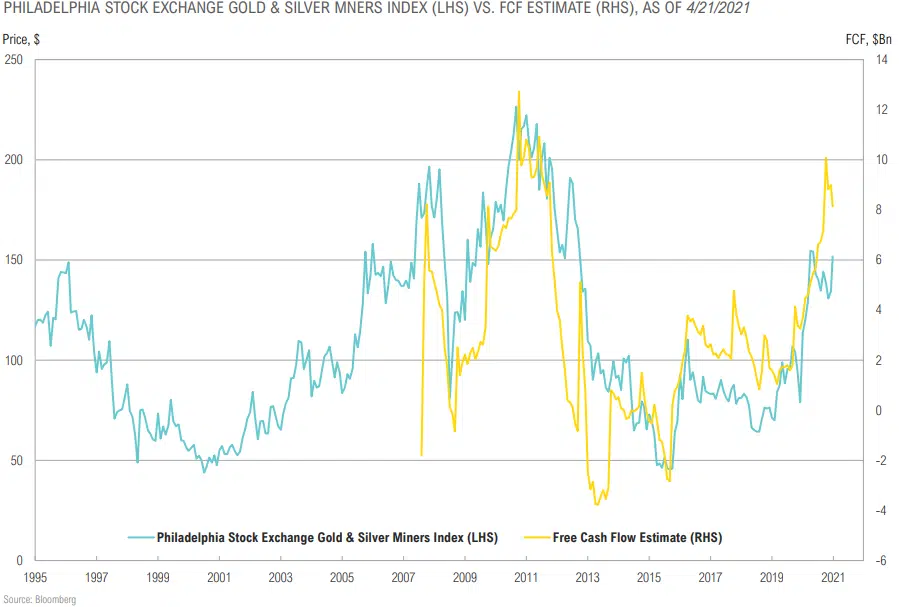
- After strong gains in 2020, gold retreated 10.9% as real rates rose during the quarter.
GROWTH, INFLATION & POLICY
“We won’t be preemptively taking the punchbowl away from the economy…in an effort not to let unemployment get too low… I see pockets of concern —pockets of froth. It’s not a pervasive indicator that financial conditions are frothy overall, I just don’t see that”
-Mary Daly, San Francisco Fed President, March 24, 2021
COMMENTARY & MARKET DATA
- Growth expectations for FY21 have increased since the start of the year, now coming in at 6-7% (Bloomberg, IMF), helped by stimulus, vaccine rollout, and dramatic base effects.
- Increased reliance on government spending and generally negative fiscal multipliers, especially in highly-indebted countries, means that longer term real (inflation-adjusted) growth will be constrained.
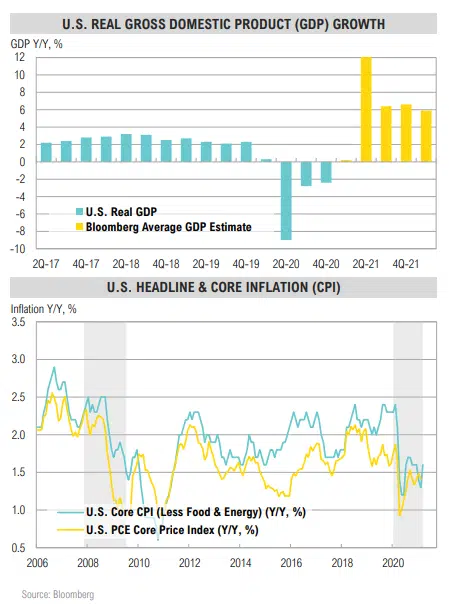
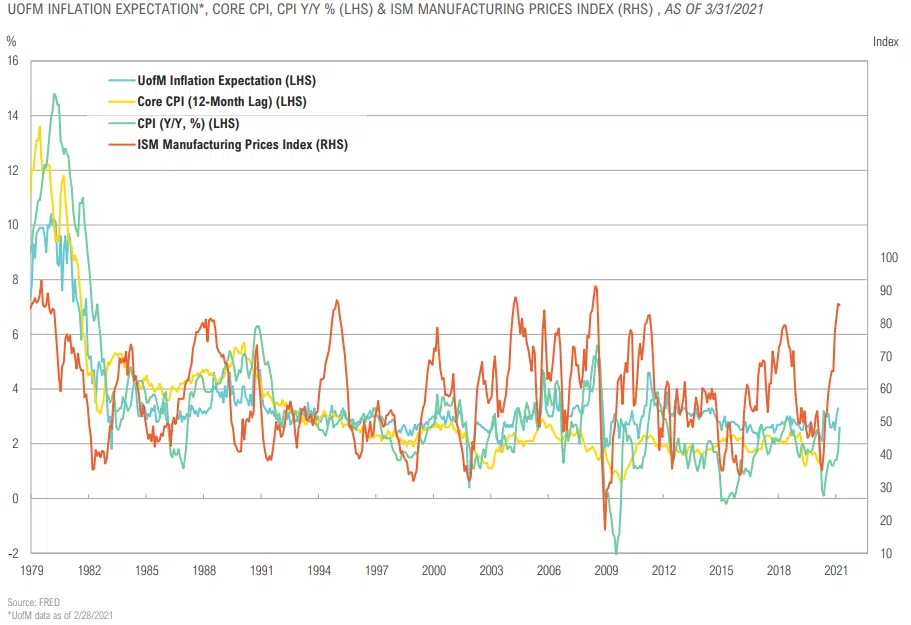
- While current inflation is relatively low, long-term inflation expectations have continued to trend higher. The 10-year TIPSimplied inflation rate is currently 2.4%, a 7-year high.
- Economic slack, persistent technology adoption and extreme debt levels will act as a damper on inflation (and bond yields), but the trend to perpetual stimulus should overcome this.
- On balance, we expect inflation to trend higher in fits and starts (higher lows and higher highs) in coming years.
- To date, fiscal stimulus has been more reactive (replacing lost income) than proactive (stimulus).
- We believe policy will become increasingly proactive and supportive/ distortive for at least three reasons:
- Single party control of the U.S. government
- The de facto merging of the Fed and Treasury
- The Covid-19 crisis creating the political will for further government spending and bailouts
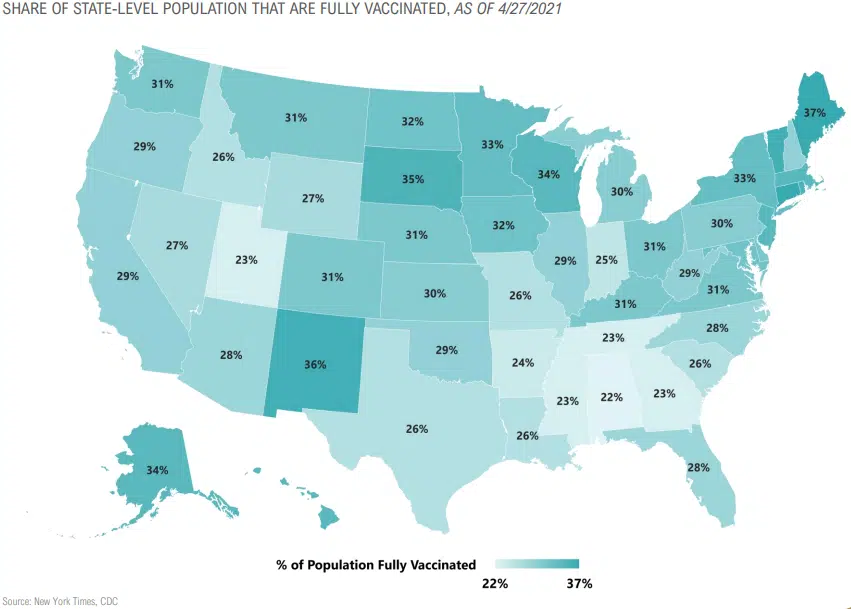
Vaccinations in the U.S.
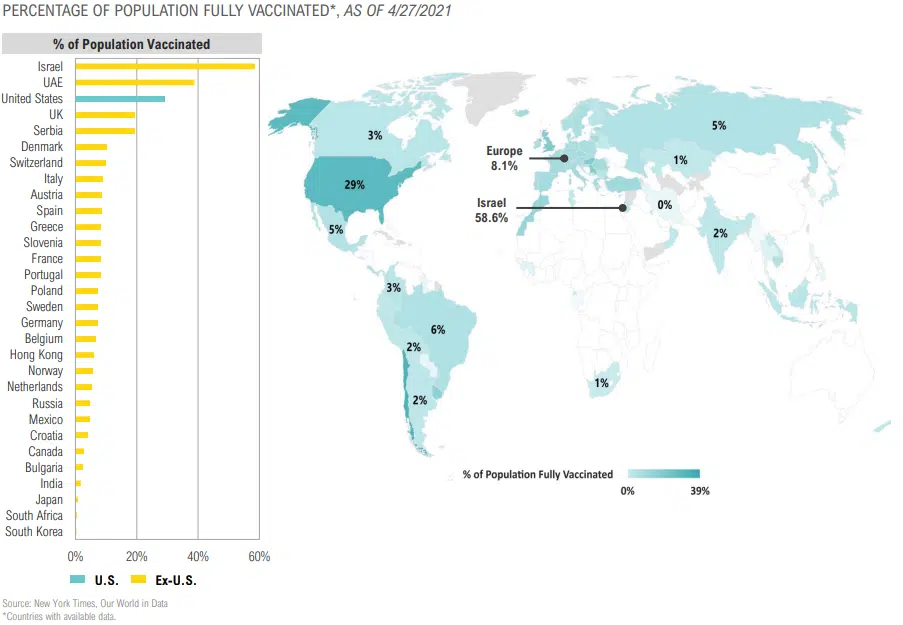
Global Vaccinations
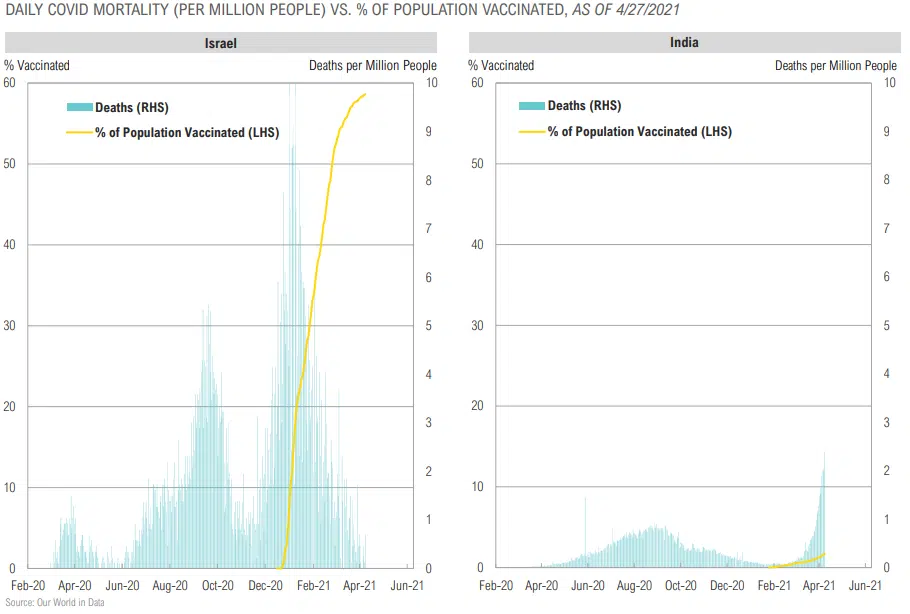
Covid Mortality vs. Vaccinations: Israel vs. India
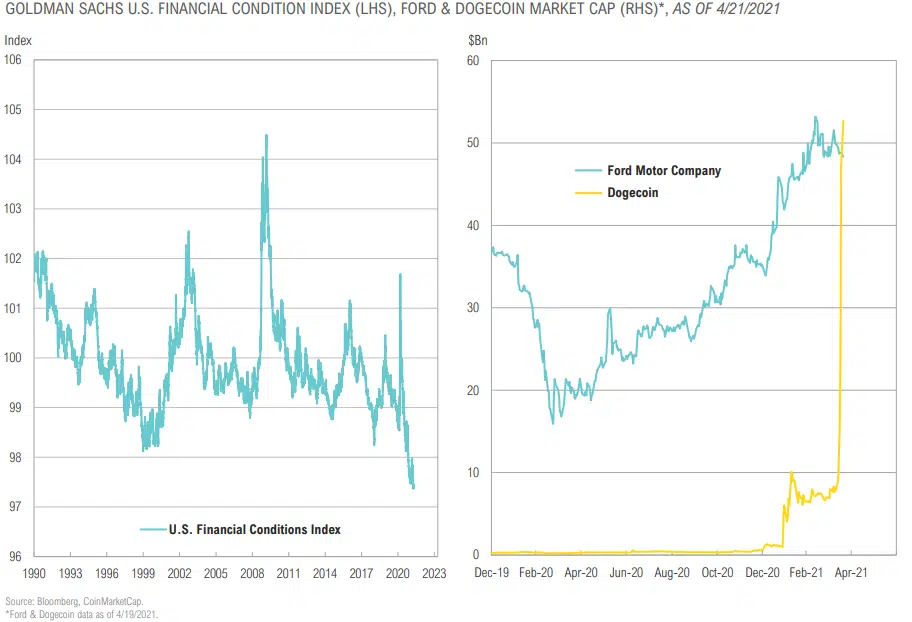
Financial Conditions Are the Easiest they Have Ever Been
Quantitative Easing in Perspective
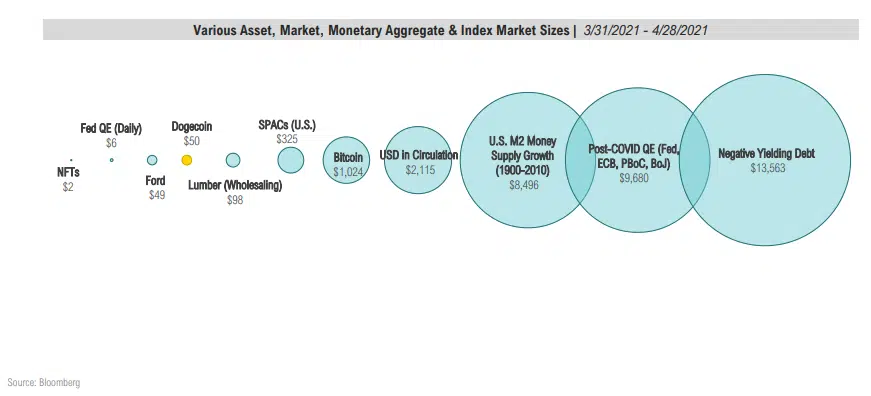
VARIOUS ASSET, MARKET, MONETARY AGGREGATE & INDEX MARKET SIZES, AS OF 3/31/2021 – 4/28/2021
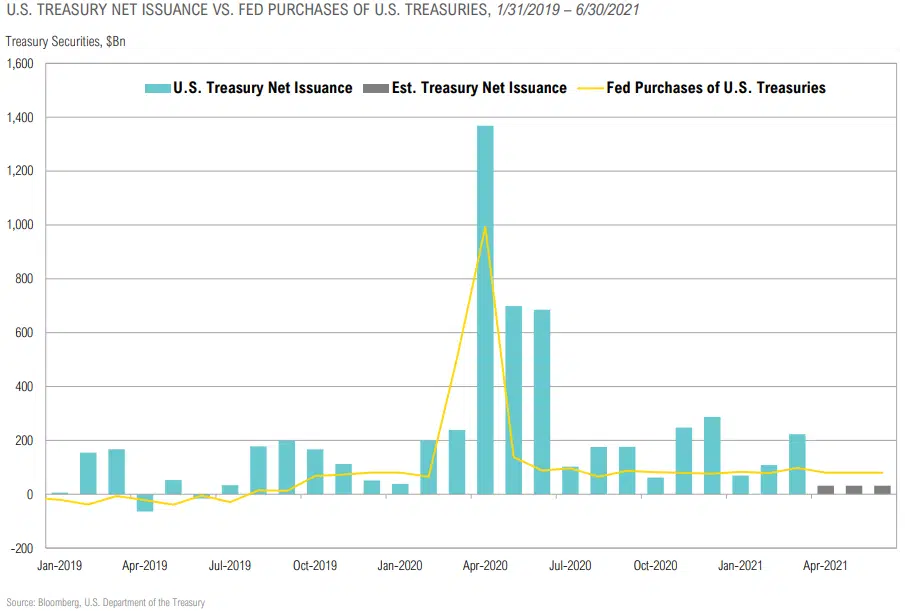
- The Fed is monetizing (“printing”) about $120 billion per month, which translates to approximately $6 billion every weekday or $250 million every weekday hour.
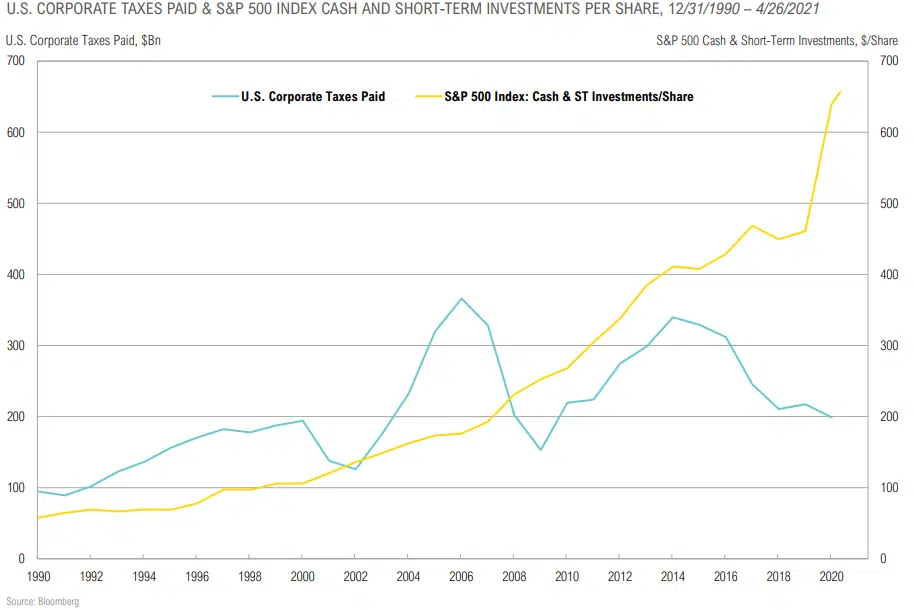
- For context, average total annual U.S. corporate tax receipts for the last three years have been approximately $220 billion (created by the Fed every two months).
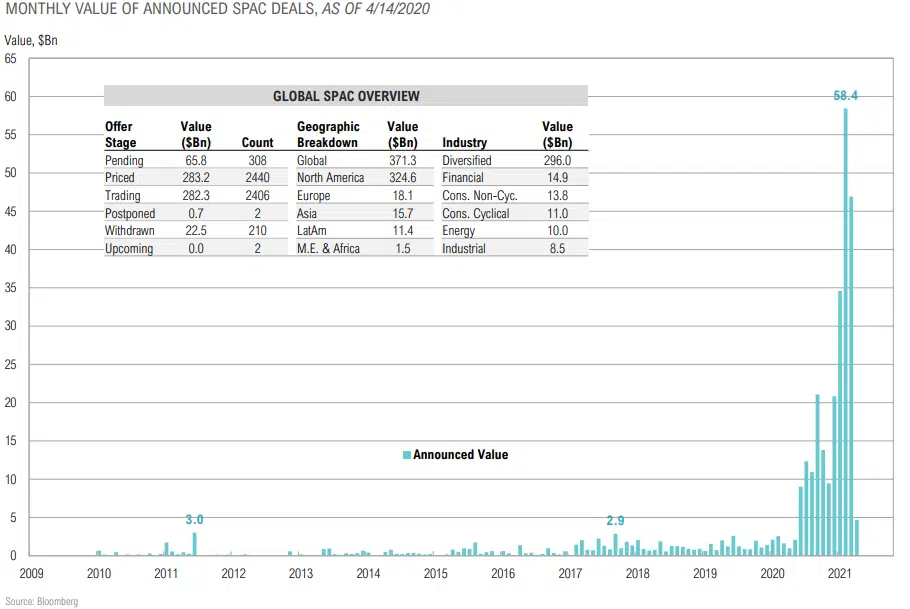
- Relative to this monetization, other high-profile assets and asset markets seem less frothy. For example, the total NFT market did around $2 billion of transaction volume in 1Q; Dogecoin is currently worth around $50 billion; and the entire U.S. SPAC market is approximately $325 billion.
Actual & Expected Inflation Are Trending Higher
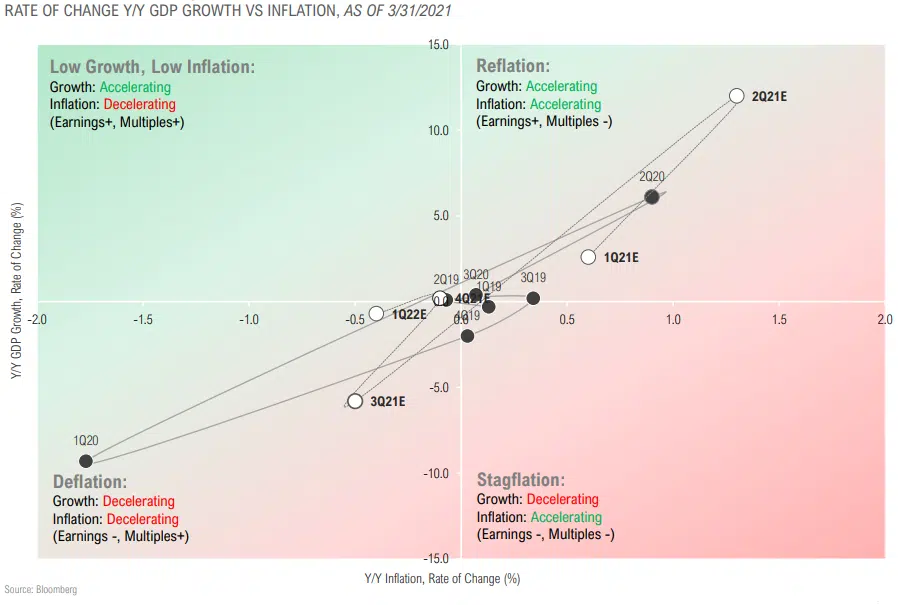
Reflation Expected to Continue for Rest of 1H21, But Without Policy Governor of Higher Interest Rates
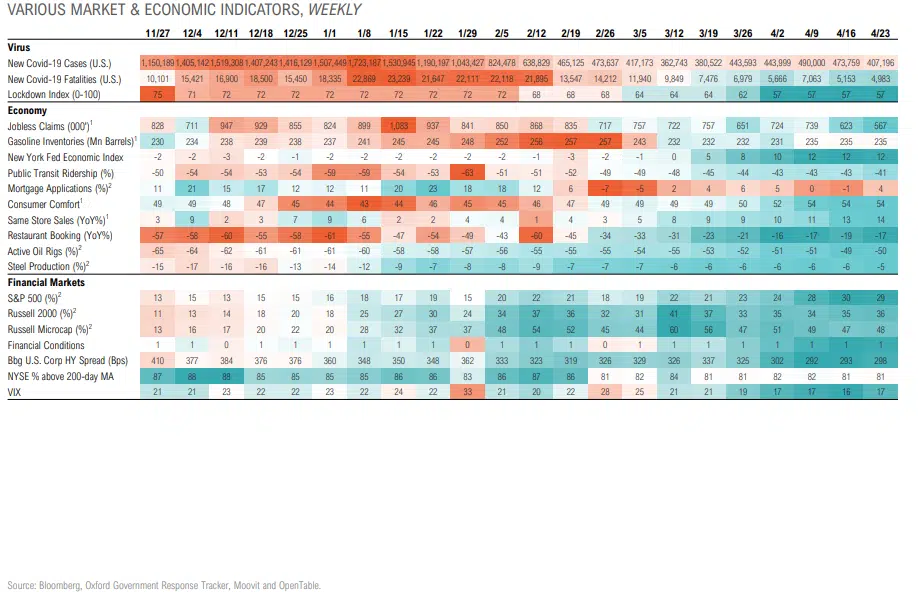
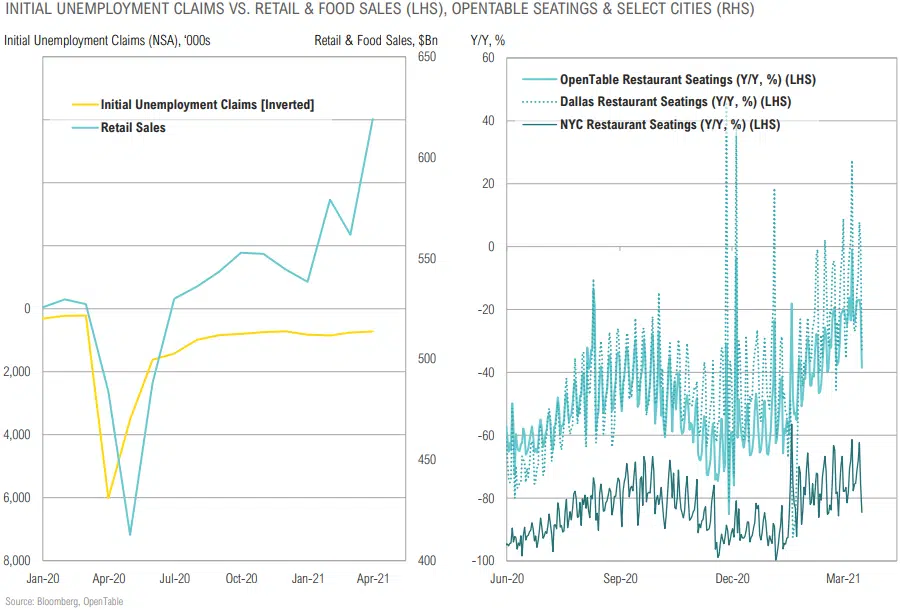
Tracking the Recovery
Retail Sales Jump, Economic Activity Improving
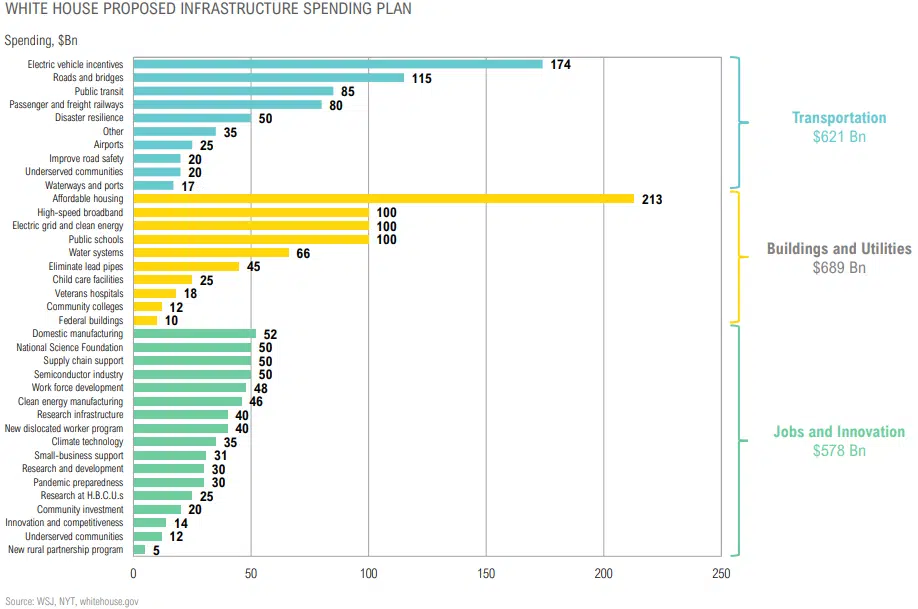
Breakdown of Proposed $2.3 Tn U.S. Infrastructure Spending Plan
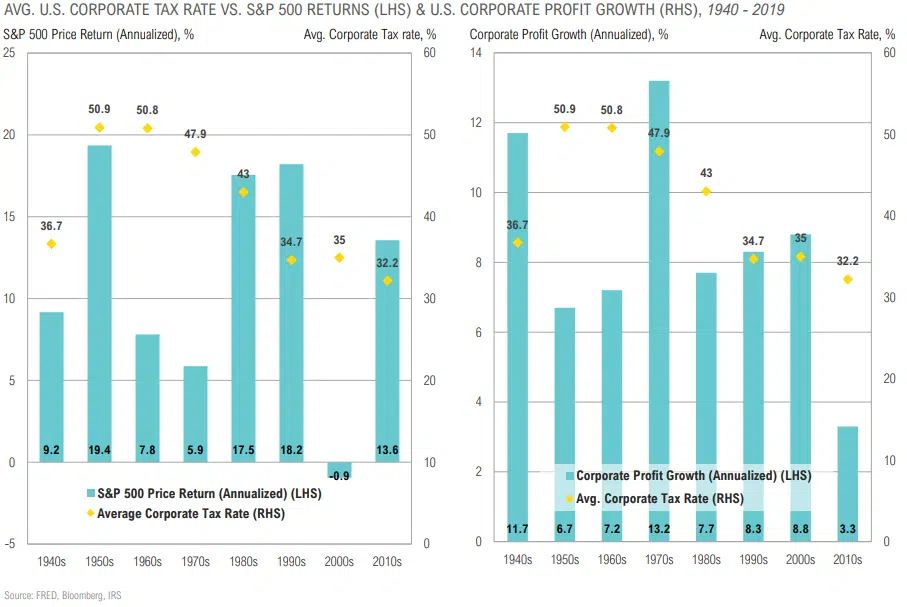
Corporate Taxes Historically Have Had a Mixed Impact on Equity Returns and Profit Growth
EQUITY
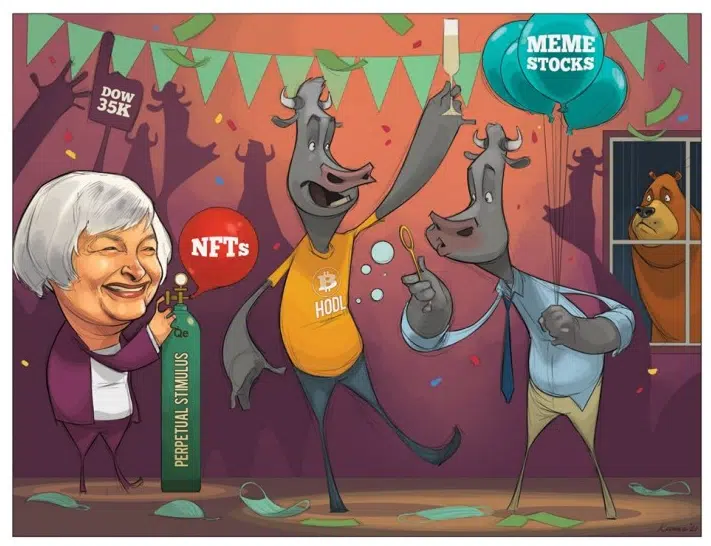
“[the confetti] is getting really misconstrued, and I think it’s actually doing the opposite of what we want.”
-Madhu Muthukumar, Senior Director, Product Management, Robinhood
Equity Returns
Equity Summary
COMMENTARY & MARKET DATA
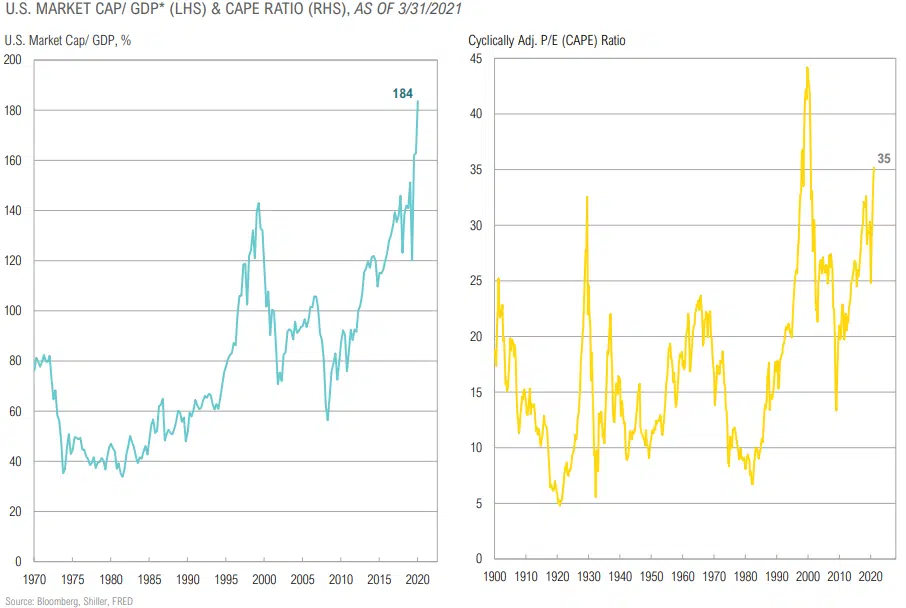
- U.S. equity valuations are back in the top-quintile, implying muted forward long-term returns substantially below those of the last decade.
- U.S. equity valuations are elevated relative to foreign developed and emerging equities, but growth rates are better, and the policy backdrop – including the vaccine rollout – is more supportive in the U.S.
- Lower valuations in Europe reflect structural challenges faced by a continent that continues to get squeezed by competition from the U.S. and China.
- We continue to favor large cap indices over small cap indices, but active small cap managers over large cap indices, reflecting a better opportunity set for active managers in the small cap space.
- Long-term return expectations for emerging market stocks rose during the quarter (from 5.0% to 5.5%) due to a modest change in valuations, but the tactical outlook is less rosy.
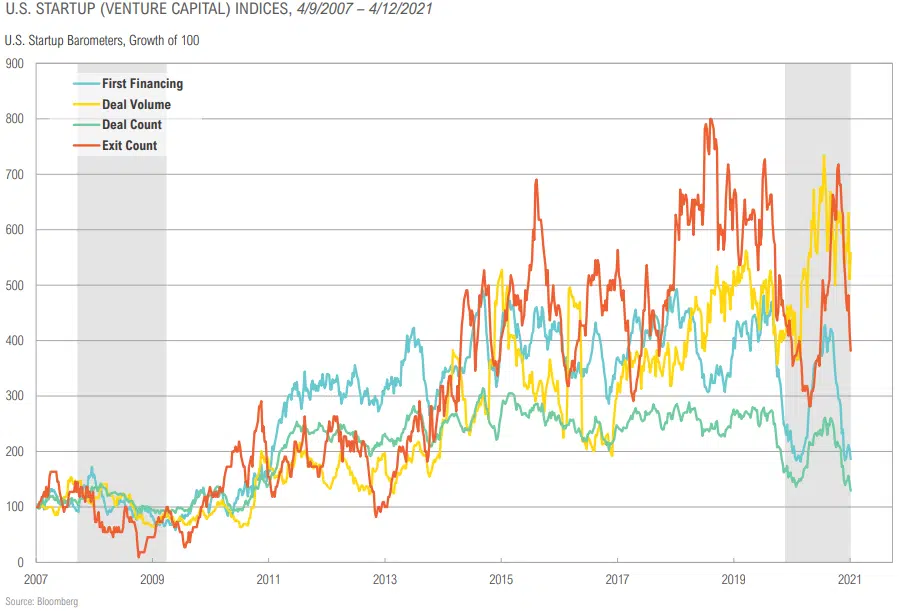
- Even net of higher fees, select investments in high quality venture capital can add value for clients that have the capacity for reduced liquidity.
- Recent SPAC trends should create a robust exit market for 2020 and 2021 venture vintages.
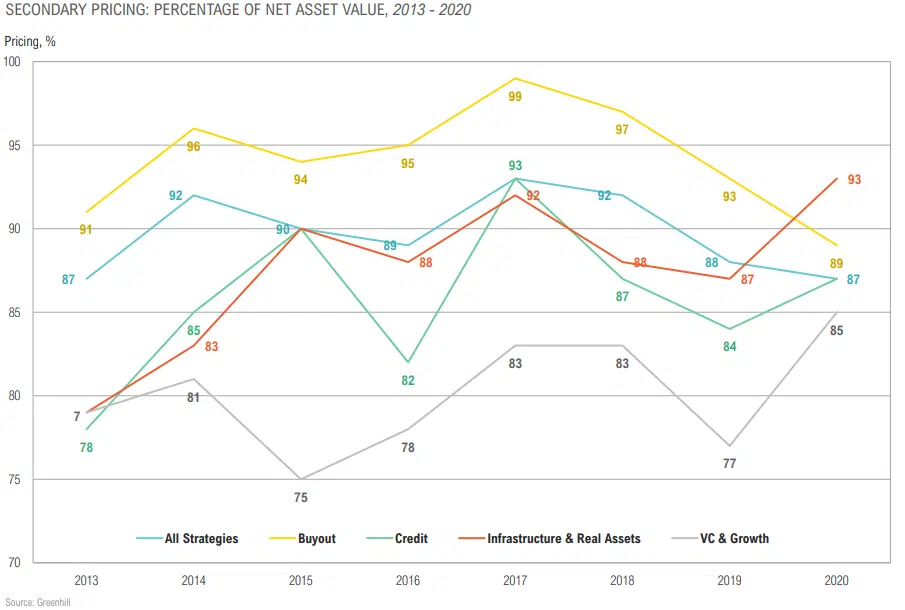
- Secondary pricing in larger deals has recovered and no longer attractive, however, opportunities still exist in smaller deals.
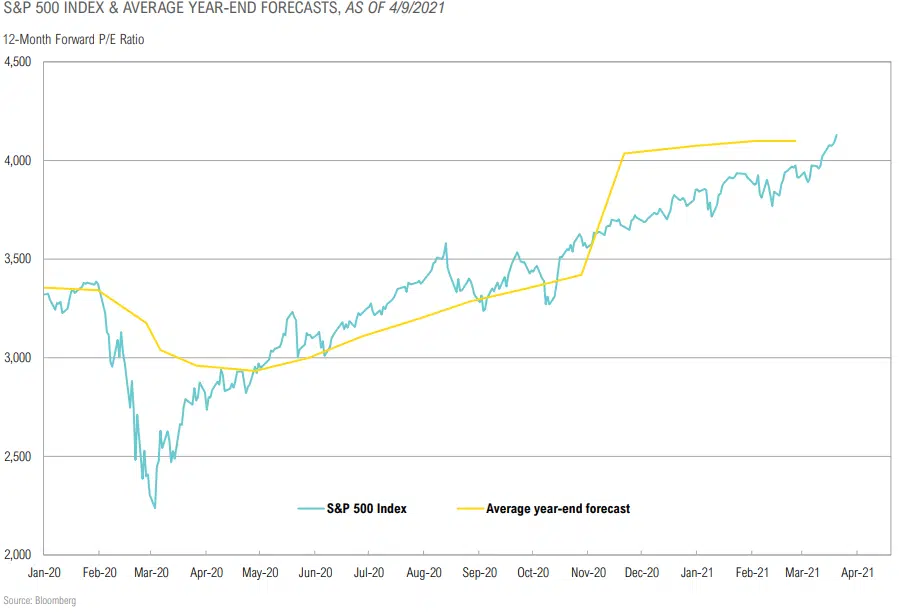
S&P 500 Already Ahead of Year-End Targets
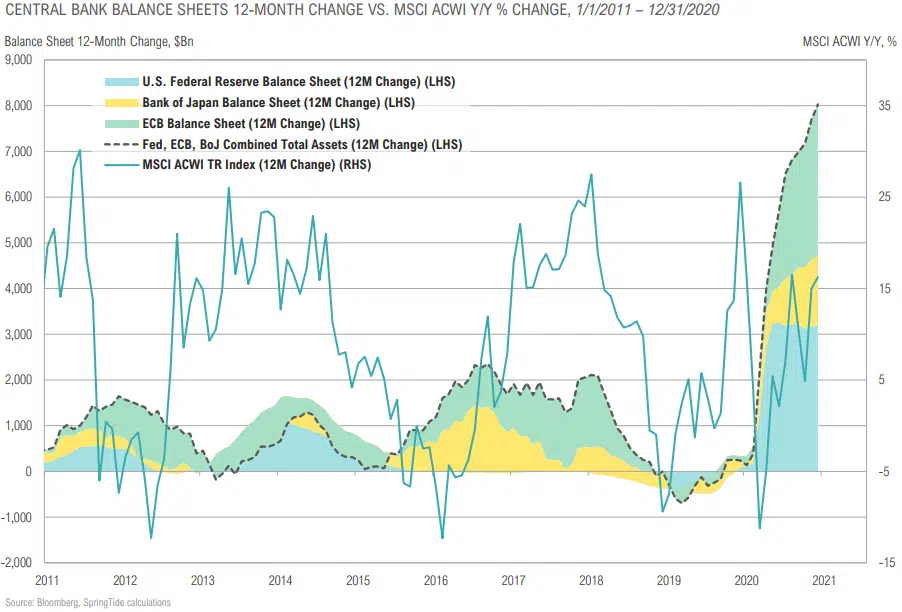
Central Bank Balance Sheets and Global Stocks
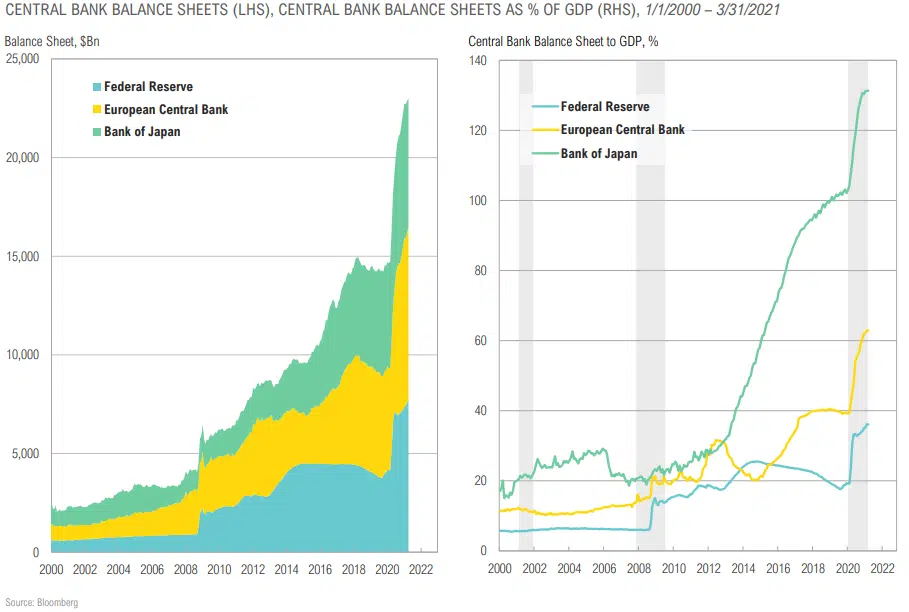
The Fed Can Provide More Stimulus Relative to Other Central Banks
U.S. Corporations Are Sitting With Record Cash on Balance Sheets
U.S. Stocks Are Expensive by Many Measures pt. 1
U.S. Stocks Are Expensive by Many Measures pt. 2
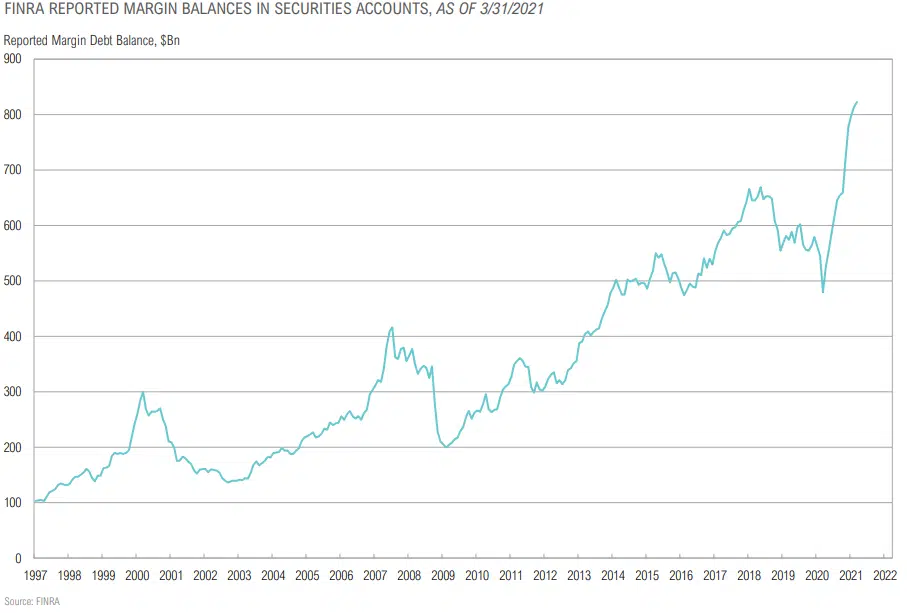
Record Levels of Margin Debt
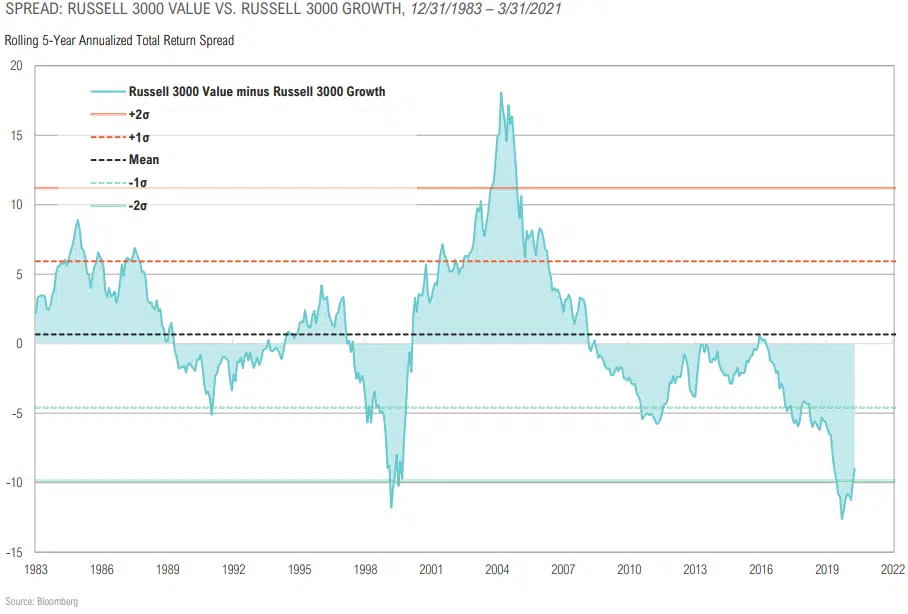
Value is Starting to Outperform Growth, Still Near Relative Extreme
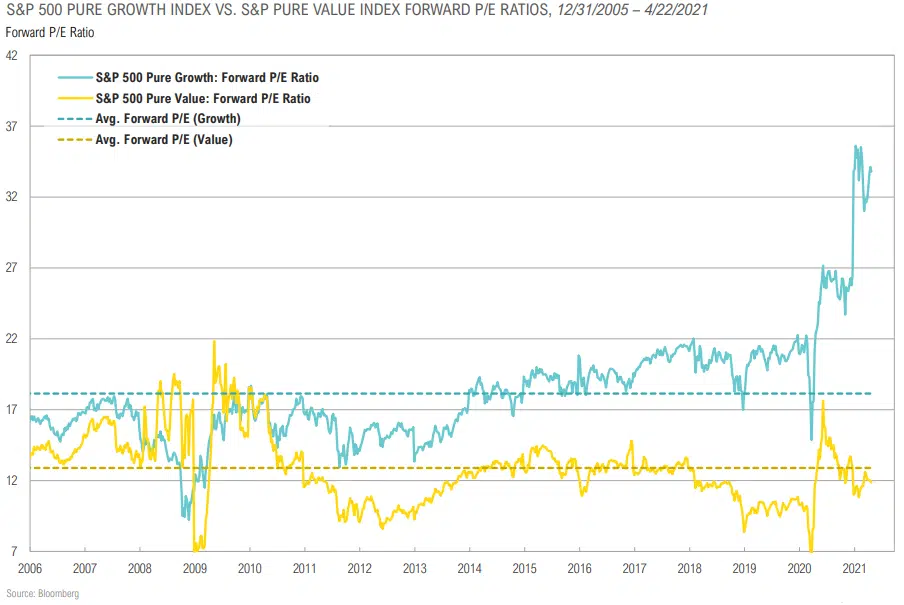
U.S. Growth Stocks Substantially More Expensive than Value Relative to Earnings
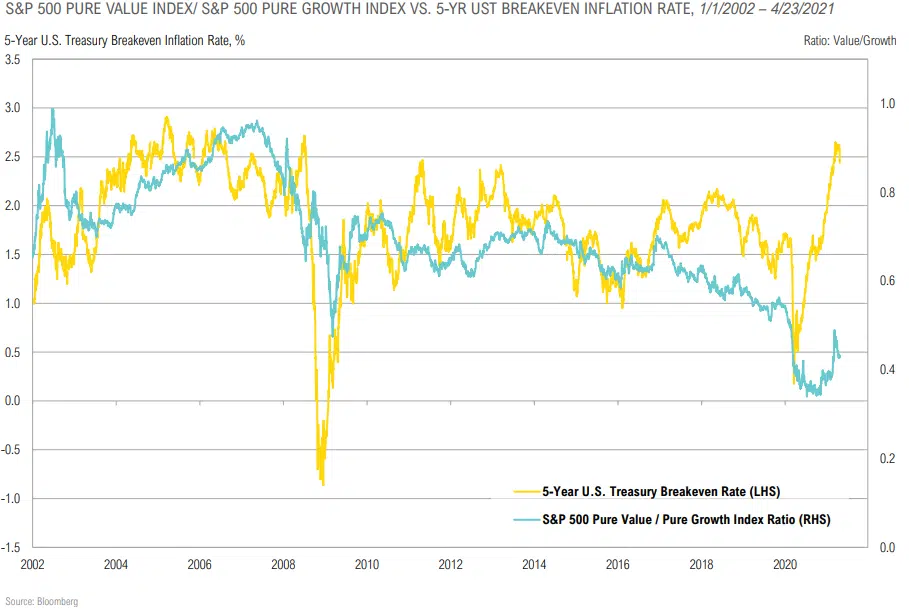
Value Stocks Have Benefited From Rising Inflation Expectations
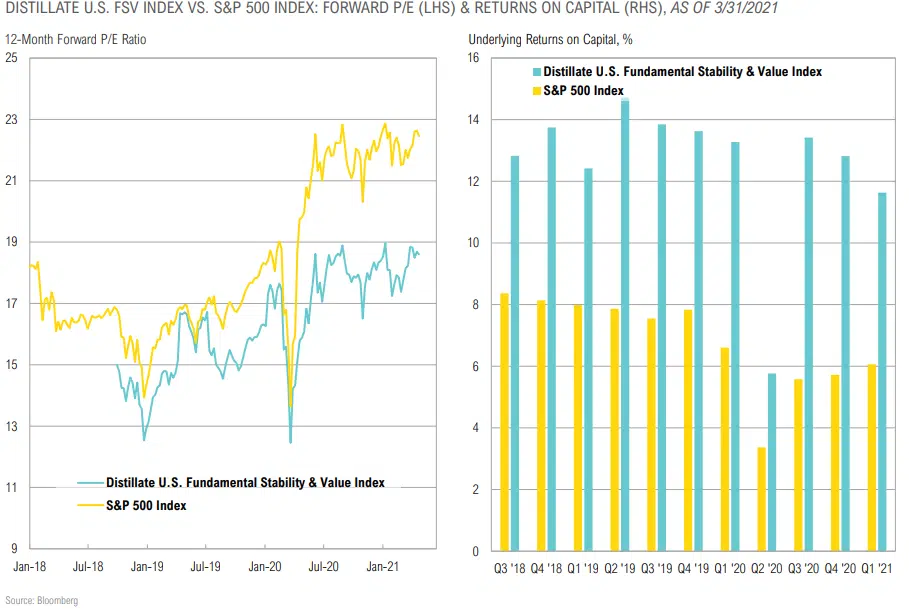
Reducing Risk in U.S. Large Cap Stocks
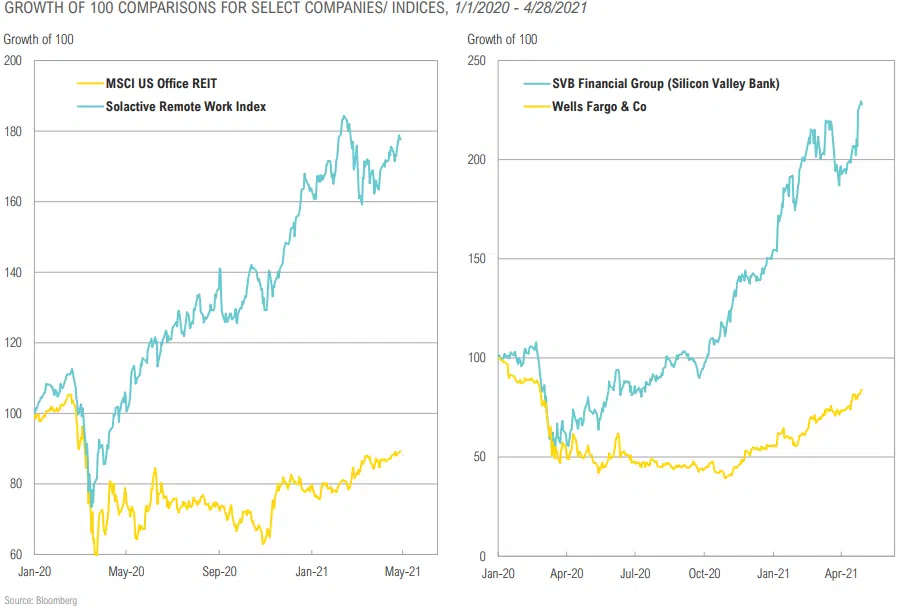
Winners vs. Losers or Redefining “Normal”?
Modest Activity Hangover in Venture, But Not Concerning Yet
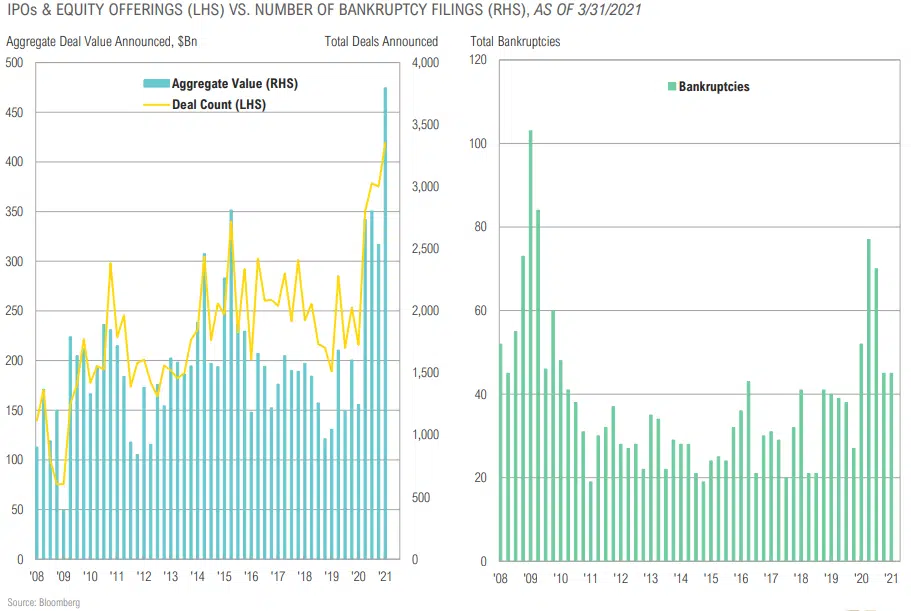
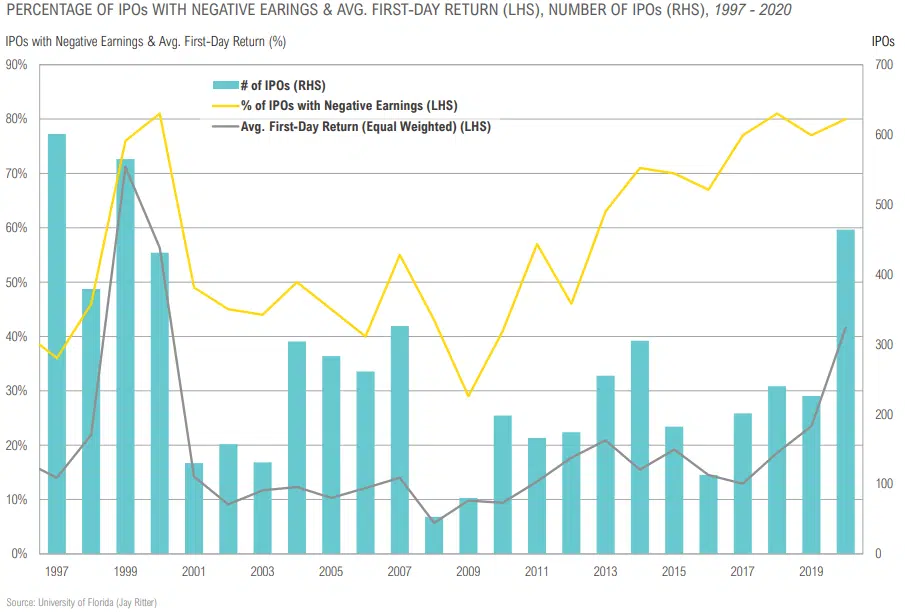
IPOs vs. Bankruptcies
SPAC Announced Deals
Lack of Profits was Not an Issue for Investors in 2020
Buyout & Venture Secondaries Remain Attractive
FIXED INCOME & CREDIT
“MMT teaches us that if we have the real resources we need—that is, if we have the building materials to fix our infrastructure, if we have people who want to become doctors, nurses, and teachers, if we can grow all the food we need—then the money can always be made available to accomplish our goals. That is the beauty of a sovereign currency.”
-Stephanie Kelton, The Deficit Myth: Modern Monetary Theory and the Birth of the People’s Economy
Fixed Income & Credit Returns
Fixed Income & Credit Summary
COMMENTARY & MARKET DATA
- Short-term rates will remain low for the foreseeable future.
- The Fed’s new, somewhat opaque approach to generating inflation adds insult to injury for fixed income investors with low-risk thresholds, substantially raising the risk of negative real yields.
- U.S. Treasury yields may rise as a result of massive government spending, but a structural ceiling on developed market rates from demographics and debt overhang will likely not get overcome until persistent MMT-inspired stimulus via some form of ongoing Universal Basic Income (UBI).
- Most credit markets rallied slightly as credit spreads narrowed. High yield bond spreads ended the quarter at 3.4%.
- Bonds suffered their worst quarterly loss (-3.4%) since the third quarter of 1981, when they lost 4%. To put this return in perspective, there have only been three quarters in history, all in 1980 and 1981, when the Bloomberg Aggregate Bond index lost more 3%.
- Private credit remains attractive given higher rates of return and heightened economic volatility creating opportunity.
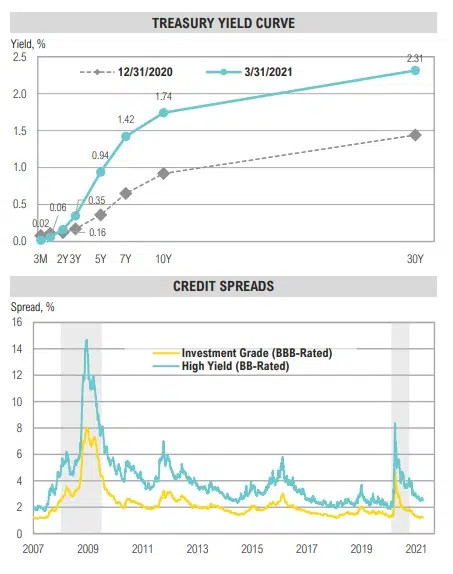
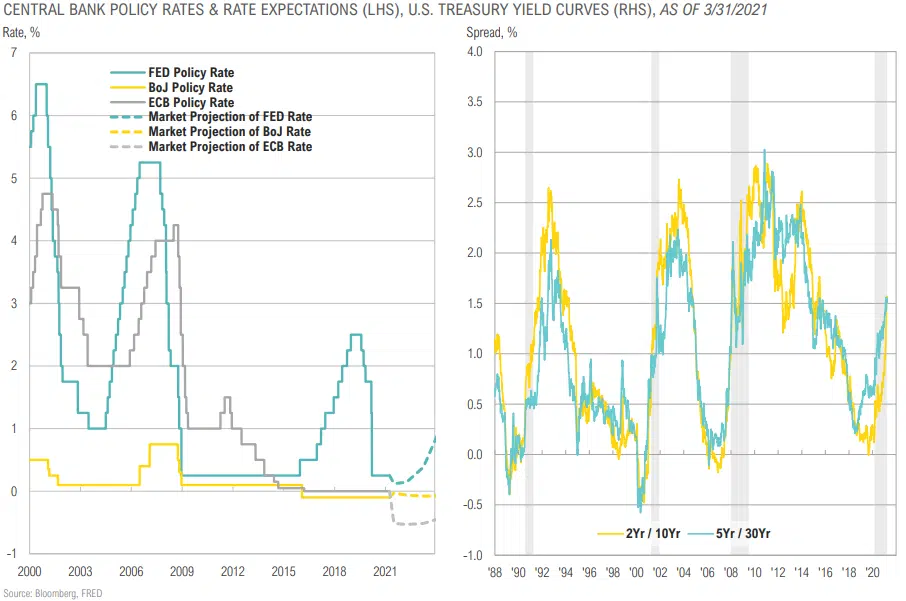
The Market is Pricing in Low Short-Term Rates for Several Years, but an Eventual Pickup in Growth/Inflation
Long-Term U.S. Treasury Bonds Correction
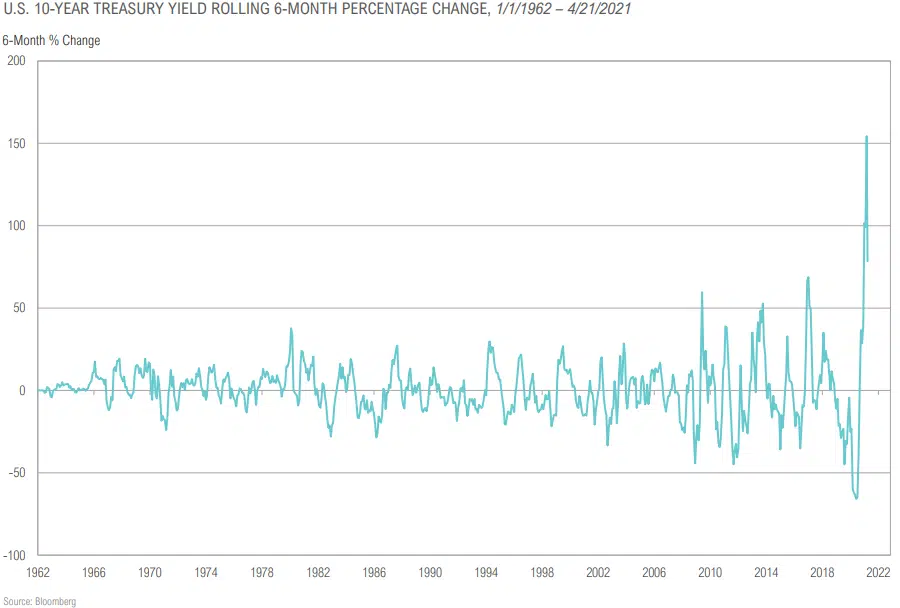
Largest Percentage Change in the U.S. 10-Year Yield on Record
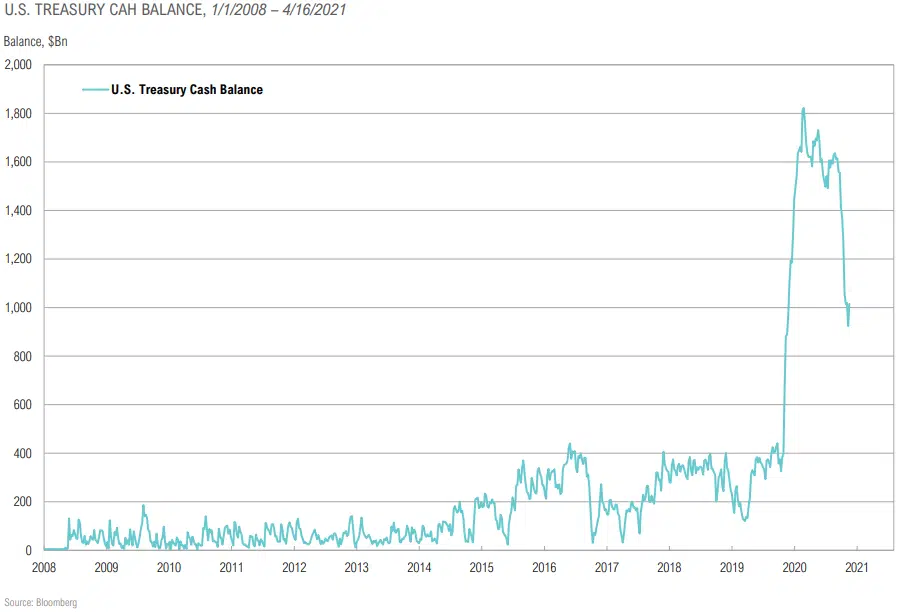
U.S. Treasury Cash Balance Declined After Stimulus
Fed Will Purchase More Treasuries Than Projected Issuance in Q2
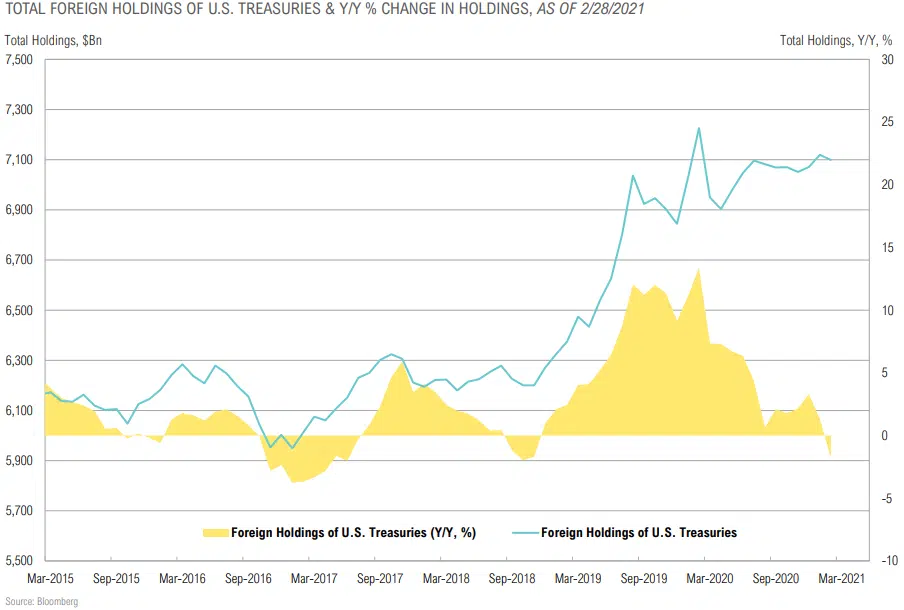
Foreign Holdings of Treasuries Increased Since Last Year’s Crisis
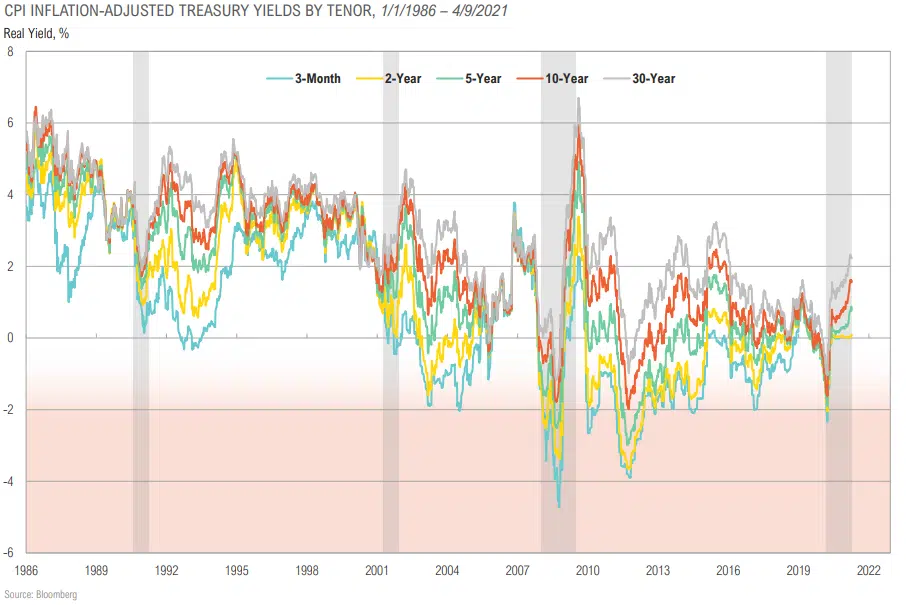
Treasury Yields May Not Protect Investors for the Loss of Purchasing Power From Even Modest Inflation
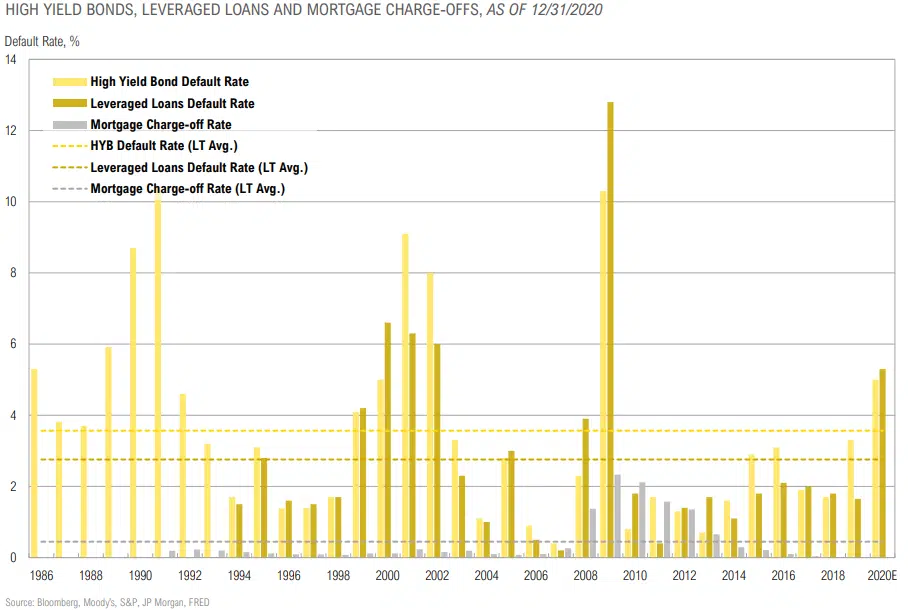
An Extra 1.5% in Credit Premium if the Fed Supports High Yield Bonds
REAL ASSETS
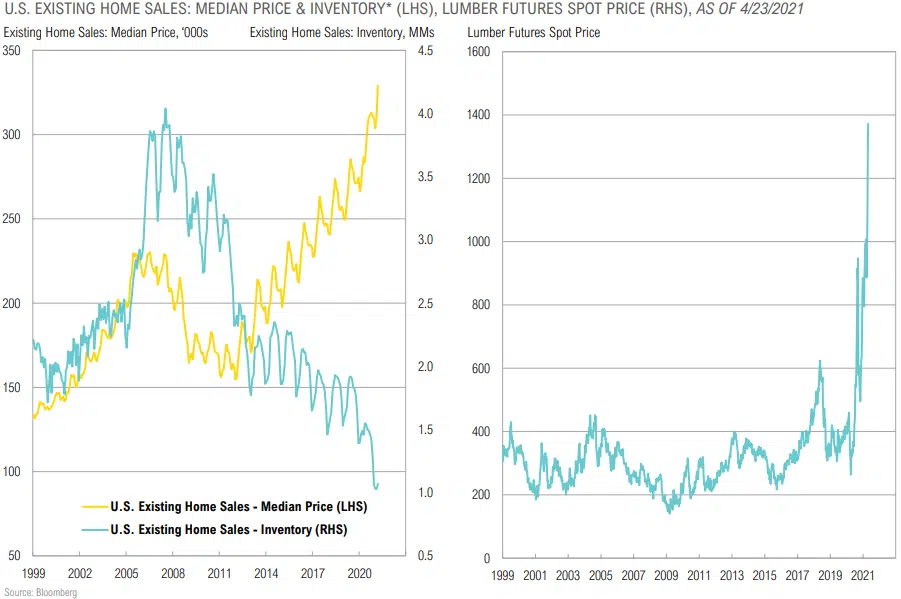
“We have seen, over the last four or five months, what I have never seen in my career before, is lumber to move to the level it has.”
-Sheryl Palmer, CEO of Taylor Morrison Home, April 2021
Real Asset Returns
Real Assets Summary
COMMENTARY & MARKET DATA
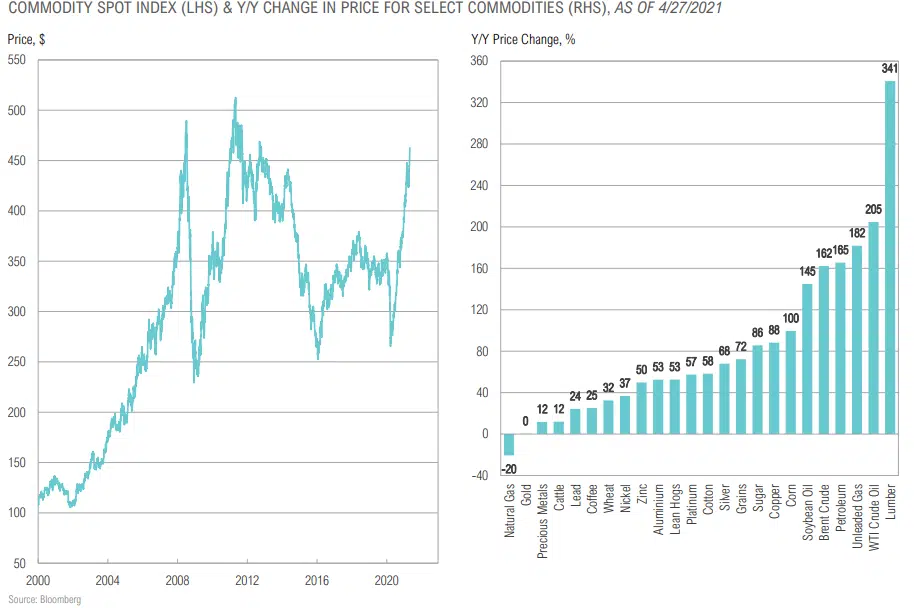
- The commodity bull market is well underway as recovering demand has outstripped supply. Coupled with a potential structural shift higher in inflation in the coming years, we continue to think commodities provide a better inflation hedge than most other asset classes.
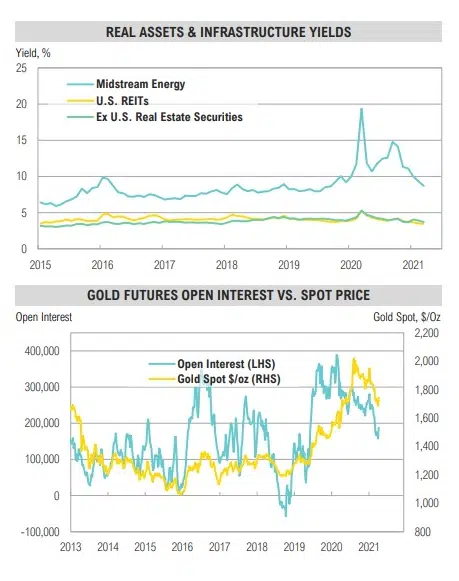
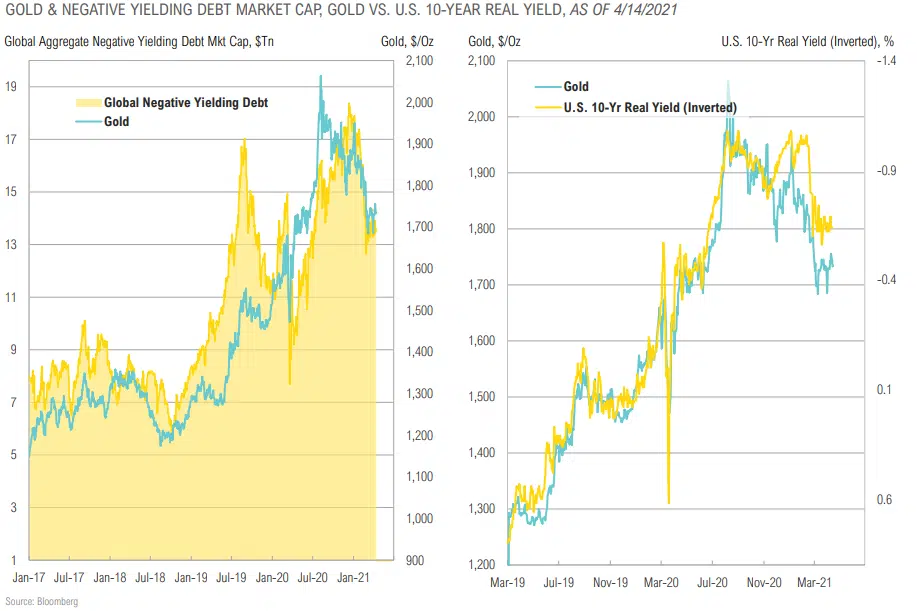
- Gold continues to trade as a proxy for real rates. If inflation picks up and bond yields do not keep pace, gold should perform well.
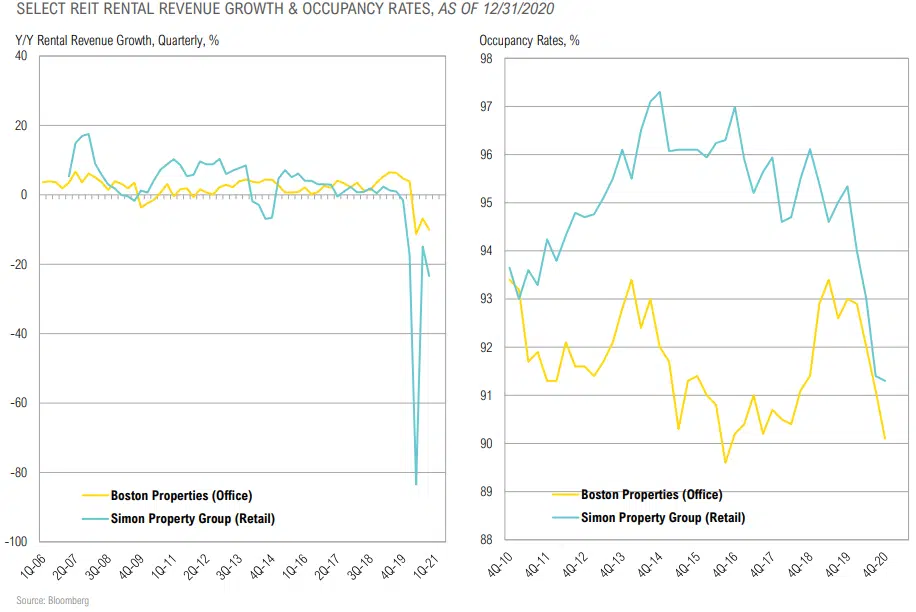
- Commercial real estate is at the epicenter of redefining normal as we exit the Covid-19 crisis. Shifts in corporate headquarters, flight from urban areas and flexible work environments foster continued uncertainty.
- Opportunities are emerging in public and private markets as some sectors (industrial, warehouse/ fulfillment) are booming and others are in deep distress (retail, entertainment, hospitality and office).
- The energy space has shifted from oversupply to undersupply after the shock of the COVID-19 crisis.
- According to the Energy Information Administration, U.S. oil production is currently down 13% from pre-Covid levels.
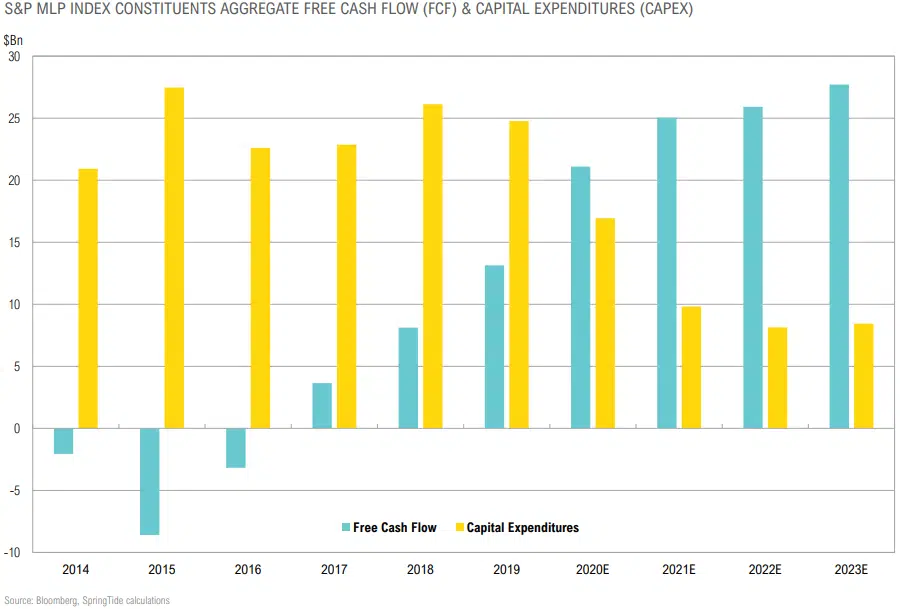
- The midstream space has dramatically cut capex which should allow free cash flow to continue to grow, as it did in 2020
Inflation Case Study: Falling Housing Inventories, Rising Construction Costs Are Squeezing Prices Higher
Gold Still Viewed as an Alternative Safe Haven
Gold & Silver Miners Generating Substantial Free Cash Flow
MLPs Expected to Continue Capex Cuts, Grow FCF
Market Expectations for U.S. REITs vs. Trailing 12-Months
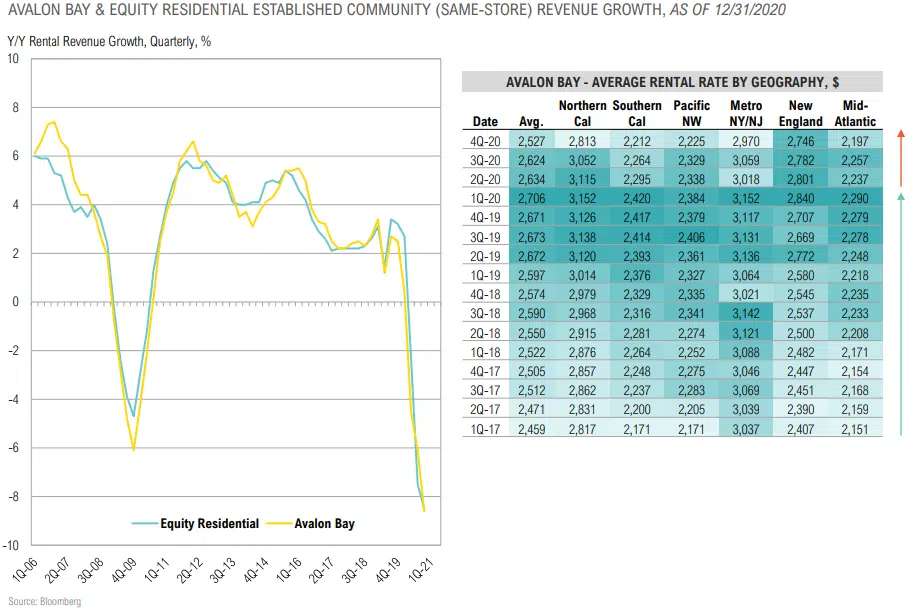
CRE Rental Revenues and Occupancy Rates Remain Challenged
Coastal Property Rental Revenues Continued Decline in 4Q
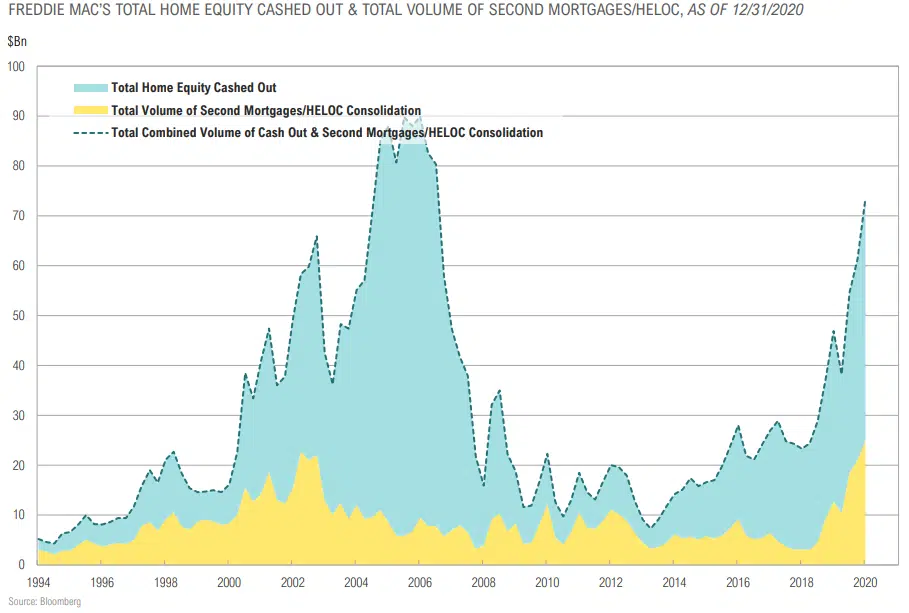
Rising Second Mortgages & Home Equity Withdrawals
Major Increase in Most Commodity Prices for the Past Year
OPPORTUNISTIC
“If the financial system has a defect, it is that it reflects and magnifies what we human beings are like. Money amplifies our tendency to overreact, to swing from exuberance when things are going well to deep depression when they go wrong. Booms and busts are products, at root, of our emotional volatility.”
-Niall Ferguson, Historian & Fellow at Hoover Institution
Opportunistic Strategy Returns
Opportunistic Strategies Summary
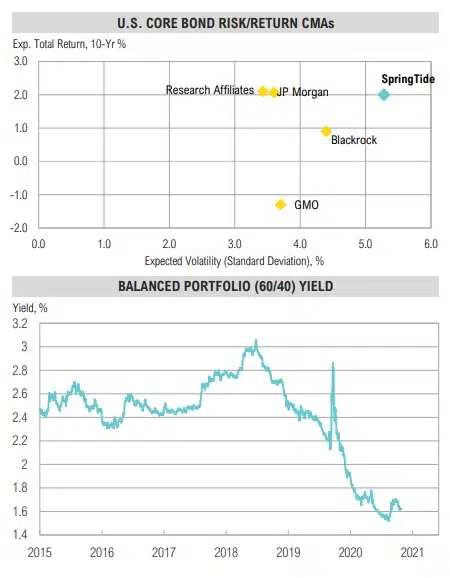
- The yield on a diversified portfolio of global stocks and U.S. bonds rose modestly to 1.6%, near an all-time low.
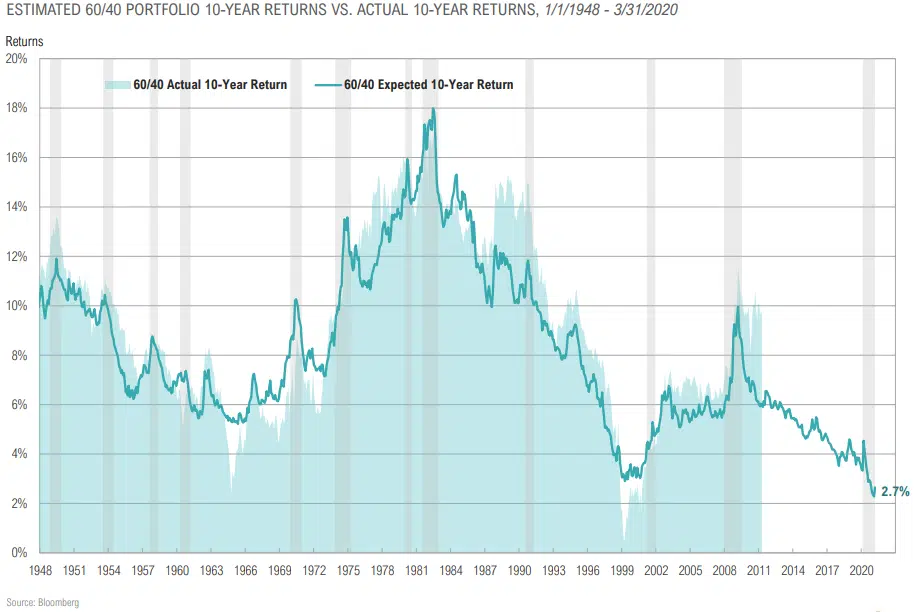
- Near record low hurdle rate/opportunity cost of U.S. and global balanced portfolios (expected 10-year returns of 2.1% and 2.4%, respectively) and higher expected volatility are somewhat offset by higher fees.
- Higher volatility bodes well for high-quality manager alphas, but manager selection remains crucial.
- Despite low opportunity cost, high fees need to be considered carefully; however, the “riches are in the niches” – high quality boutique managers have the potential to add value given expected higher volatility.
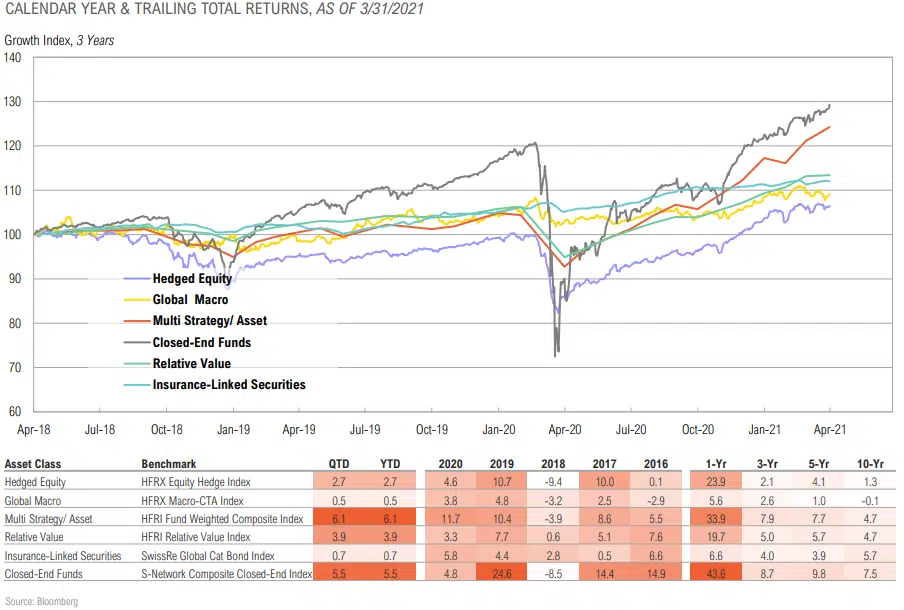
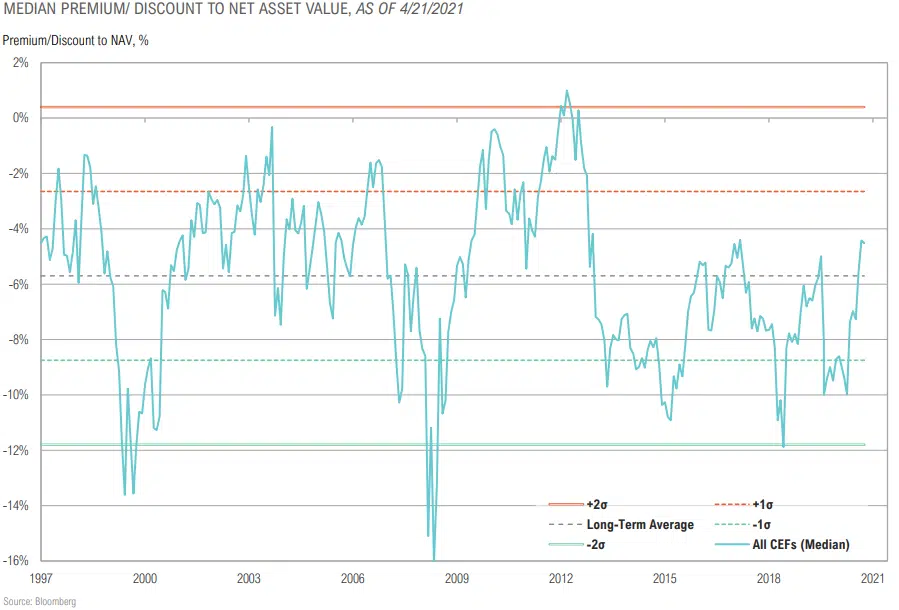
- Closed-end funds rallied (+5.5%), bringing trailing one-year returns to 43.6%. Average discounts narrowed by 2.8%, from – 7.3% to -4.5%, which is now above the long-term average of – 5.7%.
- Other opportunistic and alternative categories showed mixed performance in Q1, with global macro and insurance-linked securities trailing a global balanced (60/40) portfolio while quity-centric strategies generally outperforming.
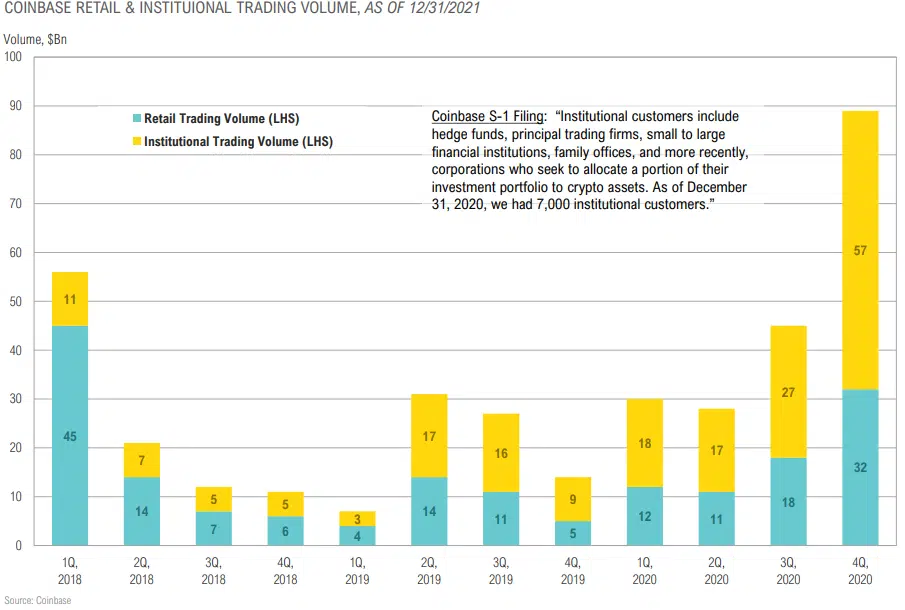
Institutions Join the Crypto Party
Average Closed-End Fund Discount Back Above Median
ASSET ALLOCATION
“High up on his list and sooner rather than later, will be dealing with the consequences of the biggest financial bubble in U.S. history. Why the biggest? Because it encompasses not just stocks but pretty much every other financial asset too. And for that, you may thank the Federal Reserve.”
-Richard Cookson, Bloomberg, February 4, 2021
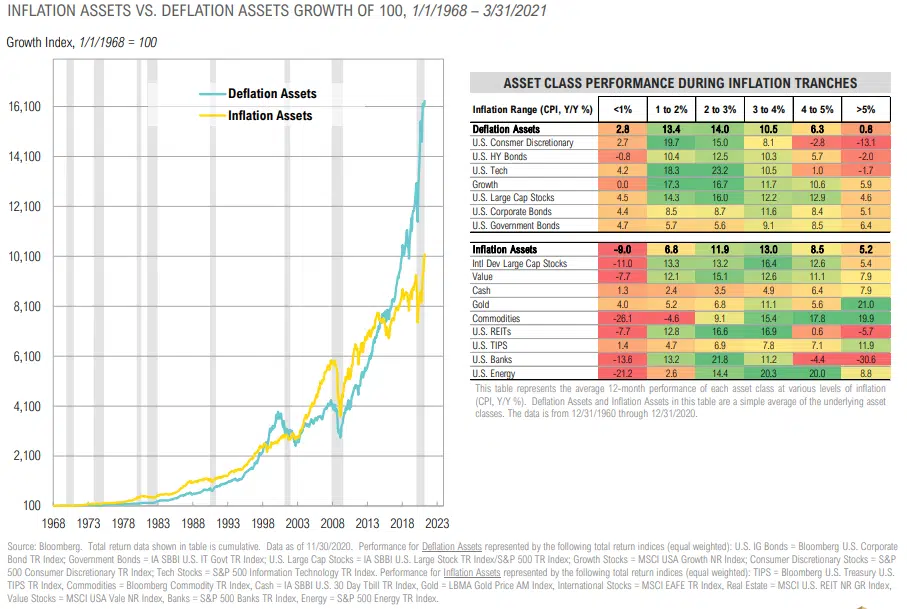
Time to Tilt from Deflation to Inflation Assets
Expected Returns for Passive “60/40” Portfolio Near All-Time Low
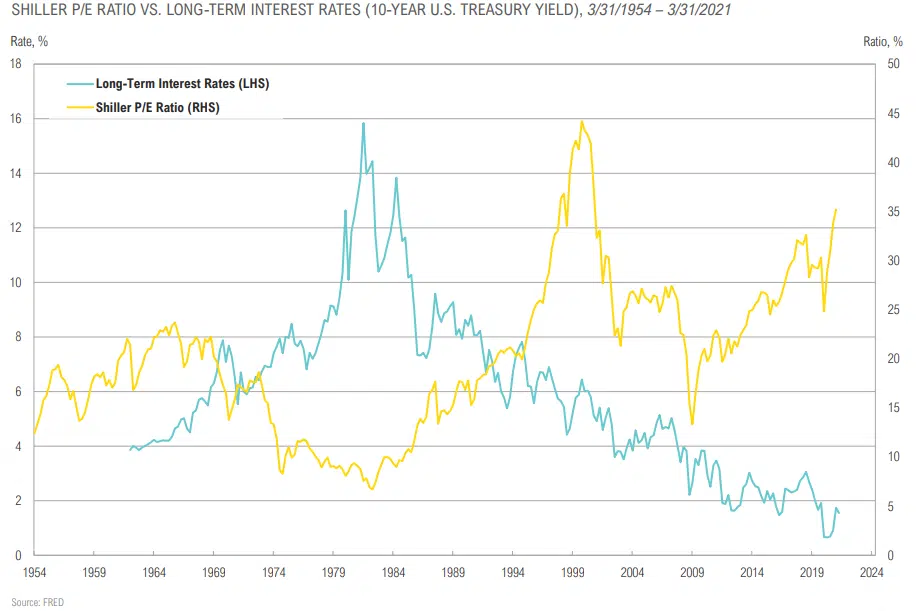
Valuations in the Context of Yields
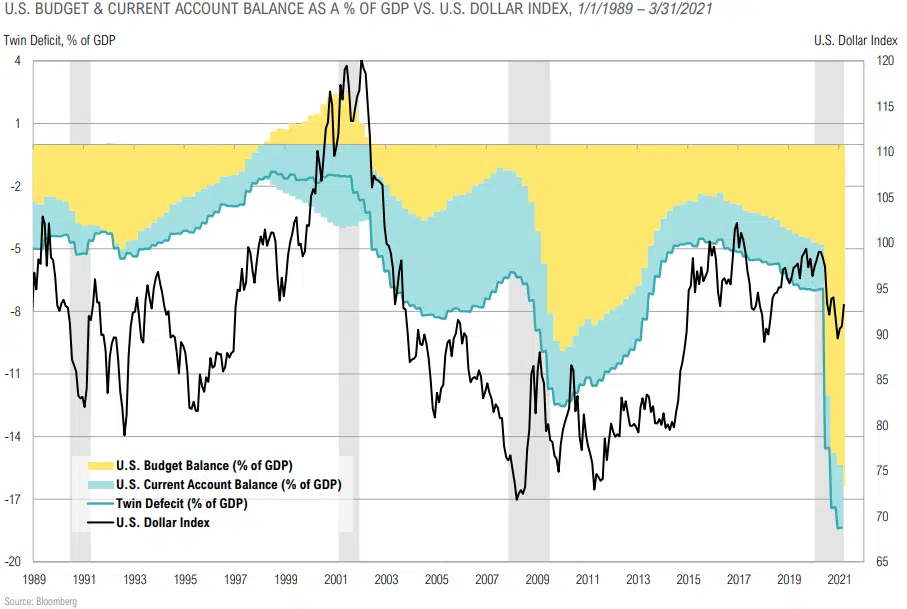
Growing Twin Deficit = Major Headwind for USD
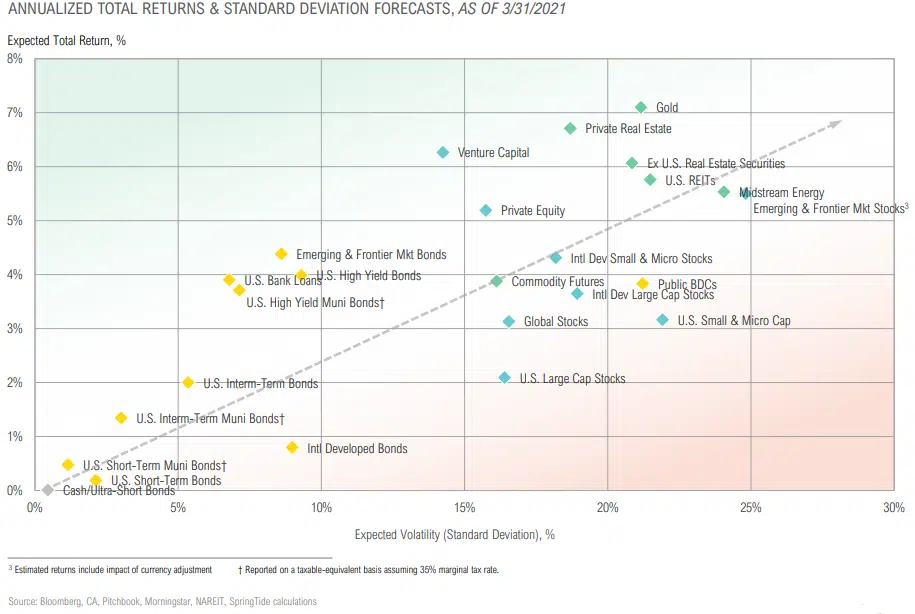
Asset Class Returns & Volatility – Strategic Forecasts