Overview
Just as COVID-19 seemingly receded to the point that we could emerge in a new normal, Russian forces invaded Ukraine on February 24. Equities, which were already negative for the year, initially moved even lower while commodities added to their gains, fueled by concerns over supply chain issues and access to critical raw materials. Fears that inflation, already at uncomfortable levels, could surge even higher kept investors from seeking safety in fixed income securities and drove bond yields up significantly.
Following the invasion, equities rallied throughout most of March, which mitigated losses for the quarter. The S&P 500 ended the quarter down 4.6% while a global measure of stocks, the MSCI All Country World Index, dropped by 5.4%. Bonds have typically provided investors with a ballast against equity drawdowns, but not this quarter. The Bloomberg U.S. Aggregate Bond Index dropped 5.9%. For the first time since the first quarter of 2018 and just the second occurrence since the global financial crisis, both the S&P 500 and the Bloomberg U.S. Aggregate indexes finished the quarter in negative territory. The U.S. 10-year Treasury yield rose 87 basis points over the quarter from 1.51% to 2.38%, its highest level since May 2019.
Commodities were the big winners in the quarter, returning 25.5% as measured by the Bloomberg Commodity Index. Idiosyncratic supply chain issues, exacerbated by the strategic role both Russia and Ukraine play in global resource markets, drove many individual commodities up substantially – nickel (+55%), natural gas (+51%), WTI crude oil (+33%), wheat (+30%), and corn (+26%) each jumped more than 25%. Food and energy commodities, items that significantly affect the lives and pocketbooks of global consumers, are at the heart of this conflict. Russia provides 17% of the world’s natural gas and 12% of its oil,1 and Russia and Ukraine generate roughly 34% of global wheat traded.2 With Russia only committing to exporting to friendly nations and Ukraine trying to execute planting season amidst a war, the price of wheat jumped by 30%. Input costs, such as fertilizer, have also risen dramatically and now sit at levels not seen since 2008 when oil prices were over $150 per barrel.3 The war has caused other countries to turn inward and limit their exports. In mid-March, for example, Indonesia, the world’s largest producer and exporter of palm oil, more than doubled its maximum levy on palm oil exports so that it could subsidize domestic prices and distribute more than 200 million liters of the commodity across the country each month.4
Western countries responded to Russia’s military aggression with economic warfare – several rounds of financial sanctions that were increasingly severe and focused on undercutting Russia’s economy. As a result, Russia’s currency, the ruble, imploded in value. At the time, President Joe Biden correctly cited this as an example of the economic hardship Russia would face as a result of the invasion.5 Russia might have taken comfort in its $600 billion war chest of foreign exchange reserves, but in an unprecedented move, countries around the world confiscated these assets.6 Even Switzerland, traditionally a neutral haven in times of war, froze Russian financial assets, including those of Vladimir Putin, Prime Minister Mikhail Mishustin, and Foreign Minister Sergey Lavrov.6 Notably, Russia had already sold the majority of its U.S. Treasury holdings in 2018 and retained only approximately $5 billion in total exposure.7,8
The initial decline in the ruble was severe: -48% from where it started the year. In response, Russia raised domestic interest rates from 9.5% to 20%.9 Russian authorities also capped the amount of dollars that residents could withdraw from foreign-currency bank accounts and barred banks from selling foreign exchange to customers for six months.10 Western sanctions exempted Russian energy, which European countries depend on, and those transactions continued to occur in foreign currencies.11 Putin then announced that foreign nations that aligned themselves with Ukraine must buy Russian gas with rubles, gold, or bitcoin rather than dollars and euros, thereby forcing sanctioning nations to support the Russian currency.12The ruble rallied 71% from its March 7 low, and by the end of the month it had shockingly increased by 3.8% since the February 24 invasion.

Market Commentary
Market Commentary – Q1, 2022
A Nickel for Your Thoughts
Overview
Just as COVID-19 seemingly receded to the point that we could emerge in a new normal, Russian forces invaded Ukraine on February 24. Equities, which were already negative for the year, initially moved even lower while commodities added to their gains, fueled by concerns over supply chain issues and access to critical raw materials. Fears that inflation, already at uncomfortable levels, could surge even higher kept investors from seeking safety in fixed income securities and drove bond yields up significantly.
Following the invasion, equities rallied throughout most of March, which mitigated losses for the quarter. The S&P 500 ended the quarter down 4.6% while a global measure of stocks, the MSCI All Country World Index, dropped by 5.4%. Bonds have typically provided investors with a ballast against equity drawdowns, but not this quarter. The Bloomberg U.S. Aggregate Bond Index dropped 5.9%. For the first time since the first quarter of 2018 and just the second occurrence since the global financial crisis, both the S&P 500 and the Bloomberg U.S. Aggregate indexes finished the quarter in negative territory. The U.S. 10-year Treasury yield rose 87 basis points over the quarter from 1.51% to 2.38%, its highest level since May 2019.
Commodities were the big winners in the quarter, returning 25.5% as measured by the Bloomberg Commodity Index. Idiosyncratic supply chain issues, exacerbated by the strategic role both Russia and Ukraine play in global resource markets, drove many individual commodities up substantially – nickel (+55%), natural gas (+51%), WTI crude oil (+33%), wheat (+30%), and corn (+26%) each jumped more than 25%. Food and energy commodities, items that significantly affect the lives and pocketbooks of global consumers, are at the heart of this conflict. Russia provides 17% of the world’s natural gas and 12% of its oil,1 and Russia and Ukraine generate roughly 34% of global wheat traded.2 With Russia only committing to exporting to friendly nations and Ukraine trying to execute planting season amidst a war, the price of wheat jumped by 30%. Input costs, such as fertilizer, have also risen dramatically and now sit at levels not seen since 2008 when oil prices were over $150 per barrel.3 The war has caused other countries to turn inward and limit their exports. In mid-March, for example, Indonesia, the world’s largest producer and exporter of palm oil, more than doubled its maximum levy on palm oil exports so that it could subsidize domestic prices and distribute more than 200 million liters of the commodity across the country each month.4
Western countries responded to Russia’s military aggression with economic warfare – several rounds of financial sanctions that were increasingly severe and focused on undercutting Russia’s economy. As a result, Russia’s currency, the ruble, imploded in value. At the time, President Joe Biden correctly cited this as an example of the economic hardship Russia would face as a result of the invasion.5 Russia might have taken comfort in its $600 billion war chest of foreign exchange reserves, but in an unprecedented move, countries around the world confiscated these assets.6 Even Switzerland, traditionally a neutral haven in times of war, froze Russian financial assets, including those of Vladimir Putin, Prime Minister Mikhail Mishustin, and Foreign Minister Sergey Lavrov.6 Notably, Russia had already sold the majority of its U.S. Treasury holdings in 2018 and retained only approximately $5 billion in total exposure.7,8
The initial decline in the ruble was severe: -48% from where it started the year. In response, Russia raised domestic interest rates from 9.5% to 20%.9 Russian authorities also capped the amount of dollars that residents could withdraw from foreign-currency bank accounts and barred banks from selling foreign exchange to customers for six months.10 Western sanctions exempted Russian energy, which European countries depend on, and those transactions continued to occur in foreign currencies.11 Putin then announced that foreign nations that aligned themselves with Ukraine must buy Russian gas with rubles, gold, or bitcoin rather than dollars and euros, thereby forcing sanctioning nations to support the Russian currency.12The ruble rallied 71% from its March 7 low, and by the end of the month it had shockingly increased by 3.8% since the February 24 invasion.
Russia’s invasion also added insult to injury in terms of inflation concerns. In February, the Consumer Price Index was up 7.9% on a year-over-year basis, reaching an almost 40- year high, and this reading did not yet include the effects of the Russian invasion. The March reading, which did incorporate the effects of the invasion, hit 8.5%, its highest since 1981. Before the war in Ukraine, markets were anticipating six interest rate hikes from the Federal Reserve in 2022. By the end of March, markets were anticipating ten hikes, signaling an expectation that inflation would persist.
The Federal Reserve, which was already falling far behind the tightening curve before Russia’s invasion, found itself in an uncomfortable predicament. Minneapolis Federal Reserve President, Neil Kashkari, summed up the environment well in a recent piece:
“We do know that the wealth effect is a real phenomenon, and both the stock market and house prices are up roughly 30% relative to pre-pandemic levels, even households who don’t own stocks or homes have on average stronger balance sheets than before the pandemic. Perhaps this is leading people to be more confident and simply spend more. Either way, the FOMC must act to bring the economy back into balance.”13
Because it can do little to improve the supply-side side constraints on commodity markets and global supply chains, the Federal Reserve seems focused instead on reducing demand by engineering an economic slowdown, a move that is justified by more than just inflation metrics. The most recent jobs report showed an unemployment rate of 3.6%, an unambiguously strong number and a dramatic improvement from the depths of the COVID-19 crisis two years ago. However, real GDP growth is already expected to slow substantially. The Atlanta Fed’s GDPNow model is estimating first quarter GDP growth to be 1%.14
The Nickel Market
The nickel market offers one of the best representations of the difficulties caused by recent geopolitical events. The London Metal Exchange (LME) halted nickel futures trading on the morning of March 8, after prices doubled overnight to over $100,000 per ton. This astonishing rally was due to a “short squeeze” on nickel producers who were using futures contracts to hedge their exposure to the commodity.15 The exchange decided to cancel all trades from midnight to 8:15 AM local time on March 8, reverting prices to the March 7 closing price of $48,211 per ton. In addition, the LME placed an indefinite halt on futures trading to try to stabilize the extreme volatility. Finally, on March 16, almost ten days later, trading resumed, but new limits prevented prices from swinging more than 5 to 8% in either direction, depending on the day.16 After reopening, futures
dropped the newly maximum allowed amount on four consecutive days for a cumulative drop of 46% before rising 38% over the next three days.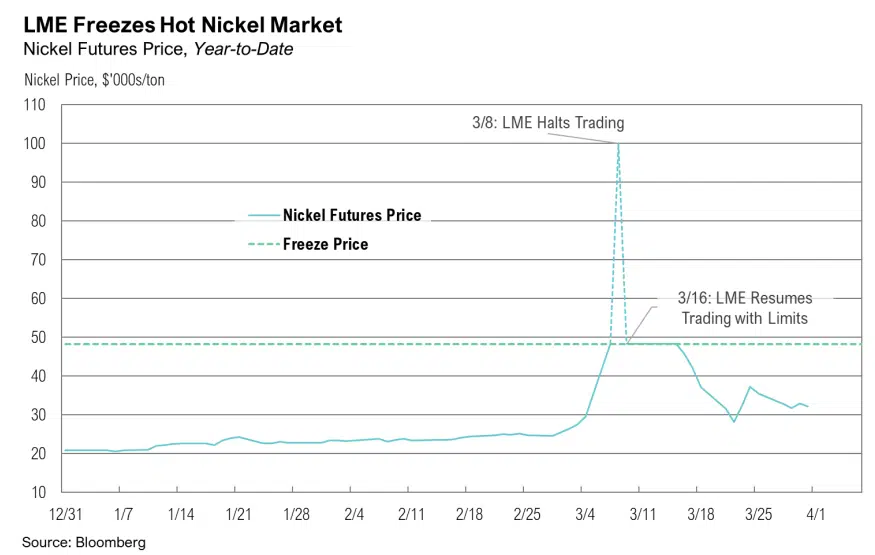
The larger effect of this dizzying volatility was higher prices for another commodity that plays an important role in global supply chains because of its use in producing items such as electronic vehicle batteries and medical equipment. Given that Russia accounts for approximately 11% of global nickel production,17 the situation could become even more unstable if Russia limits its exports to countries that it deems hostile. As the story of nickel’s volatility makes clear, supply chain complexities could make it difficult for countries to distance themselves from Russian influence.
Markets
Within equities, small caps underperformed larger companies, falling 7.5% as measured by the Russell 2000 Index. From a style perspective, value stocks, measured by the Russell 1000 Value Index, outperformed the Russell 1000 Growth Index -0.7% to -9.0%. Growth stocks tend to have longer duration cash flows, leading to poor performance when interest rates rise. Value’s dominance was even more pronounced within small-cap stocks, as the Russell 2000 Value Index fell just 2.4% compared to a decline of 12.6% for the Russell 2000 Growth Index. From a sector perspective, energy was one of the only bright spots, returning an outstanding 39%. Oil prices served as a major tailwind, as WTI crude oil prices rose from $75 to $100/barrel throughout the quarter. Other positives were defensive areas of the market such as utilities, up 4.8%, and consumer staples, down just 1.3%. All other sectors had negative returns. Among the worst were growth-oriented sectors, including technology (-8.5%), consumer discretionary (-9.4%), and communication services (-11.3%).
Stocks outside of the U.S. trailed their U.S. counterparts during the quarter. Foreign developed market equity returns, as measured by the MSCI EAFE Index, fell 5.8% in U.S. dollar terms. The MSCI Emerging Markets Index fared even worse, down 6.9% in U.S. dollar terms. In addition to inflation and rising interest rates, the Russia/Ukraine conflict significantly affected market returns internationally. Countries with more exposure to Russian trade underperformed due to the retaliatory sanctions. Stocks in China, which is Russia’s biggest trading partner and accounts for 18% of Russia’s gross exports,18 fell 14.2%. Germany, which is Russia’s second-biggest trading partner and relies on Russia for 65% of its natural gas imports, saw its equities fall 12.9%.
Within fixed income securities, short-term bonds outperformed longer-term bonds as the Bloomberg U.S. Aggregate 1-3 Year Index fell 2.5%. High yield bonds also outperformed, falling only 4.8%, due to their ability to generate income in rising rate environments. Non-U.S. bonds underperformed their U.S. counterparts due to interest rate hikes and poor currency returns. International developed and emerging market bonds finished the quarter down 7.1% and 10.0%, respectively. The inflation and central bank interest rate dynamic in Europe is very similar to the U.S. The most recent inflation reading was 7.5% on a year-over-year basis while the European Central Bank is holding its benchmark interest rate at 0%.19
Looking Forward
If we could read the minds of Vladimir Putin and Fed Chairman Jerome Powell, it would be significantly easier to allocate capital for the rest of 2022, but we cannot. Inflation remains the critical determinant for both economic growth and asset prices, and its trajectory remains uncertain. Although inflation is expected to gradually and organically decline during the year, the Federal Reserve may be able to slow it even more quickly via a demand shock, but Putin could thwart its efforts by extending the war. Further, with interest rates rising so rapidly, the risks of the Federal Reserve doing too little may outweigh the risks of it doing too much.
As profoundly uncertain as the future is, such turmoil can provide opportunities, and we remain focused on analyzing incoming data to find avenues to deploy capital more efficiently and productively.
Performance Disclosures
All market pricing and performance data from Bloomberg, unless otherwise cited. Asset class and sector performance are gross of fees unless otherwise indicated.
Citations
Share it :
Disclaimer
Magnus Financial Group LLC (“Magnus”) did not produce and bears no responsibility for any part of this report whatsoever, including but not limited to any microeconomic views, inaccuracies or any errors or omissions. Research and data used in the presentation have come from third-party sources that Magnus has not independently verified presentation and the opinions expressed are not by Magnus or its employees and are current only as of the time made and are subject to change without notice.
This report may include estimates, projections or other forward-looking statements, however, due to numerous factors, actual events may differ substantially from those presented. The graphs and tables making up this report have been based on unaudited, third-party data and performance information provided to us by one or more commercial databases. Except for the historical information contained in this report, certain matters are forward looking statements or projections that are dependent upon risks and uncertainties, including but not limited to factors and considerations such as general market volatility, global economic risk, geopolitical risk, currency risk and other country-specific factors, fiscal and monetary policy, the level of interest rates, security-specific risks, and historical market segment or sector performance relationships as they relate to the business and economic cycle.
Additionally, please be aware that past performance is not a guide to the future performance of any manager or strategy, and that the performance results and historical information provided displayed herein may have been adversely or favorably impacted by events and economic conditions that will not prevail in the future. Therefore, it should not be inferred that these results are indicative of the future performance of any strategy, index, fund, manager or group of managers. Index benchmarks contained in this report are provided so that performance can be compared with the performance of well-known and widely recognized indices. Index results assume the re-investment of all dividends and interest and do not reflect any management fees, transaction costs or expenses.
The information provided is not intended to be, and should not be construed as, investment, legal or tax advice nor should such information contained herein be construed as a recommendation or advice to purchase or sell any security, investment, or portfolio allocation. An investor should consult with their financial advisor to determine the appropriate investment strategies and investment vehicles. Investment decisions should be made based on the investor’s specific financial needs and objectives, goals, time horizon and risk tolerance. This presentation makes no implied or express recommendations concerning the way any client’s accounts should or would be handled, as appropriate investment decisions depend upon the client’s specific investment objectives.
Investment advisory services offered through Magnus; securities offered through third party custodial relationships. More information about Magnus can be found on its Form ADV at www.adviserinfo.sec.gov.
Terms of Use
Definitions
Asset class performance was measured using the following benchmarks: U.S. Large Cap Stocks: S&P 500 TR Index; U.S. Small & Micro Cap: Russell 2000 TR Index; Intl Dev Large Cap Stocks: MSCI EAFE GR Index; Emerging & Frontier Market Stocks: MSCI Emerging Markets GR Index; U.S. Intermediate-Term Muni Bonds: Bloomberg Barclays 1-10 (1-12 Yr) Muni Bond TR Index; U.S. Intermediate-Term Bonds: Bloomberg Barclays U.S. Aggregate Bond TR Index; U.S. High Yield Bonds: Bloomberg Barclays U.S. Corporate High Yield TR Index; U.S. Bank Loans: S&P/LSTA U.S. Leveraged Loan Index; Intl Developed Bonds: Bloomberg Barclays Global Aggregate ex-U.S. Index; Emerging & Frontier Market Bonds: JPMorgan EMBI Global Diversified TR Index; U.S. REITs: MSCI U.S. REIT GR Index, Ex U.S. Real Estate Securities: S&P Global Ex-U.S. Property TR Index; Commodity Futures: Bloomberg Commodity TR Index; Midstream Energy: Alerian MLP TR Index; Gold: LBMA Gold Price, U.S. 60/40: 60% S&P 500 TR Index; 40% Bloomberg Barclays U.S. Aggregate Bond TR Index; Global 60/40: 60% MSCI ACWI GR Index; 40% Bloomberg Barclays Global Aggregate Bond TR Index.