Digital assets performed exceptionally well in July, increasing 9.8% as measured by the MVIS Crypto Compare Digital Assets 25 index, a broad proxy for the 25 largest cryptocurrencies. Highlighting two of the top cryptocurrencies, bitcoin rallied 18.1%, and ether, the native cryptocurrency of the Ethereum network, rose 11.4%. The cryptocurrency rally started on July 20 in anticipation of the “The B-Word” Bitcoin conference taking place the next day. The conference keynotes, all well-known and public bitcoin enthusiasts, included Tesla CEO Elon Musk, Twitter CEO Jack Dorsey, and ARK Invest founder Cathie Wood. According to its website, the purpose of the conference was to “demystify and destigmatize mainstream narratives about Bitcoin, explain how institutions can embrace it, and raise awareness around areas of the network that need support.” 3 At the conference, Musk announced that Tesla will likely start accepting bitcoin for vehicle purchases again after suspending the form of payment in May out of concern over the “rapidly increasing use of fossil fuels for bitcoin mining.”4 He went on to explain the reversal was due to the shutdown of mining operations using “heavy-duty coal plants…especially in China.” Bitcoin finished the day 8% higher than the prior day’s low.
On July 23, just two days later, a job posting for a “Digital Currency and Blockchain Product Lead” was discovered on Amazon’s website. The posting sparked frenzied speculation over whether the e-commerce giant was going to start accepting cryptocurrency as a form of payment.5 After denying a rumor that it would start accepting cryptocurrencies this year, Amazon released the following statement: 6
“We are inspired by the innovation happening in the cryptocurrency space and are exploring what this could look like on Amazon. We believe the future will be built on new technologies that enable modern, fast, and inexpensive payments, and hope to bring that future to Amazon customers as soon as possible.”7
Whether this is just an exploration or a serious-minded foray into digital payments remains to be seen, but by the time the dust had settled on July 27, Bitcoin was 20% higher than before the posting.

Market Commentary
Market Commentary – July, 2021
Crypto, Corporate Earnings & COVID
In July, longer term bonds outperformed short-term bonds, while U.S. growth stocks, led by the technology sector, returned 2.9%, beating their value counterparts by 3%.
Overview
Treasury yields fell sharply in July, as fears of higher inflation, which had dominated investing discussions for months, began to dissipate. The U.S. 10-year Treasury yield fell below 1.2% for the first time since February 2021 and closed the month at 1.24%, a drop of 21 basis points from the start of the month. Interest-rate-sensitive assets rallied. Longer term bonds outperformed short-term bonds, while U.S. growth stocks, led by the technology sector, returned 2.9%, beating their value counterparts by 3%. Growth stocks are generally considered to benefit more than their value counterparts during periods of declining rates. U.S. real estate investment trusts (REITs) gained 4.9%, as their yields declined to 2.1%, near the lowest level ever. Despite lower inflation expectations, gold bounced back modestly after a disappointing June, rising 4.0%.
After months of low crude inventories pushed oil prices higher, energy assets were hit hard in July by fears of declining demand as coronavirus cases surged. Crude oil was down 3.9% for the month, sending energy stocks and midstream investments down 8.4% and 6.3%, respectively. Although overall crude inventories remain low, data from the Energy Information Administration revealed sharply declining exports, indicating that the drop in demand is most likely driven by lower travel activity outside the United States.1 Emerging and frontier market equities also performed poorly over the month, dropping 6.7%. Chinese equities generated particularly weak returns due to increased government scrutiny in the private sector, falling 14%.2
Digital assets performed exceptionally well in July. The rally started on July 20 in anticipation of the “The BWord” Bitcoin conference which included keynote speakers such as Tesla CEO Elon Musk, Twitter CEO Jack Dorsey, and ARK Invest founder Cathie Wood.
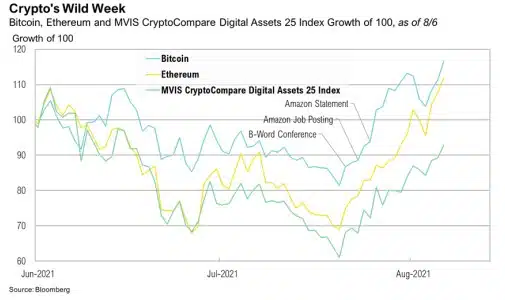
Crypto's Wild Week
Digital assets performed exceptionally well in July, increasing 9.8% as measured by the MVIS Crypto Compare Digital Assets 25 index, a broad proxy for the 25 largest cryptocurrencies. Highlighting two of the top cryptocurrencies, bitcoin rallied 18.1%, and ether, the native cryptocurrency of the Ethereum network, rose 11.4%. The cryptocurrency rally started on July 20 in anticipation of the “The B-Word” Bitcoin conference taking place the next day. The conference keynotes, all well-known and public bitcoin enthusiasts, included Tesla CEO Elon Musk, Twitter CEO Jack Dorsey, and ARK Invest founder Cathie Wood. According to its website, the purpose of the conference was to “demystify and destigmatize mainstream narratives about Bitcoin, explain how institutions can embrace it, and raise awareness around areas of the network that need support.” 3 At the conference, Musk announced that Tesla will likely start accepting bitcoin for vehicle purchases again after suspending the form of payment in May out of concern over the “rapidly increasing use of fossil fuels for bitcoin mining.”4 He went on to explain the reversal was due to the shutdown of mining operations using “heavy-duty coal plants…especially in China.” Bitcoin finished the day 8% higher than the prior day’s low.
On July 23, just two days later, a job posting for a “Digital Currency and Blockchain Product Lead” was discovered on Amazon’s website. The posting sparked frenzied speculation over whether the e-commerce giant was going to start accepting cryptocurrency as a form of payment.5 After denying a rumor that it would start accepting cryptocurrencies this year, Amazon released the following statement: 6
“We are inspired by the innovation happening in the cryptocurrency space and are exploring what this could look like on Amazon. We believe the future will be built on new technologies that enable modern, fast, and inexpensive payments, and hope to bring that future to Amazon customers as soon as possible.”7
Whether this is just an exploration or a serious-minded foray into digital payments remains to be seen, but by the time the dust had settled on July 27, Bitcoin was 20% higher than before the posting.
According to FactSet, by the end of July, companies in the S&P 500 Index reported their highest year-over-year earnings growth since the fourth quarter of 2009.
Earnings Explosion
By the end of July, 59% of the companies in the S&P 500 had reported earnings for the second quarter, and results were overwhelmingly positive. According to FactSet, companies in the S&P 500 Index reported their highest year-over-year earnings growth since the fourth quarter of 2009, during the global financial crisis recovery.8 Although the size of this earnings growth is heavily influenced by the lower earnings base set during the coronavirus crisis a year ago, the breadth and magnitude of earnings surprises demonstrate how impressive the economic snapback has been. Of the companies that have reported, 88% reported earnings that exceeded expectations—a considerable step up from the five-year average of 75%. If these kinds of results continue throughout this earnings season, it will mark the highest percentage of positive surprises in an earnings season since FactSet started tracking this data in 2008. The magnitude of positive earnings is as remarkable as the breadth, too. In aggregate, companies in the S&P 500 are beating estimates by 17.2%, almost 10% higher than the five-year average of 7.8%.
The updated expected second-quarter earnings growth rate is a staggering 85.1%, up from an expected 63.1% just one short month ago. This again is the highest year-overyear earnings growth since 2009. The chart below shows the break-out by sector of earnings above, in-line, and below expectations.
All 11 sectors reported year over-year earnings growth. The sectors with the highest percentage of earnings surprises have been technology, health care, consumer discretionary, and communication services— mostly asset-light, growth oriented sectors.
The sectors with the highest percentage of earnings surprises have been technology, health care, consumer discretionary, and communication services—mostly asset-light, growth-oriented sectors. That said, all 11 sectors reported year-over-year earnings growth, and the sectors that were hardest hit a year ago—energy, industrials, and consumer discretionary—have led the recovery. At the individual company level, the biggest earnings surprises for the quarter belonged to Valero Energy, Twitter, V.F. Corporation, PNC Financial Services, and Hasbro; all of them more than doubled analyst estimates.8 From a revenue perspective, 88% of S&P 500 companies reported revenues above estimates, also crushing the five-year average of 65%. In absolute terms, year-over-year revenue growth for the index is now projected to be 23.1%, which would be the highest since FactSet started publishing this data back in 2008.8
Looking ahead to the rest of 2021, analysts are projecting double-digit earnings growth for both the third and fourth quarters.8 Despite the impressive earnings season, the strong rally in stocks has kept stock valuations near the higher end of historical ranges and well above averages. The forward 12-month price-to-earnings ratio (P/E) is 21.2x, considerably higher than the 10-year average of 16.2x.8
Looking Forward
With earnings exploding, inflation concerns abating, and vaccinations increasing across the globe, the proverbial “wall of worry” the stock market is said to climb seems to be getting smaller. But markets are forward looking, and as coronavirus cases rise, risks loom. As of August 3, the seven-day moving average of COVID-19 cases topped 90,000 in the U.S. for the first time since February.9 While that number is alarming, the seven-day average of the number of deaths, while sadly trending higher, remained 87% lower than the February peak. Looking forward, we will remain focused on hospitalizations and deaths as important metrics of pandemic recovery. We must also consider that the severity of, and reaction to, future coronavirus waves may be extremely varied across countries, regions, states, and even cities.
Performance Disclosures
All market pricing and performance data from Bloomberg, unless otherwise cited. Asset class and sector performance are gross of fees unless otherwise indicated.
Citations
Share it :
Disclaimer
Magnus Financial Group LLC (“Magnus”) did not produce and bears no responsibility for any part of this report whatsoever, including but not limited to any microeconomic views, inaccuracies or any errors or omissions. Research and data used in the presentation have come from third-party sources that Magnus has not independently verified presentation and the opinions expressed are not by Magnus or its employees and are current only as of the time made and are subject to change without notice.
This report may include estimates, projections or other forward-looking statements, however, due to numerous factors, actual events may differ substantially from those presented. The graphs and tables making up this report have been based on unaudited, third-party data and performance information provided to us by one or more commercial databases. Except for the historical information contained in this report, certain matters are forward looking statements or projections that are dependent upon risks and uncertainties, including but not limited to factors and considerations such as general market volatility, global economic risk, geopolitical risk, currency risk and other country-specific factors, fiscal and monetary policy, the level of interest rates, security-specific risks, and historical market segment or sector performance relationships as they relate to the business and economic cycle.
Additionally, please be aware that past performance is not a guide to the future performance of any manager or strategy, and that the performance results and historical information provided displayed herein may have been adversely or favorably impacted by events and economic conditions that will not prevail in the future. Therefore, it should not be inferred that these results are indicative of the future performance of any strategy, index, fund, manager or group of managers. Index benchmarks contained in this report are provided so that performance can be compared with the performance of well-known and widely recognized indices. Index results assume the re-investment of all dividends and interest and do not reflect any management fees, transaction costs or expenses.
The information provided is not intended to be, and should not be construed as, investment, legal or tax advice nor should such information contained herein be construed as a recommendation or advice to purchase or sell any security, investment, or portfolio allocation. An investor should consult with their financial advisor to determine the appropriate investment strategies and investment vehicles. Investment decisions should be made based on the investor’s specific financial needs and objectives, goals, time horizon and risk tolerance. This presentation makes no implied or express recommendations concerning the way any client’s accounts should or would be handled, as appropriate investment decisions depend upon the client’s specific investment objectives.
Investment advisory services offered through Magnus; securities offered through third party custodial relationships. More information about Magnus can be found on its Form ADV at www.adviserinfo.sec.gov.
Terms of Use
Definitions
Asset class performance was measured using the following benchmarks: U.S. Large Cap Stocks: S&P 500 TR Index; U.S. Small & Micro Cap: Russell 2000 TR Index; Intl Dev Large Cap Stocks: MSCI EAFE GR Index; Emerging & Frontier Market Stocks: MSCI Emerging Markets GR Index; U.S. Intermediate-Term Muni Bonds: Bloomberg Barclays 1-10 (1-12 Yr) Muni Bond TR Index; U.S. Intermediate-Term Bonds: Bloomberg Barclays U.S. Aggregate Bond TR Index; U.S. High Yield Bonds: Bloomberg Barclays U.S. Corporate High Yield TR Index; U.S. Bank Loans: S&P/LSTA U.S. Leveraged Loan Index; Intl Developed Bonds: Bloomberg Barclays Global Aggregate ex-U.S. Index; Emerging & Frontier Market Bonds: JPMorgan EMBI Global Diversified TR Index; U.S. REITs: MSCI U.S. REIT GR Index, Ex U.S. Real Estate Securities: S&P Global Ex-U.S. Property TR Index; Commodity Futures: Bloomberg Commodity TR Index; Midstream Energy: Alerian MLP TR Index; Gold: LBMA Gold Price, U.S. 60/40: 60% S&P 500 TR Index; 40% Bloomberg Barclays U.S. Aggregate Bond TR Index; Global 60/40: 60% MSCI ACWI GR Index; 40% Bloomberg Barclays Global Aggregate Bond TR Index.