As we move past the one-year anniversary of the initial COVID-19 shut-downs, inflation numbers—which are traditionally reported on a year-over-year basis—are starting to reflect the jarring juxtaposition between today’s economic environment and last spring’s.
According to the U.S. Bureau of Labor Statistics, the Consumer Price Index rose 4.2% for the year ending April 2021. This represented the largest year-over-year increase since September 2008. The increase was driven largely by food prices, which increased 2.4%, and energy prices, which rose 25.1%. While these numbers seem headline-worthy, they are partly the result of the anniversary effect of depressed prices from last year. That said, the anniversary effect cannot entirely explain the increased prices of many commodities that are critical to a wide range of economic activities.
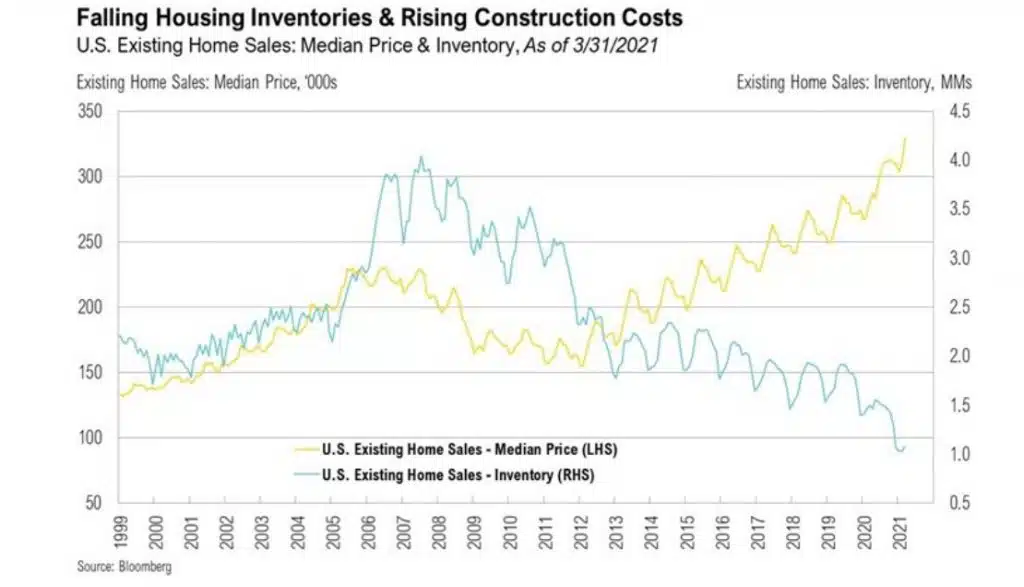
Few comparisons are as extreme—and evident to the average American—as the rise in lumber prices. Lumber, the generic term used to refer to a random length lumber futures contract (110 board feet in 2 inch by 4 inch pieces of varying lengths,6 has been squeezed by both increases in demand as well as severe supply disruptions. On the demand front, there’s the perfect storm of the mass migration out of cities into single family homes in lower density areas, combined with low interest rates and unusually strong personal incomes. On the supply side, lumber mills have been running at reduced capacity due to the pandemic, and they are struggling to keep up.7 Adding insult to injury, a pine-eating beetle has infested British Columbia, Canada, and shaved 5-7% off total U.S. lumber supply.8 The extreme dynamics in lumber are also impacting the housing market. Median home prices have increased by almost 20% in the U.S. while the inventory of homes for sale has hit an all-time low.9
Lumber is a quirky example, but it helps illustrate the downside of higher inflation and the corner policymakers have painted themselves into. If they continue to keep rates low, print enough electronic money via quantitative easing, purchase financial assets by the trillions, backstop bond markets, and even send stimulus checks directly to consumers, they will be able to manufacture growth and elevate the prices of various assets, both financial and real. However, money is fungible; you cannot control where it ends up. At some point, consumers—and markets—may view higher prices, especially in commodity prices, more dubiously.

Market Commentary
Market Commentary – April, 2021
Happy Anniversary, Inflation!
Risk assets continued to rally in April after one of the best 12-month periods in history.
Markets
Risky assets grinded higher in April as they digested one of the best 12-month periods in history. At the end of the month, most asset classes were sporting year-to-date returns that would be considered attractive for an entire year. The broad-based nature of the April returns, extending even to bonds, seems due to policymakers’ continued, extraordinary monetary and fiscal support.
Growth companies outperformed value companies during the month as the decline in interest rates helped their relative performance. After rising to 1.75% by the end of the first quarter, the 10-Year U.S. Treasury Yield finished April at 1.63%. The fact that the parabolic rise in yields took a break—and even declined slightly—helped push growth stocks higher. That’s because the discount rate is used in valuation calculations, and when it drops, it increases the present value of longer-duration growth assets. If interest rates continue to increase, it may once again favor value stock.
The Russell 1000 Growth Index, a measure of large cap growth stocks, gained nearly 7% in April. This leaves the index up nearly 8% for the year. Large cap value stocks rose approximately 4%, up nearly 16% so far in 2021. Small cap value and growth stocks both increased 2% in April. Year to date, small cap value stocks are up 24% while small cap growth stocks are up 7%. Returns outside the U.S. trailed the S&P 500 in April but were still decidedly positive for the month and year. The MSCI EAFE Index, a proxy for developed country equities, gained 3% in April and is up nearly 7% for the year. The MSCI Emerging Markets Index, a proxy for developing country equities, rose nearly 3% in April and is up 5% in 2021.
Commodity futures generated impressive returns for the month, up 8%, and are up 15% for the year. Municipal bonds, as measured by the Bloomberg Barclays Municipal 1-10 Year Bond Index, were up 0.5% in April, which pushed their year-to-date return into positive territory, albeit slightly at less than 1%. The BarCap U.S. Aggregate Bond Index, a measure of investment-grade taxable bonds, gained 0.8%, leaving it down nearly 3% for the year.
Biden announced several potentially material policy initiatives as part of the American Families Plan that include raising the federal minimum wage to $15 per hour, adding an additional $1.8 trillion stimulus program, and increasing the capital gains tax rate to 39.6% for individuals earning over $1 million.
Policy
On the eve of his hundredth day in office—April 28, 2021—President Biden announced several potentially material policy initiatives as part of the American Families Plan, including raising the federal minimum wage to $15 per hour, adding an additional $1.8 trillion stimulus program, and increasing the capital gains tax rate to 39.6% for individuals earning over $1 million.1 If passed into law, the top capital gains tax rate would then be at its highest since the 1920s.2
Broadly speaking, markets have so far shrugged off this news, likely for a few reasons. First, Biden’s initial numbers might indicate more of a starting point from which he can negotiate. Second, according to a recent Tax Policy Center report, only approximately 25% of the U.S. stock market is owned by U.S. investors outside of tax-deferred accounts.3 As such, the impact of a higher U.S. capital gains tax rate may be limited.
Finally, historical data suggest that both corporate tax and private capital gains tax rates have had a muted impact on either market performance or economic growth.4
Biden’s tax plan also proposed several changes to corporate tax rates, the most significant being an increase in the corporate tax rate from 21% to 28%. Here, too, historical data show little relationship between the corporate tax rate and stock market returns.5,9
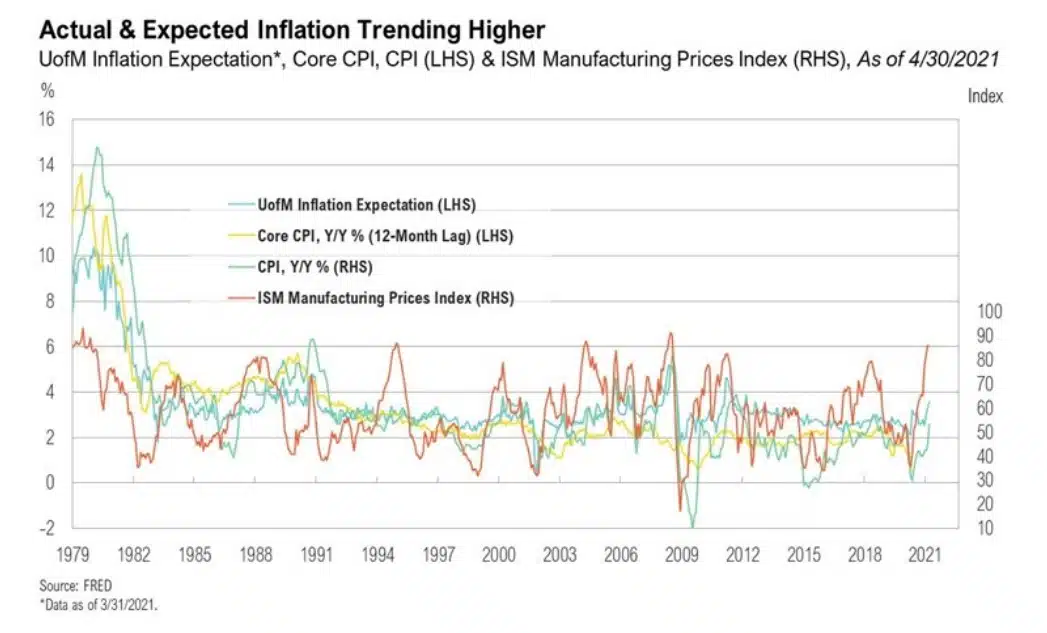
For the year ending April 2021, the Consumer Price Index rose 4.2% representing the largest year-over-year increase since September 2008.
Inflation
As we move past the one-year anniversary of the initial COVID-19 shut-downs, inflation numbers—which are traditionally reported on a year-over-year basis—are starting to reflect the jarring juxtaposition between today’s economic environment and last spring’s.
According to the U.S. Bureau of Labor Statistics, the Consumer Price Index rose 4.2% for the year ending April 2021. This represented the largest year-over-year increase since September 2008. The increase was driven largely by food prices, which increased 2.4%, and energy prices, which rose 25.1%. While these numbers seem headline-worthy, they are partly the result of the anniversary effect of depressed prices from last year. That said, the anniversary effect cannot entirely explain the increased prices of many commodities that are critical to a wide range of economic activities.
Few comparisons are as extreme—and evident to the average American—as the rise in lumber prices. Lumber, the generic term used to refer to a random length lumber futures contract (110 board feet in 2 inch by 4 inch pieces of varying lengths,6 has been squeezed by both increases in demand as well as severe supply disruptions. On the demand front, there’s the perfect storm of the mass migration out of cities into single family homes in lower density areas, combined with low interest rates and unusually strong personal incomes. On the supply side, lumber mills have been running at reduced capacity due to the pandemic, and they are struggling to keep up.7 Adding insult to injury, a pine-eating beetle has infested British Columbia, Canada, and shaved 5-7% off total U.S. lumber supply.8 The extreme dynamics in lumber are also impacting the housing market. Median home prices have increased by almost 20% in the U.S. while the inventory of homes for sale has hit an all-time low.9
Lumber is a quirky example, but it helps illustrate the downside of higher inflation and the corner policymakers have painted themselves into. If they continue to keep rates low, print enough electronic money via quantitative easing, purchase financial assets by the trillions, backstop bond markets, and even send stimulus checks directly to consumers, they will be able to manufacture growth and elevate the prices of various assets, both financial and real. However, money is fungible; you cannot control where it ends up. At some point, consumers—and markets—may view higher prices, especially in commodity prices, more dubiously.
Looking Forward
Over the past year, the U.S. economy and capital markets have benefited from exploding money supply growth, historically low interest rates, unprecedented monetary policy support, and massive fiscal stimulus, including direct stimulus checks to consumers. For perspective, current transfer payments from the federal government now account for 21% of all U.S. personal income.10 This tidal wave of stimulus has been incredibly positive for assets markets; however, as the money begins to flow into the real economy, the prices of goods and services are starting to increase—in some cases substantially. We continue to believe that navigating this unusual policy-driven world will require reading the inflation tea leaves and monitoring if and when higher prices become less desirable than some economic textbooks suggest.
Performance Disclosures
All market pricing and performance data from Bloomberg, unless otherwise cited. Asset class and sector performance are gross of fees unless otherwise indicated.
Citations
Share it :
Disclaimer
Magnus Financial Group LLC (“Magnus”) did not produce and bears no responsibility for any part of this report whatsoever, including but not limited to any microeconomic views, inaccuracies or any errors or omissions. Research and data used in the presentation have come from third-party sources that Magnus has not independently verified presentation and the opinions expressed are not by Magnus or its employees and are current only as of the time made and are subject to change without notice.
This report may include estimates, projections or other forward-looking statements, however, due to numerous factors, actual events may differ substantially from those presented. The graphs and tables making up this report have been based on unaudited, third-party data and performance information provided to us by one or more commercial databases. Except for the historical information contained in this report, certain matters are forward looking statements or projections that are dependent upon risks and uncertainties, including but not limited to factors and considerations such as general market volatility, global economic risk, geopolitical risk, currency risk and other country-specific factors, fiscal and monetary policy, the level of interest rates, security-specific risks, and historical market segment or sector performance relationships as they relate to the business and economic cycle.
Additionally, please be aware that past performance is not a guide to the future performance of any manager or strategy, and that the performance results and historical information provided displayed herein may have been adversely or favorably impacted by events and economic conditions that will not prevail in the future. Therefore, it should not be inferred that these results are indicative of the future performance of any strategy, index, fund, manager or group of managers. Index benchmarks contained in this report are provided so that performance can be compared with the performance of well-known and widely recognized indices. Index results assume the re-investment of all dividends and interest and do not reflect any management fees, transaction costs or expenses.
The information provided is not intended to be, and should not be construed as, investment, legal or tax advice nor should such information contained herein be construed as a recommendation or advice to purchase or sell any security, investment, or portfolio allocation. An investor should consult with their financial advisor to determine the appropriate investment strategies and investment vehicles. Investment decisions should be made based on the investor’s specific financial needs and objectives, goals, time horizon and risk tolerance. This presentation makes no implied or express recommendations concerning the way any client’s accounts should or would be handled, as appropriate investment decisions depend upon the client’s specific investment objectives.
Investment advisory services offered through Magnus; securities offered through third party custodial relationships. More information about Magnus can be found on its Form ADV at www.adviserinfo.sec.gov.
Terms of Use
Definitions
Asset class performance was measured using the following benchmarks: U.S. Large Cap Stocks: S&P 500 TR Index; U.S. Small & Micro Cap: Russell 2000 TR Index; Intl Dev Large Cap Stocks: MSCI EAFE GR Index; Emerging & Frontier Market Stocks: MSCI Emerging Markets GR Index; U.S. Intermediate-Term Muni Bonds: Bloomberg Barclays 1-10 (1-12 Yr) Muni Bond TR Index; U.S. Intermediate-Term Bonds: Bloomberg Barclays U.S. Aggregate Bond TR Index; U.S. High Yield Bonds: Bloomberg Barclays U.S. Corporate High Yield TR Index; U.S. Bank Loans: S&P/LSTA U.S. Leveraged Loan Index; Intl Developed Bonds: Bloomberg Barclays Global Aggregate ex-U.S. Index; Emerging & Frontier Market Bonds: JPMorgan EMBI Global Diversified TR Index; U.S. REITs: MSCI U.S. REIT GR Index, Ex U.S. Real Estate Securities: S&P Global Ex-U.S. Property TR Index; Commodity Futures: Bloomberg Commodity TR Index; Midstream Energy: Alerian MLP TR Index; Gold: LBMA Gold Price, U.S. 60/40: 60% S&P 500 TR Index; 40% Bloomberg Barclays U.S. Aggregate Bond TR Index; Global 60/40: 60% MSCI ACWI GR Index; 40% Bloomberg Barclays Global Aggregate Bond TR Index.