“I don’t think [the bond vigilantes] are dead. Anecdotally, my 22-year-old son walked into my home office. He just got a haircut. He said they raised the price from $20 to $26. When the barbers start raising prices, you have to worry about broad-based inflation.”
–Ed Yardeni, American Economist and Strategist

3Q, 2021 MARKET REVIEW
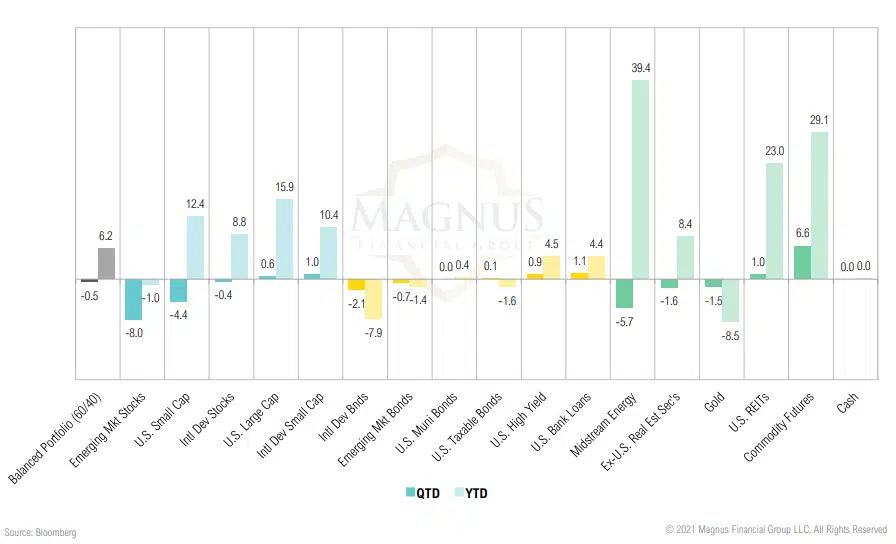
A generally weak quarter for risk assets, especially ex-U.S.; commodities were the top performer and balanced portfolios declined 0.5%
GROWTH, INFLATION & POLICY
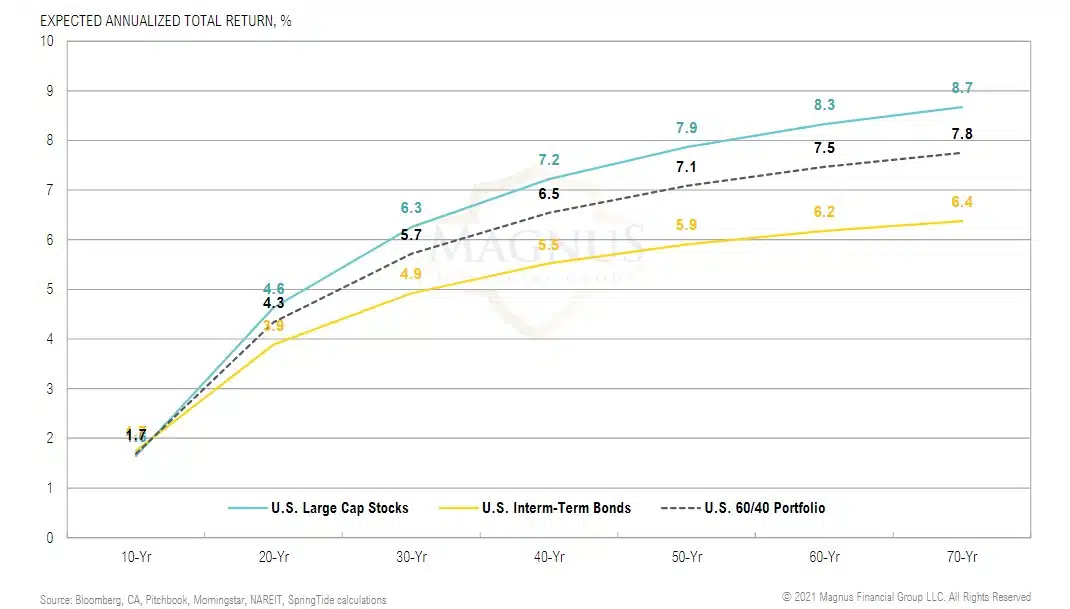
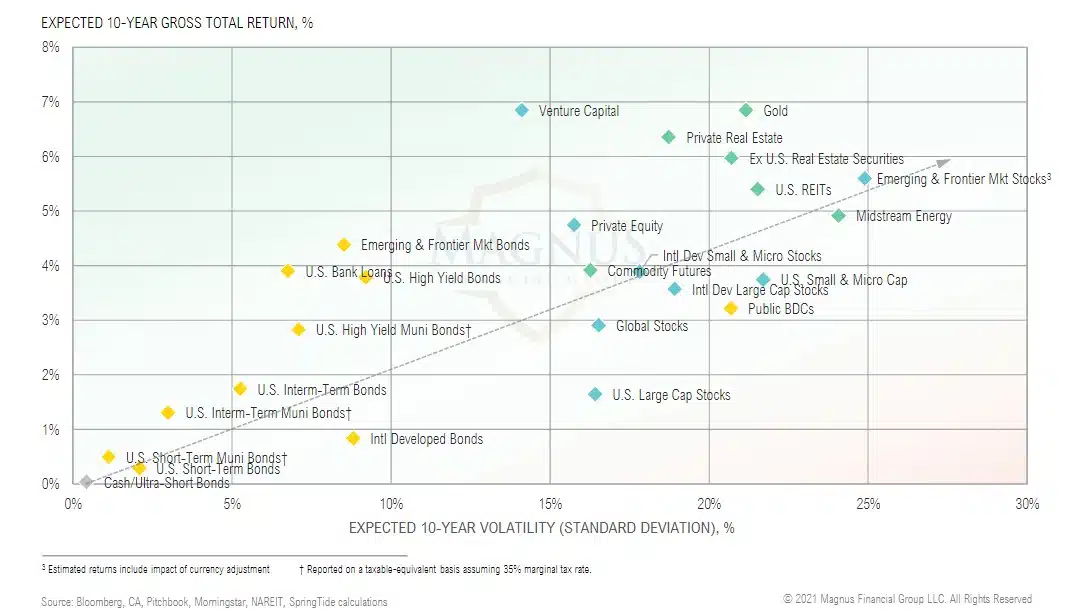
LONG-TERM ASSET CLASS RETURNS
Key markets near all-time highs with inflation running well above “target” exposes the impossible challenge policymakers face
“About half of the overall increase in grocery prices can be attributed to beef, pork and poultry… in fact, if you take out those three categories, price increases are more in line with historical norms. And if you look at eggs, the price has actually come down in recent months.”
– Brian Deese, White House Director of the National Economic Council
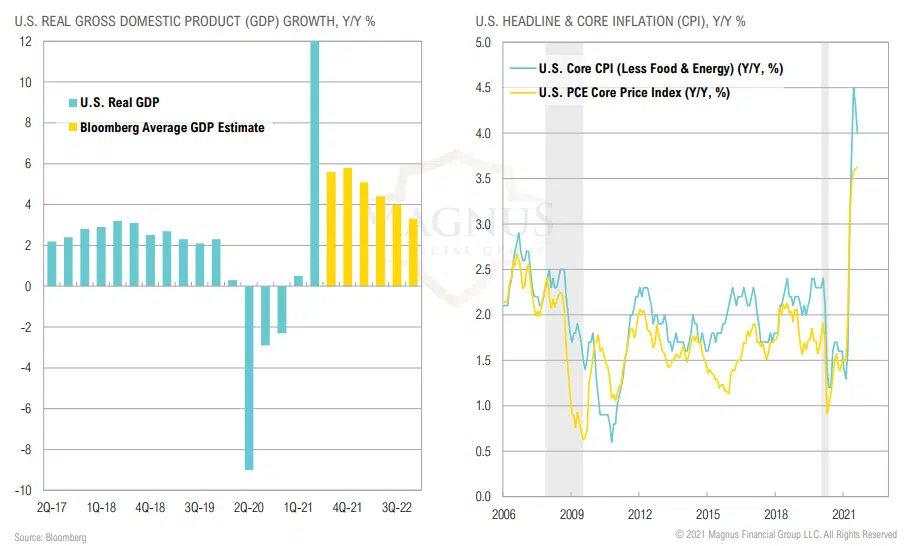
GDP & INFLATION
Growth and inflation both expected to slow, but to remain above average for next several quarters
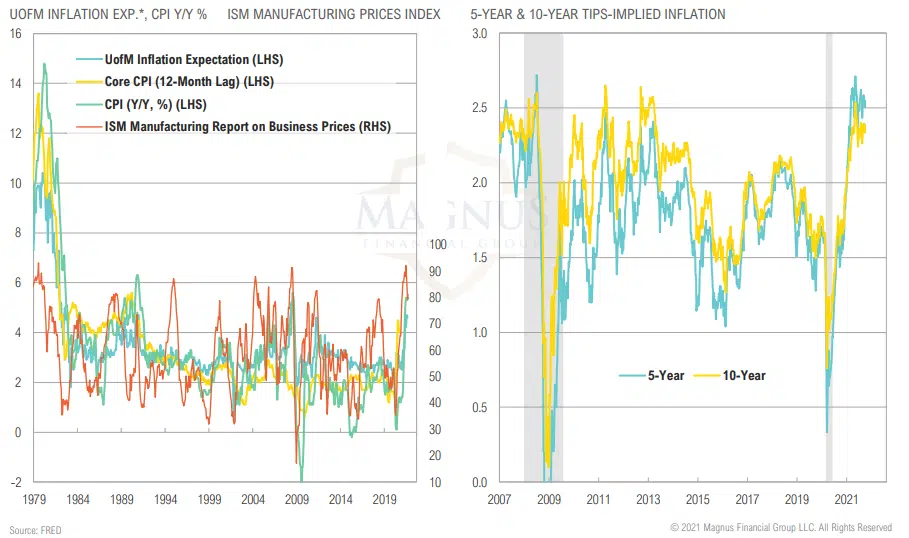
INFLATION TRENDS
Inflation and inflation expectations are still somewhat contained, but potentially on the cusp of multi-decade breakout
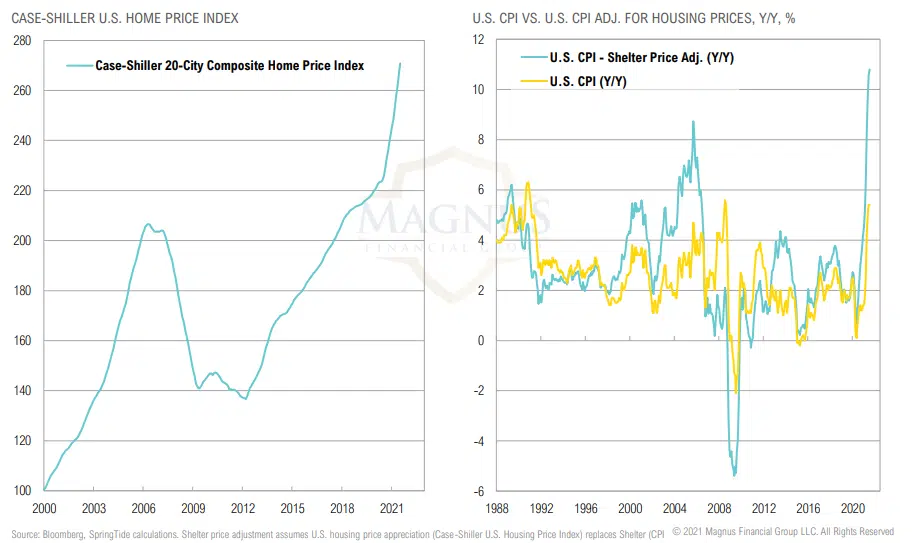
CPI & HOUSING
Adjusted for U.S. housing price appreciation, inflation would be significantly higher due to the lag in reporting of shelter in CPI
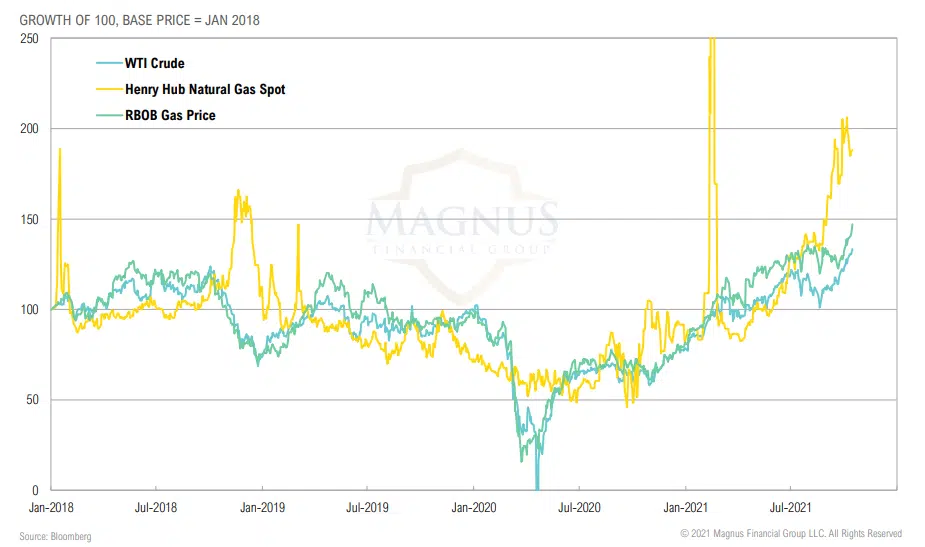
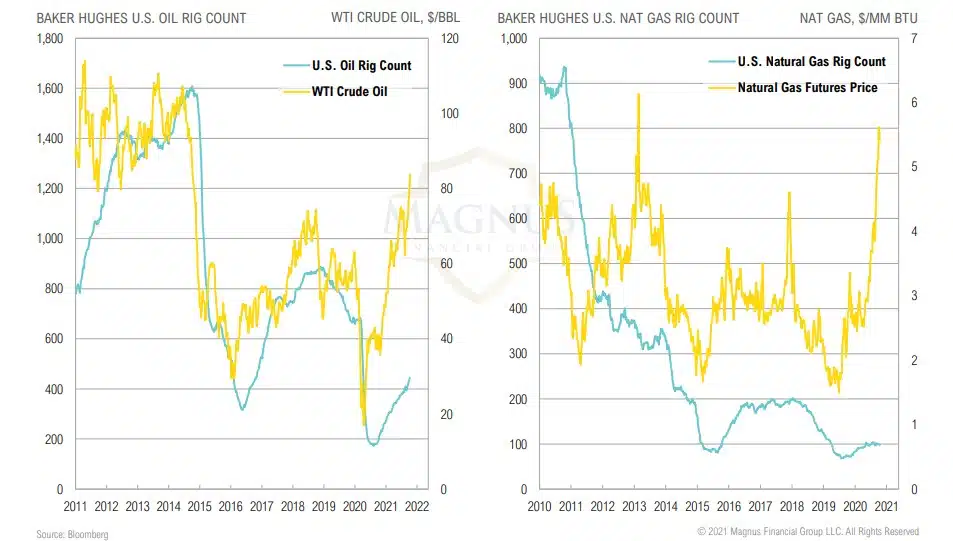
OIL & NATURAL GAS PRICES
Rising energy prices will continue to be a hot topic for consumers and the current administration
U.S. LABOR MARKET
From here, it will take 18 months to achieve the Federal Reserve’s goal of full employment, assuming a pace of 250,000 additions per month
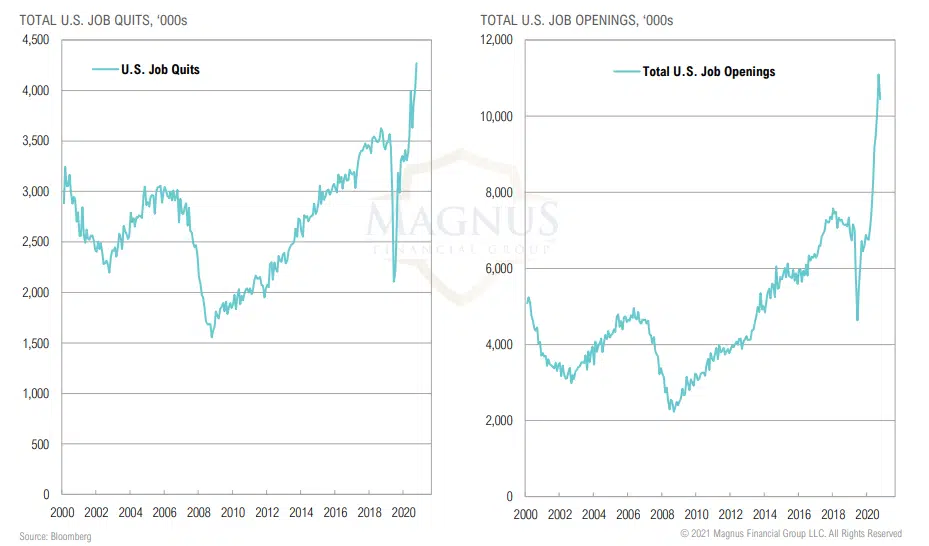
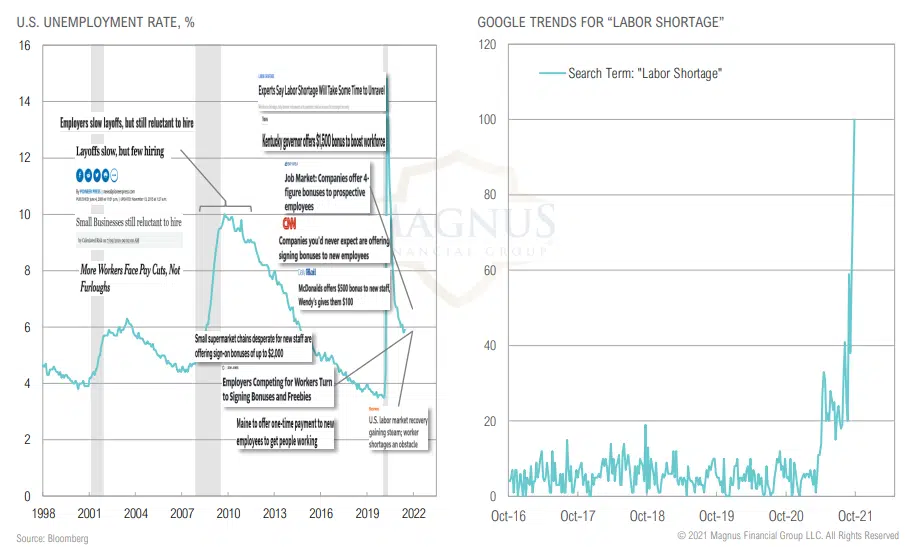
LABOR MARKET DYNAMICS
Companies getting creative in attempts to attract workers in a challenging labor market environment that is very different from the ‘09-’11 recovery
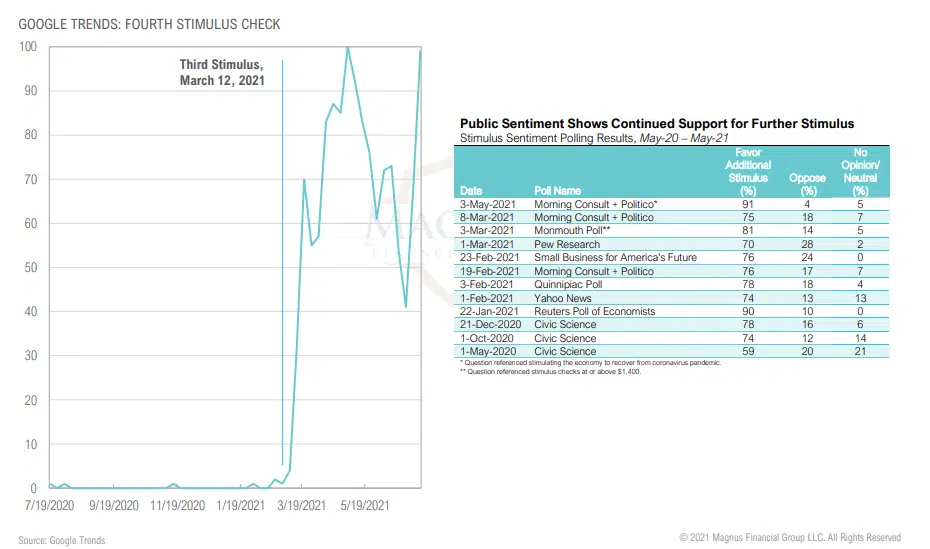
STIMULUS TRENDS
Voters aren’t just comfortable with further stimulus; they are anticipating it and may expect or demand it in the next downturn
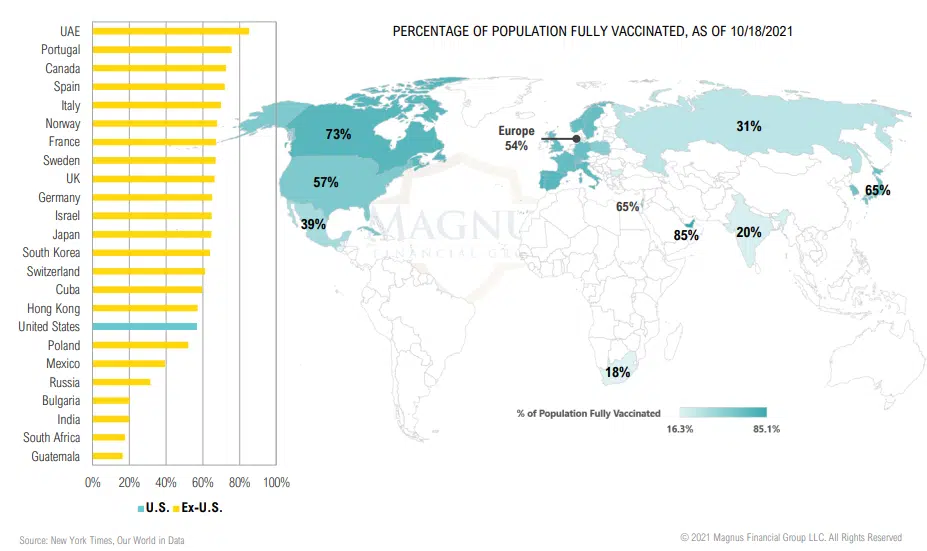
COVID TRENDS
Varied pace of global vaccination rollout and government response creating uneven pace of reopening and economic recovery
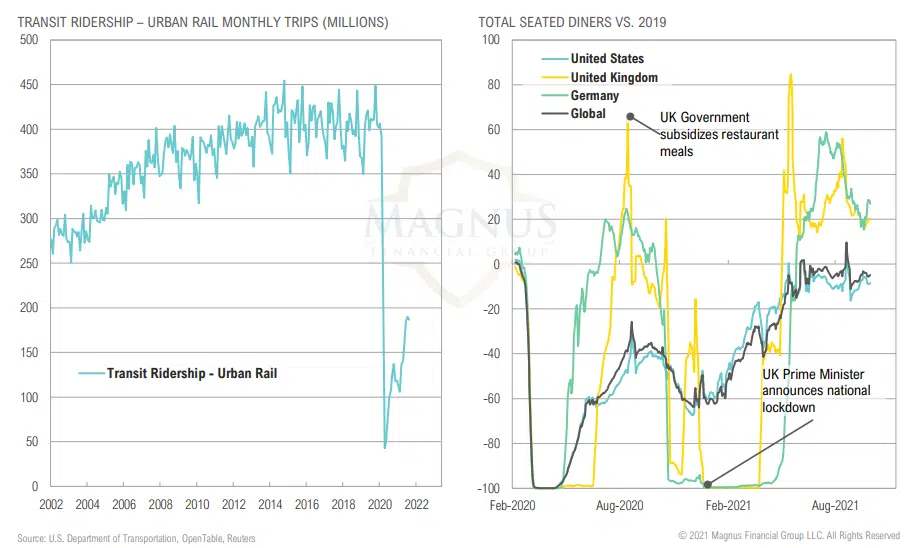
TRANSIT & DINING ACTIVITY
Urban transit ridership and other consumer data shows disjointed recovery heavily impacted by policy initiatives
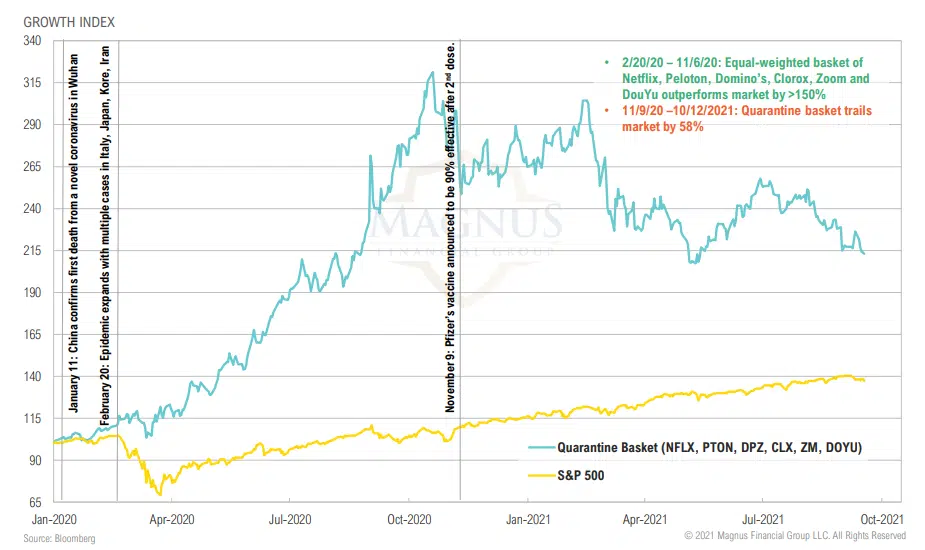
COVID TRADE
Quarantine Stock Basket continues to trail the broader U.S. stock market
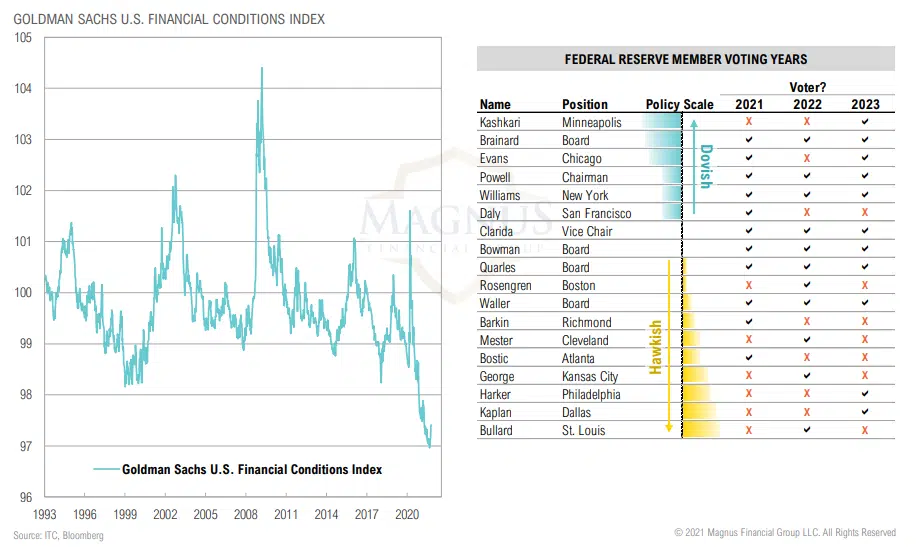
FED MEMBERS
Makeup of the Fed should remain at least as dovish as it is now in coming years
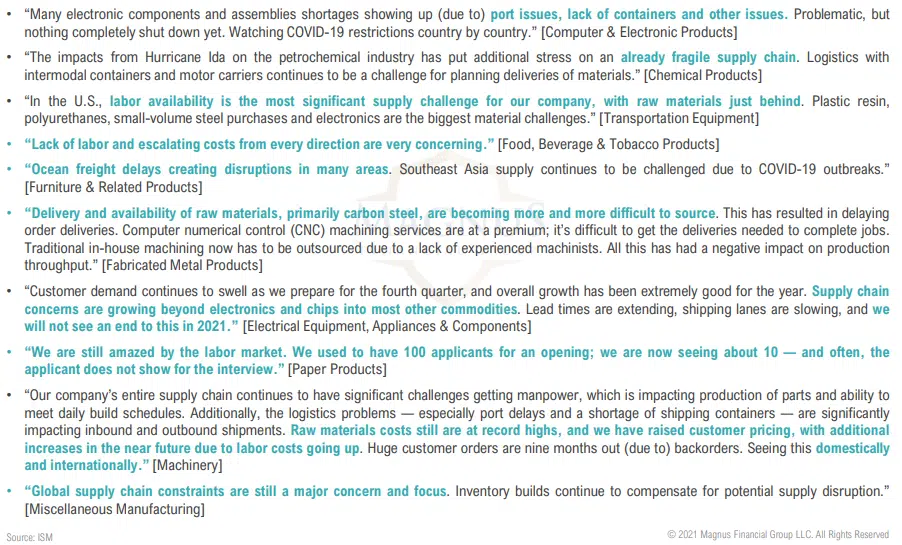
ISM MANUFACTURING PMI
SELECT QUOTES
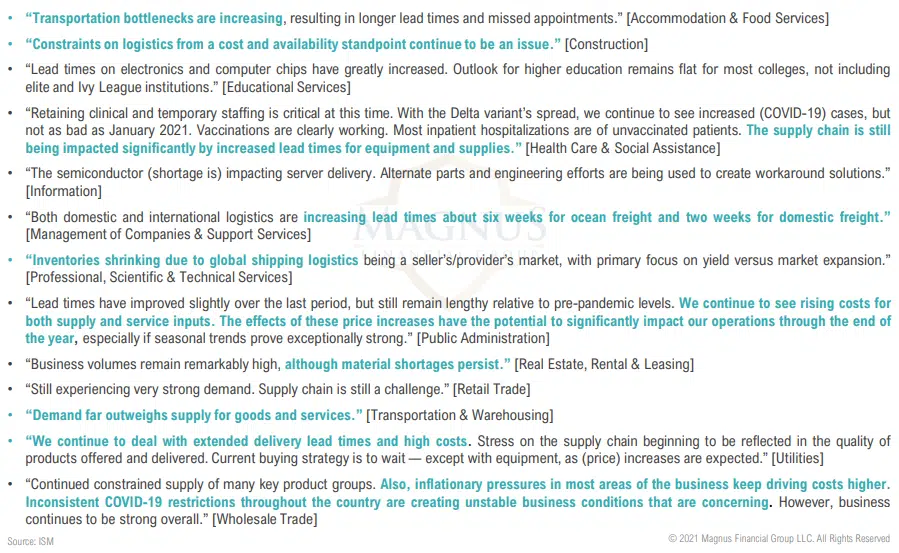
ISM SERVICES PMI
SELECT QUOTES
Services PMI: “Demand far outweighs supply for goods and services”
EQUITY
“There are expected to be more than $1.0 trillion of stock buybacks in the S&P 500 this year – more than all the annual coupon income in the US Treasury, IG and HY markets combined.”
-Lu Wang, Bloomberg Markets columnist
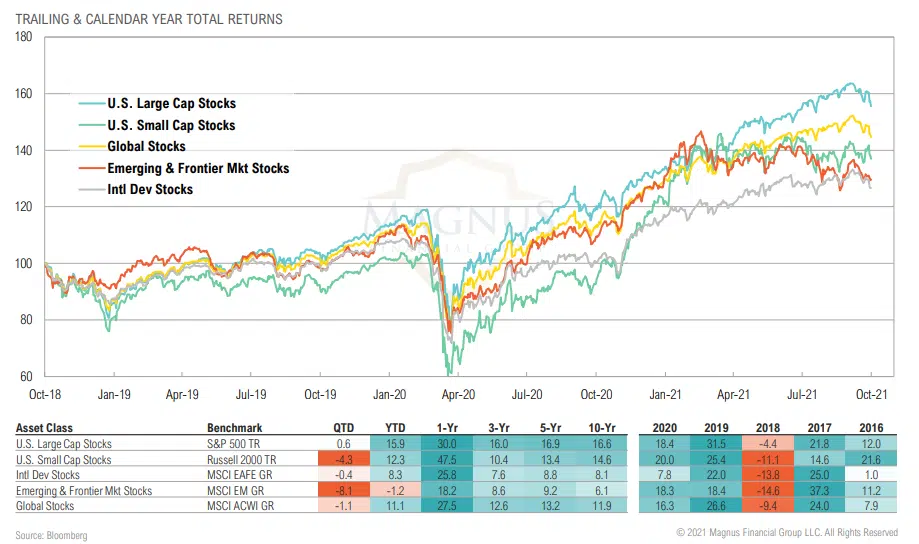
MARKET RETURNS SUMMARY
U.S. stocks managed to net out a modestly positive return for the quarter while U.S. small cap, international and emerging markets declined
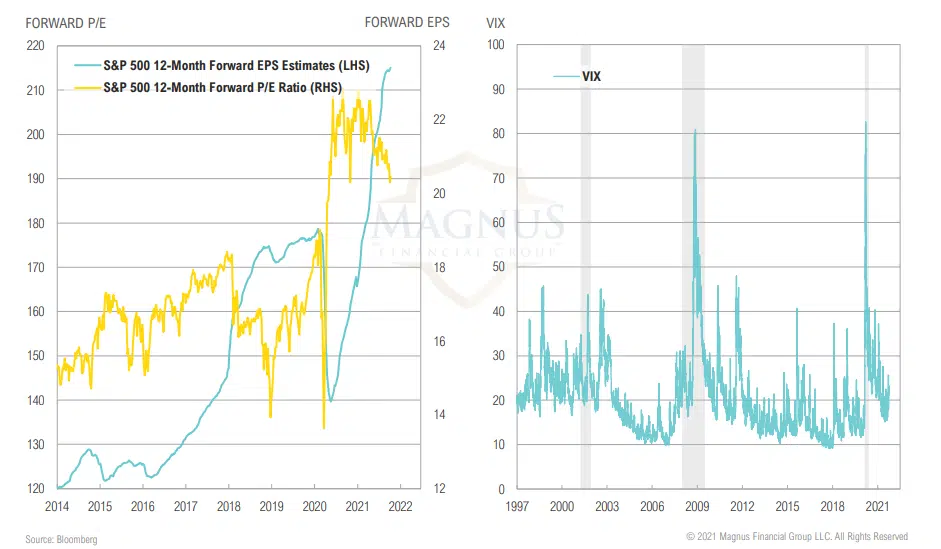
VALUATIONS & VOLATILITY
Earnings estimates for S&P 500 continue to rise, outpacing prices as valuations compressed during the quarter; VIX rose to 23
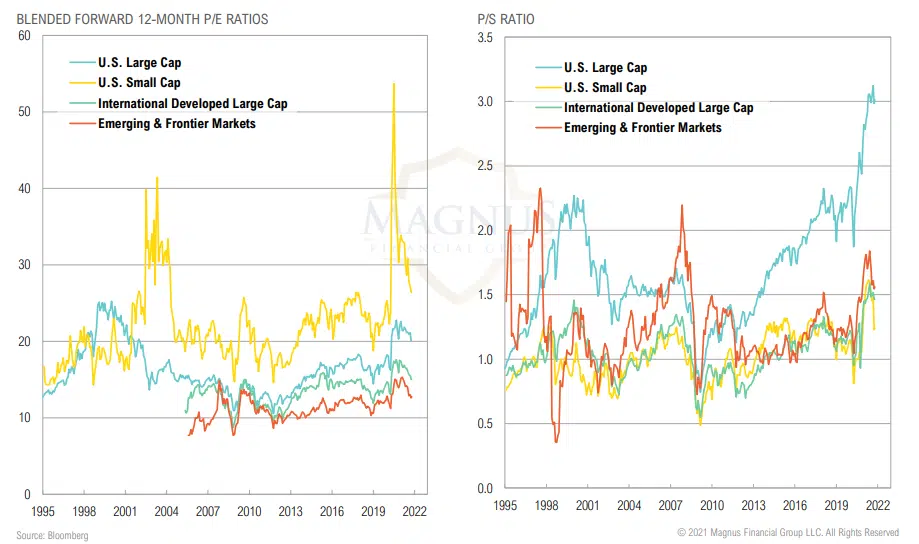
VALUATIONS
Relative to earnings estimates, emerging & frontier market stocks are cheapest; relative to sales, U.S. Large Cap stocks appear very expensive
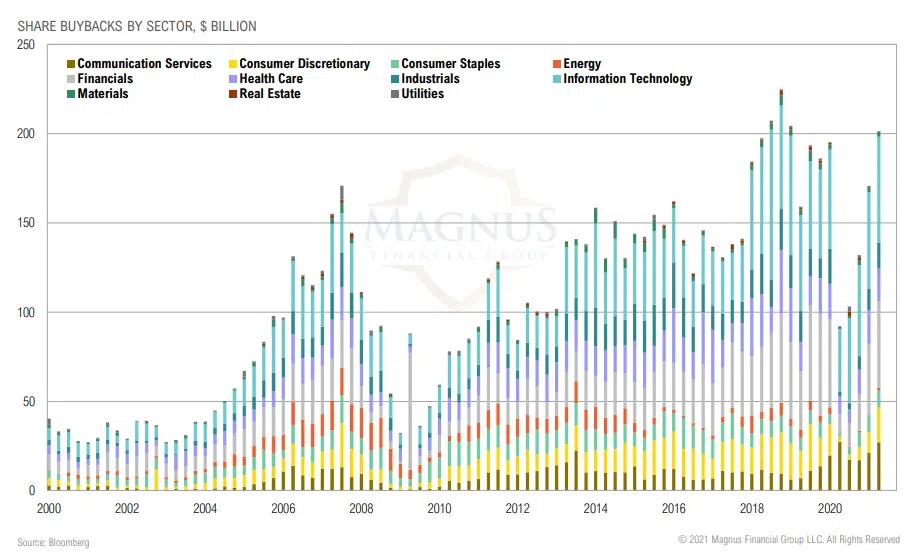
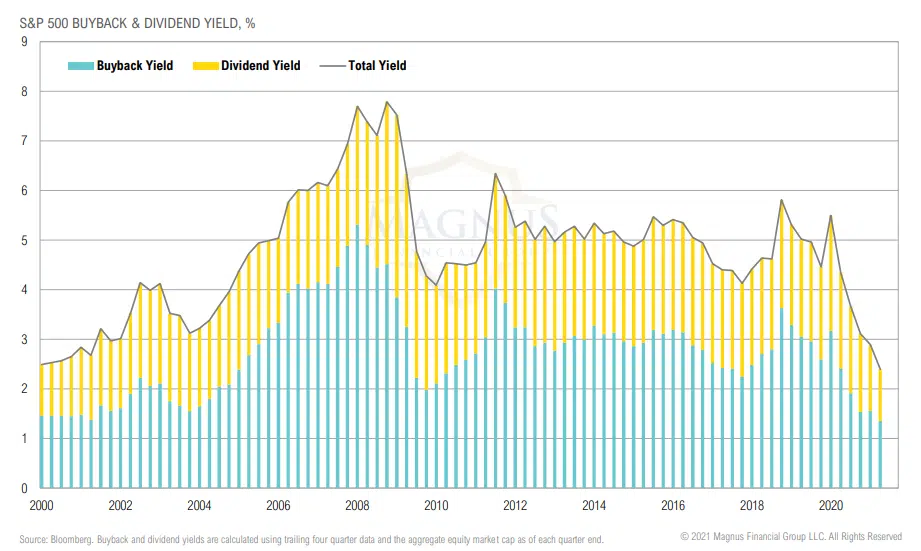
BUYBACKS
Companies bought back $200 billion of stock in Q2, Tech companies accounted for nearly one third of those buybacks
Buyback and dividend yields for U.S. large cap stocks have come down due to the rally in equities and the lagging impact of cuts in early 2020
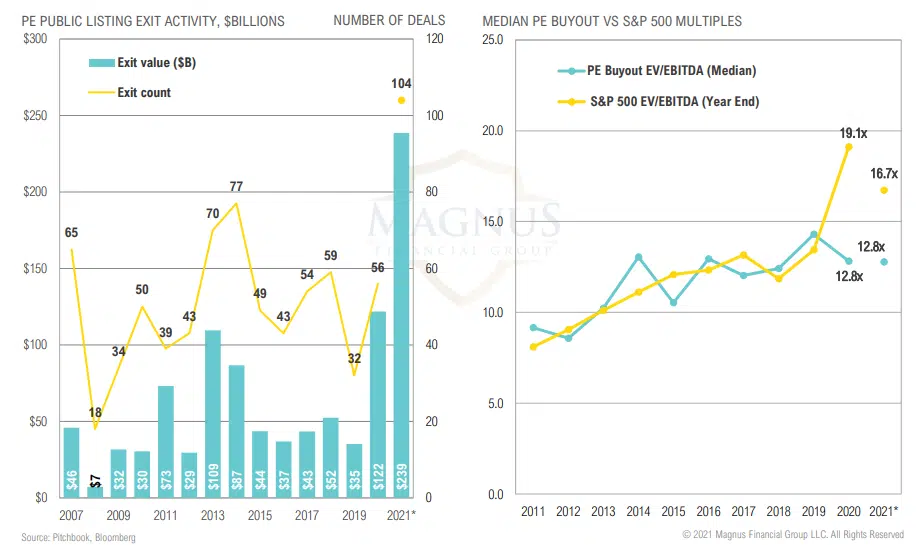
PRIVATE EQUITY BUYOUTS
Frothy public markets lead to largest IPO year on record
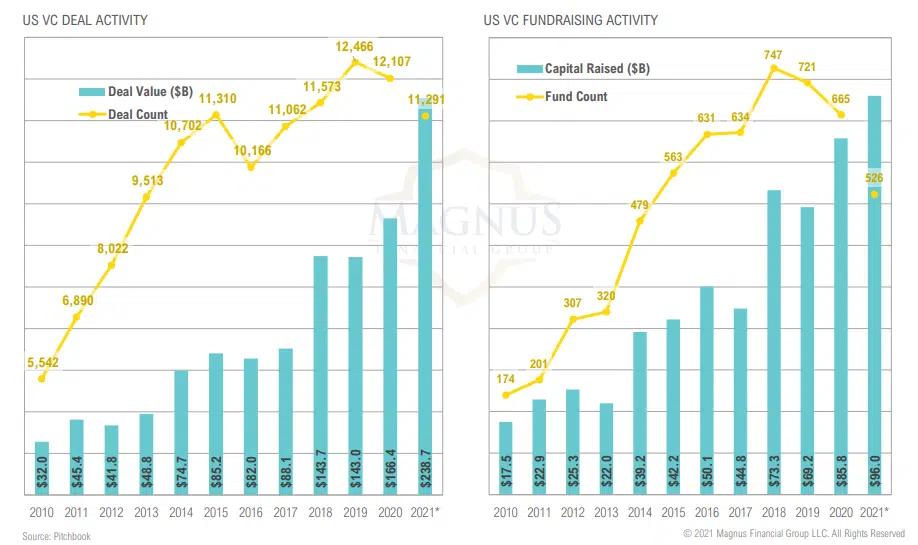
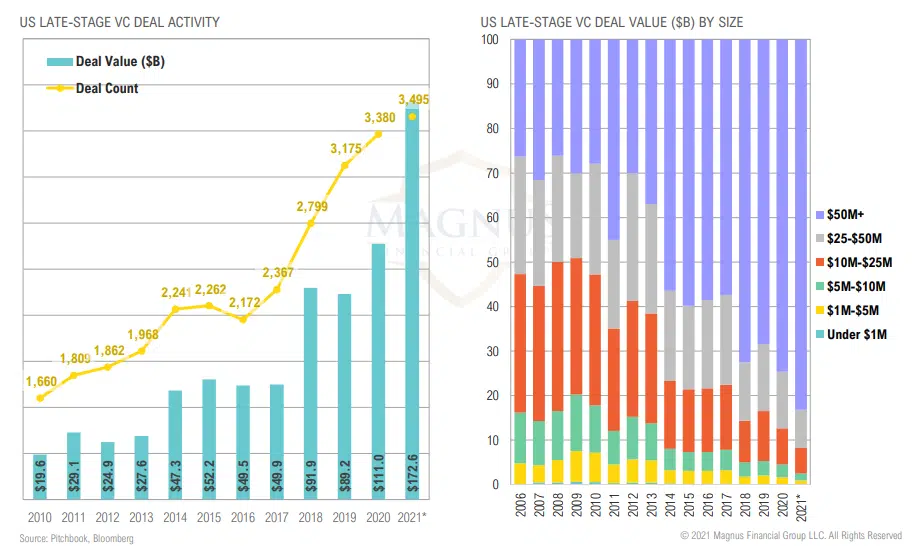
VENTURE CAPITAL
Pent-up pandemic demand has pushed 2021 venture activity to shatter previous records through just three quarters
VENTURE CAPITAL DEAL ACTIVITY
Momentum persists at late stage of venture activity
FIXED INCOME & CREDIT
“I came of age and studied economics in the 1970s and I remember what that terrible period was like. No one wants to see that happen again.”
– Janet Yellen, Treasury Secretary, May 2021
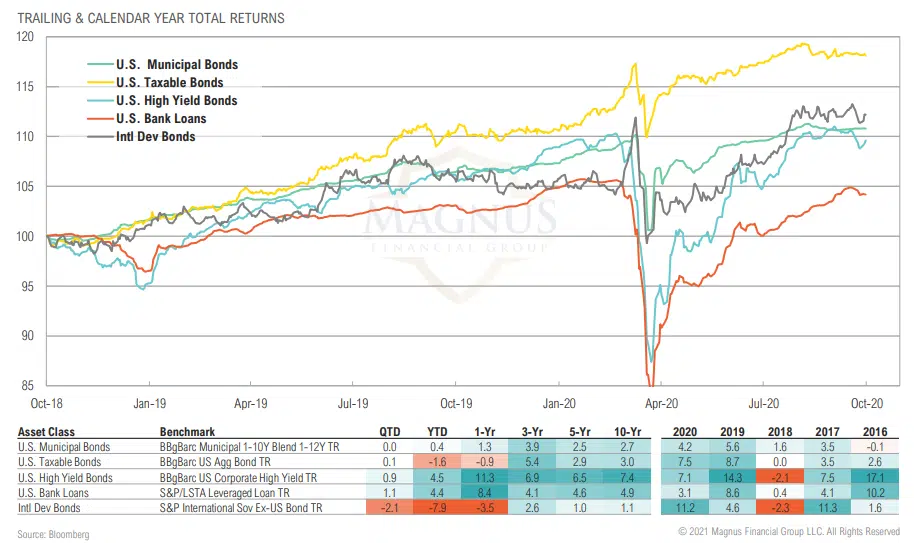
MARKET RETURNS SUMMARY
U.S. fixed income and credit protected against a modest risk-off quarter; weakness continued in international developed bonds
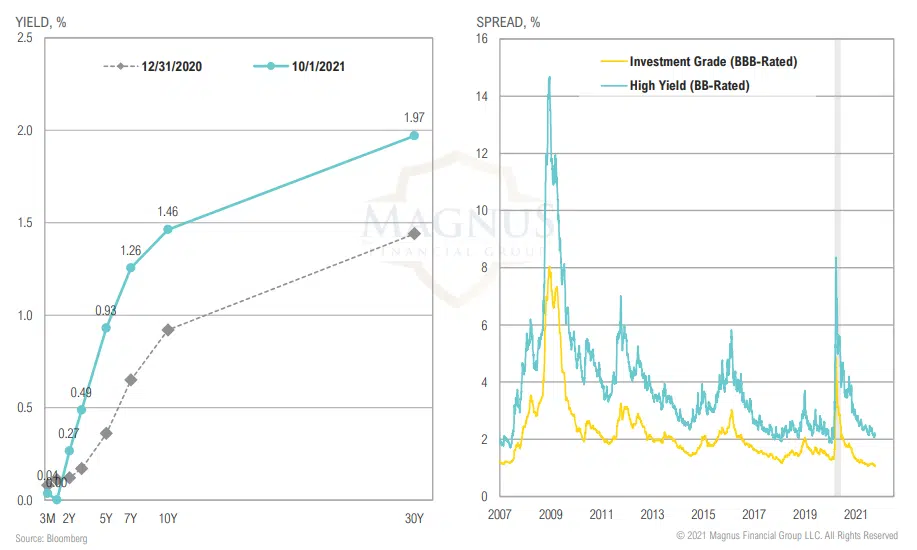
TREASURY YIELDS & CREDIT SPREADS
U.S. Treasury yield curve has steepened modestly this year while credit spreads have remained at or near historically tight levels
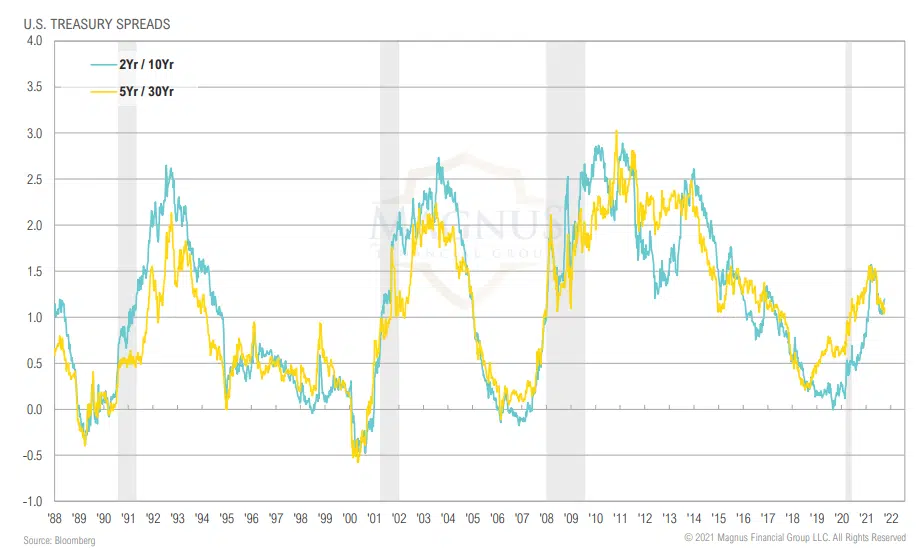
TREASURY SPREADS
Recent bear flattening, if it continues, could spell the end of this cycle via suggests potential trouble ahead for the Fed and the economy
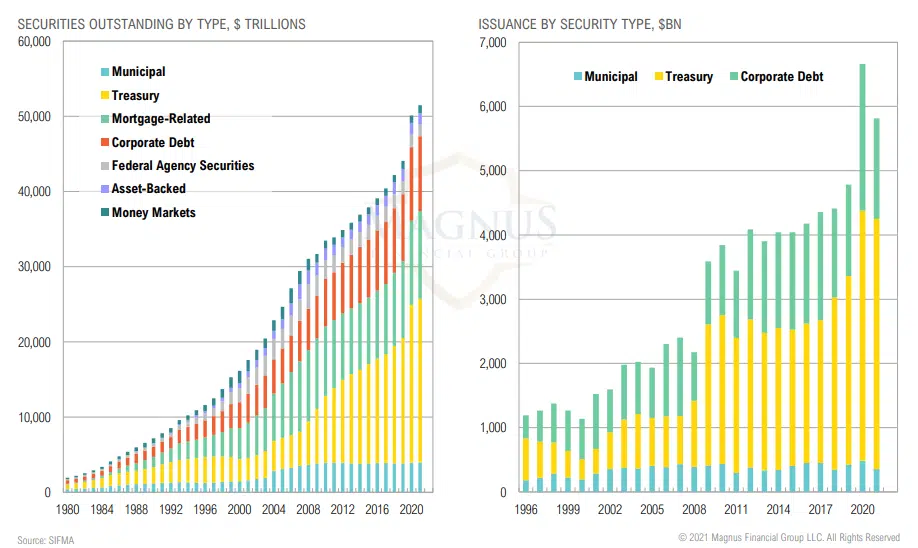
FIXED INCOME & CREDIT SECURITIES
Treasuries increasingly becoming the largest segment of the now $52 trillion fixed income and credit securities market
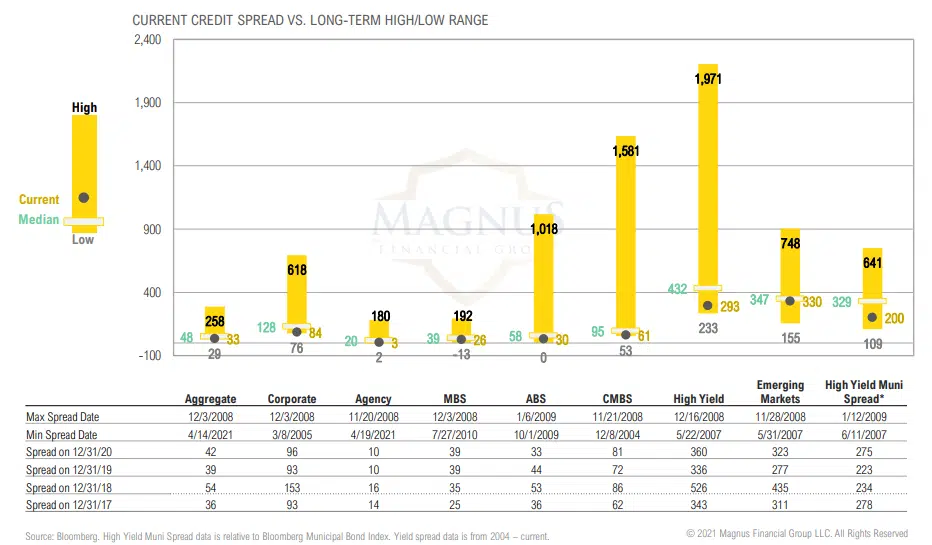
SPREADS BY SECTOR
Credit spreads below median across sectors with very few pockets of opportunity
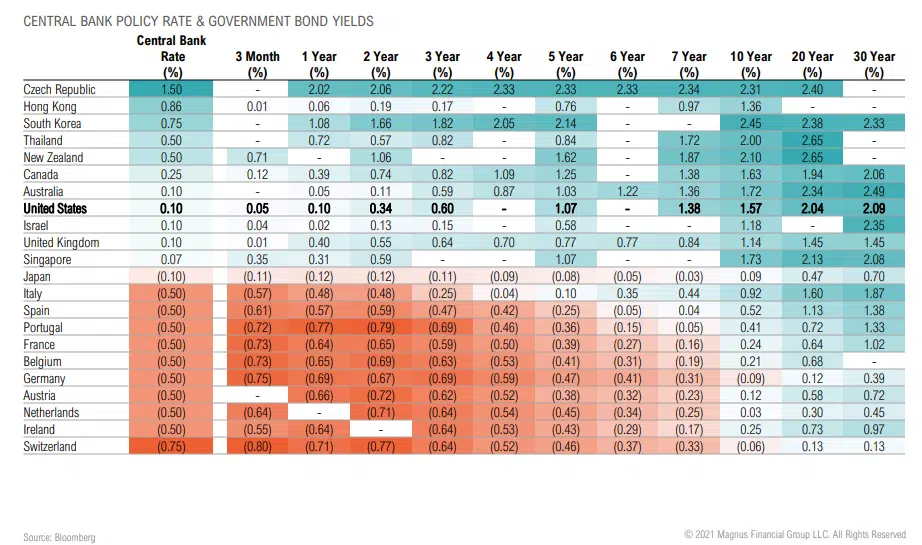
GLOBAL RATES
U.S. remains high yield relatively speaking, could keep U.S. rates contained
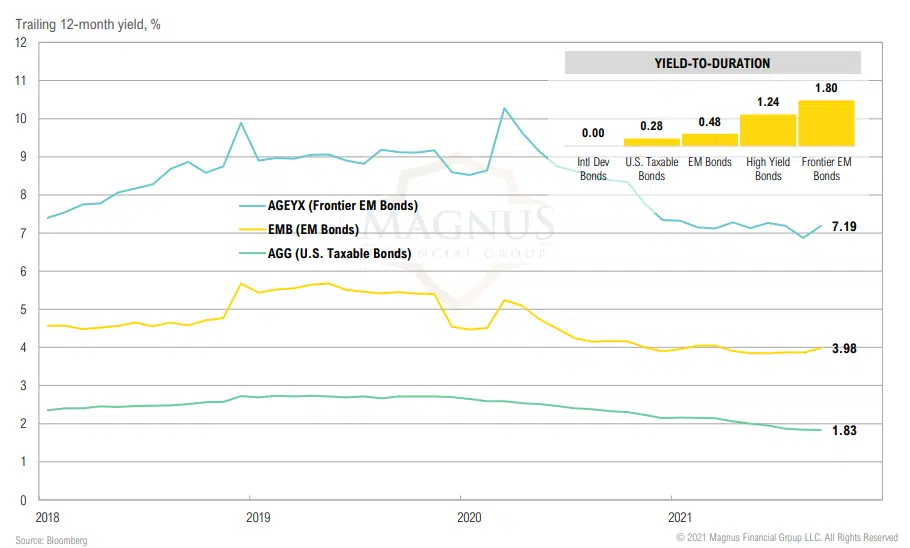
YIELD-TO-DURATION
Frontier market bonds offer significantly more yield per unit of duration (interest rate risk)
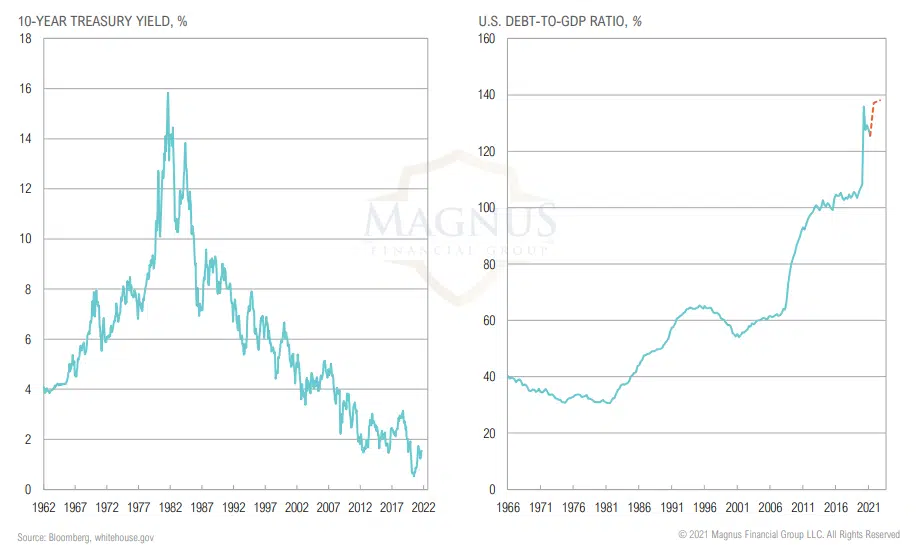
TREASURY MARKET
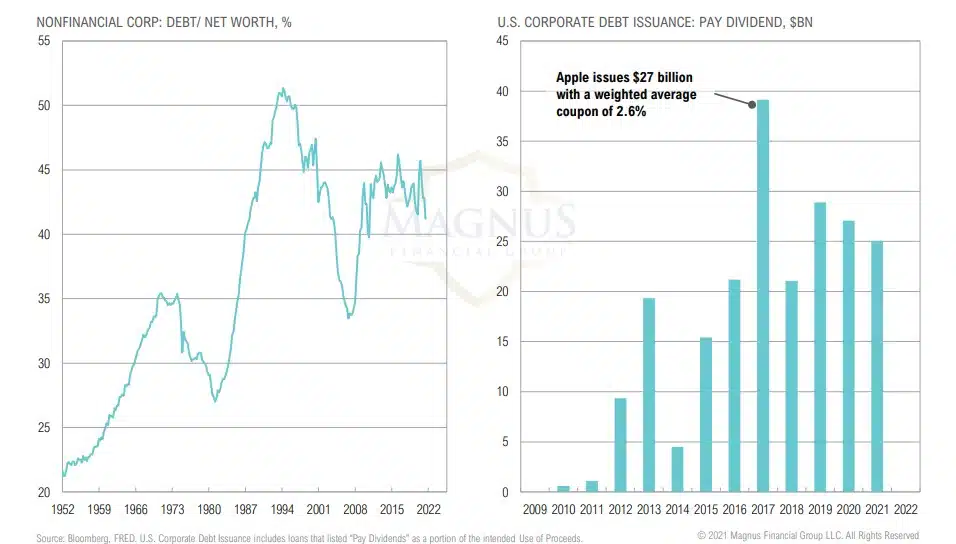
The treasury market has been an enabler of increasing deficit spending and debt levels… when it will become a “vigilante”?
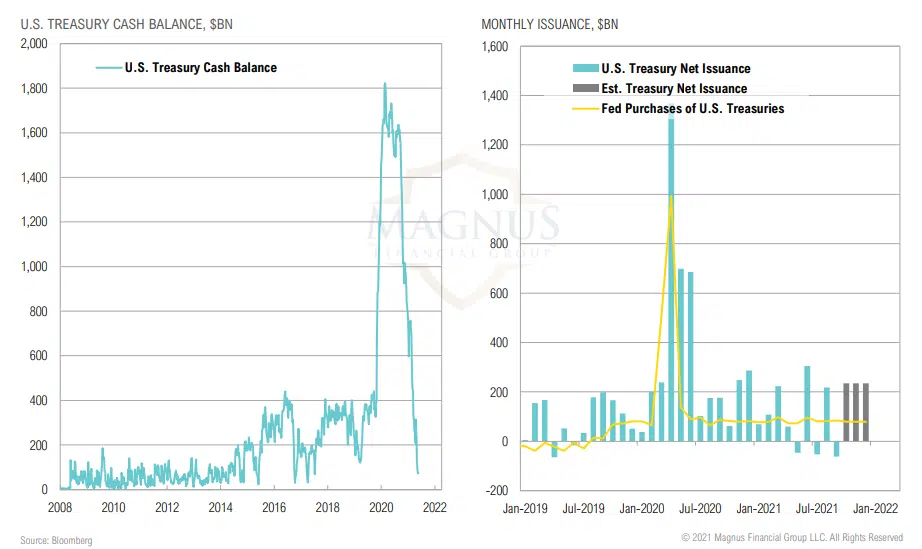
TREASURY ISSUANCE
Issuance continues to be pushed out as the U.S. Treasury draws down its cash balance
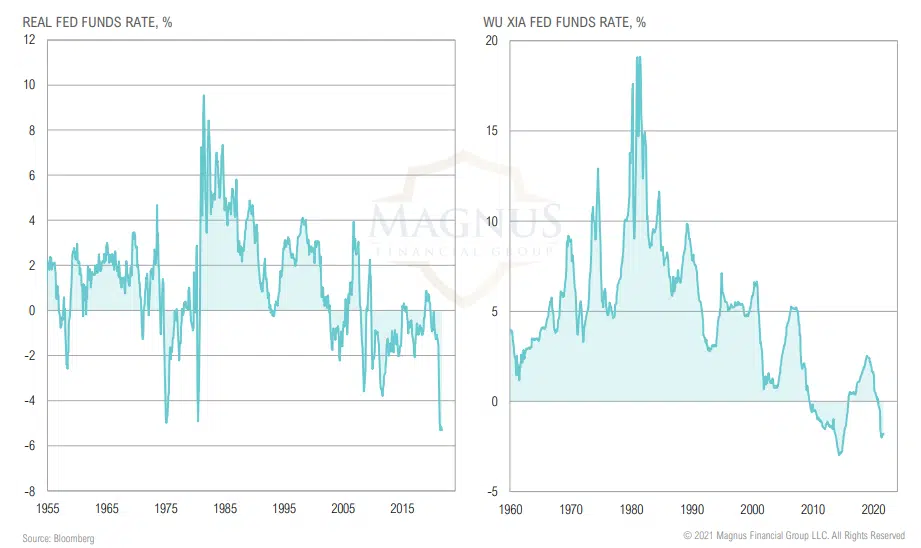
REAL INTEREST RATES
Powell is right: this time isn’t like the 1970s…from a capital allocation standpoint it’s worse
PRIVATE DEBT FUNDS
Private debt fundraising on pace for lowest year since 2016, potentially a sign of future opportunity
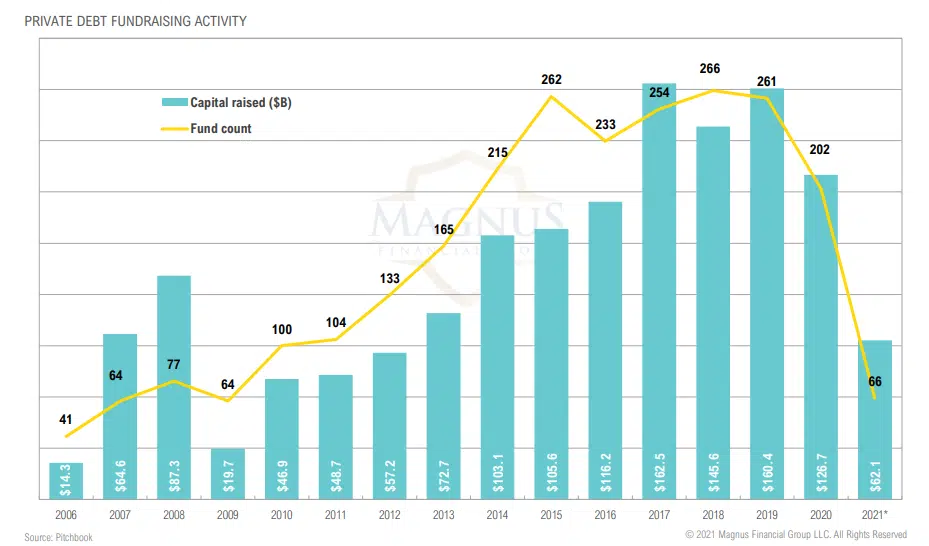
DEBT ISSUANCE
Private debt fundraising on pace for lowest year since 2016, potentially a sign of future opportunity
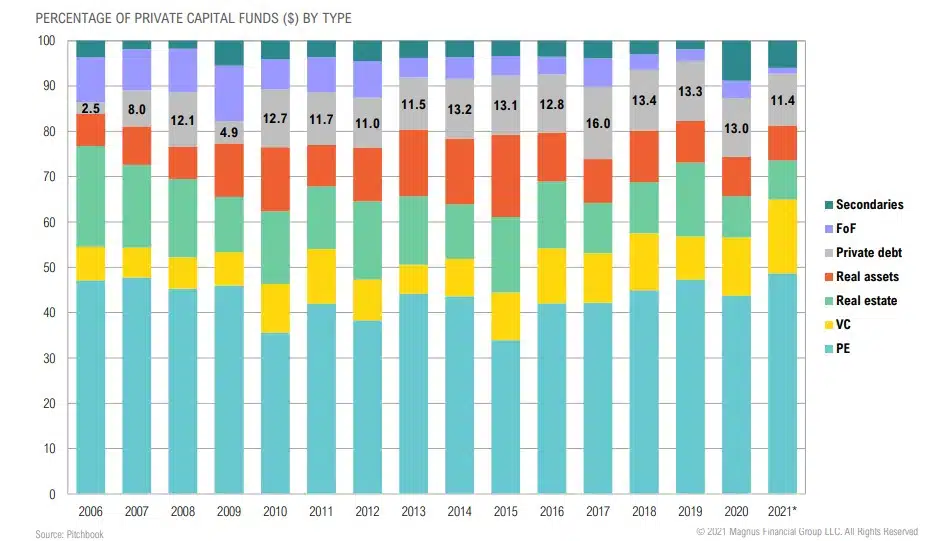
PRIVATE CAPITAL FUNDS
Private debt funds are their lowest proportion of private assets since 2012, also potentially a sign of an opportunity
REAL ASSETS
“When you look at real interest rates on long-date Treasuries, it looks like Jimmy Carter area. We’re talking about the CPI at 5.4%, and if we want to use the 10-year Treasury it’s not even at 1.4%, that’s a negative 4% interest rate. That’s Jimmy Carteresque.”
-Jeffrey Gundlach, DoubleLine Capital CEO, July 15, 2021
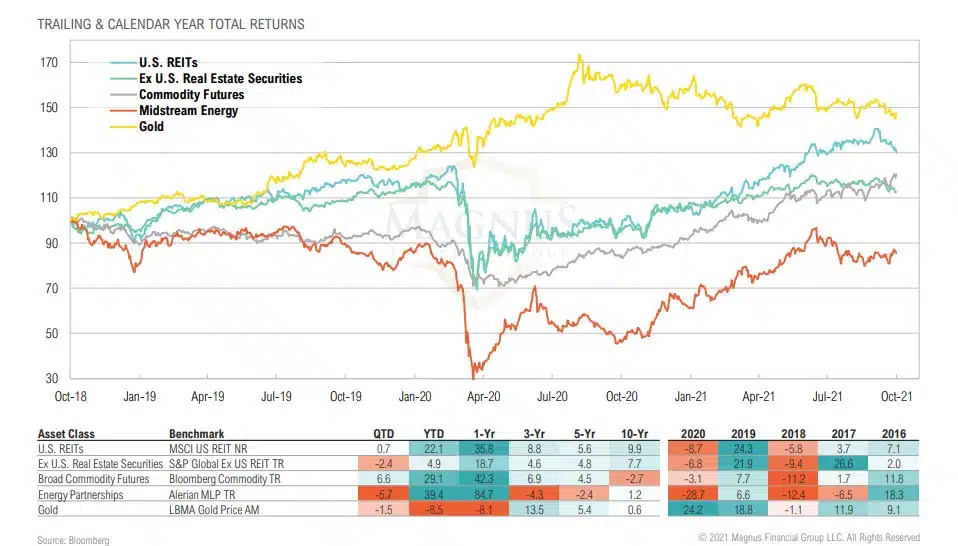
MARKET RETURNS SUMMARY
Real assets had a mixed quarter; commodities continued higher as supply chain issues persist with significant implications for future inflation
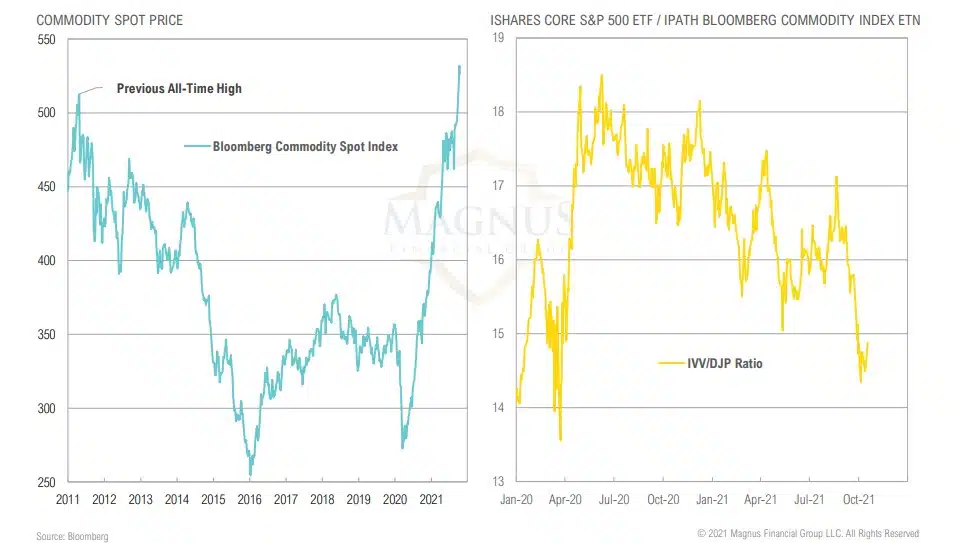
COMMODITIES VS. STOCKS
Commodities have outperformed stocks through the COVID-19 crisis
OIL & NATURAL GAS
Oil and natural gas producers have been cautious to bring rigs back online despite rising prices
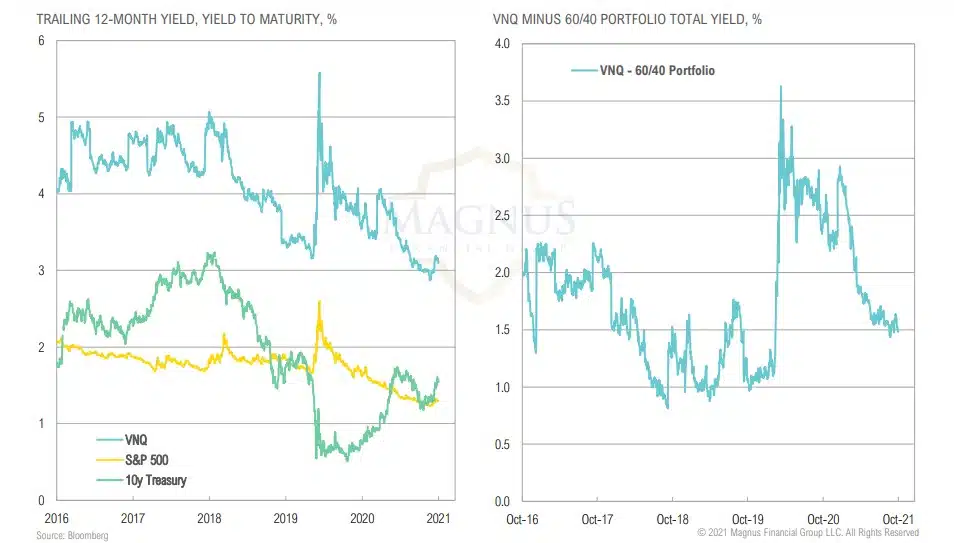
REITs & U.S. 60/40
REITs are no longer compelling, even compared to the low yields provided by U.S. 60/40 portfolios
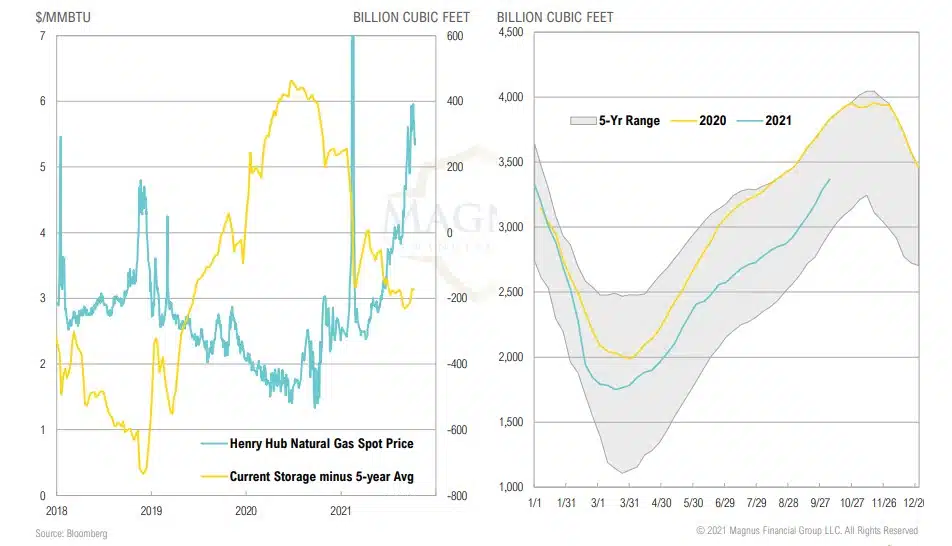
NATURAL GAS DEMAND
Natural Gas inventories are lower relative to prior years heading into winter, leading to a spike in prices
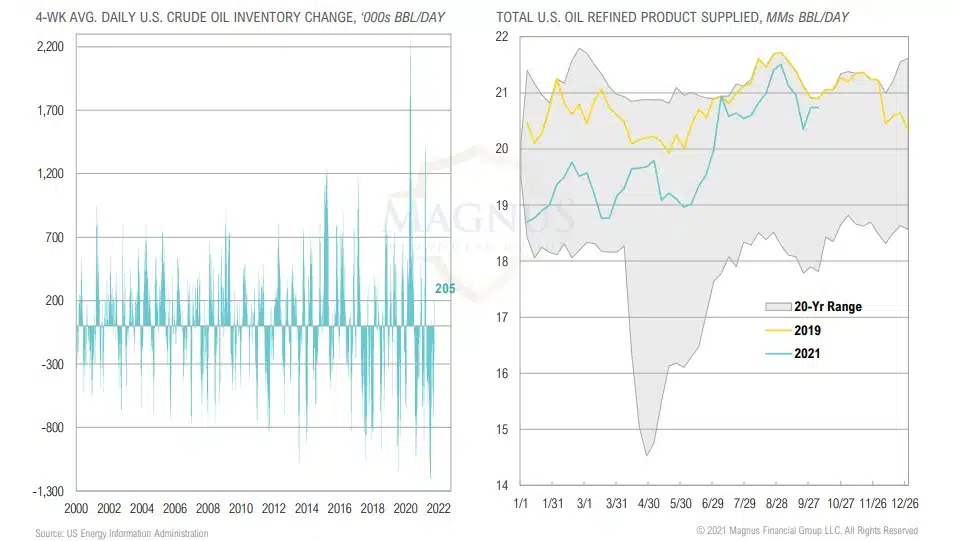
CRUDE OIL DEMAND
Crude oil inventories had their largest build since March, demand for refined oil remains strong
YIELDS
Midstream yields remain substantially above REITs, free cash flow yields of real assets and infrastructure category remain attractive
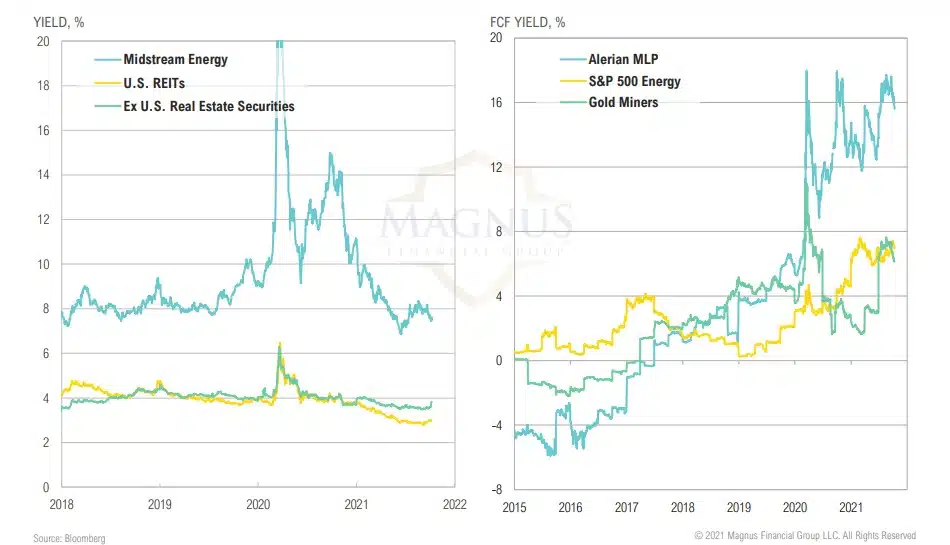
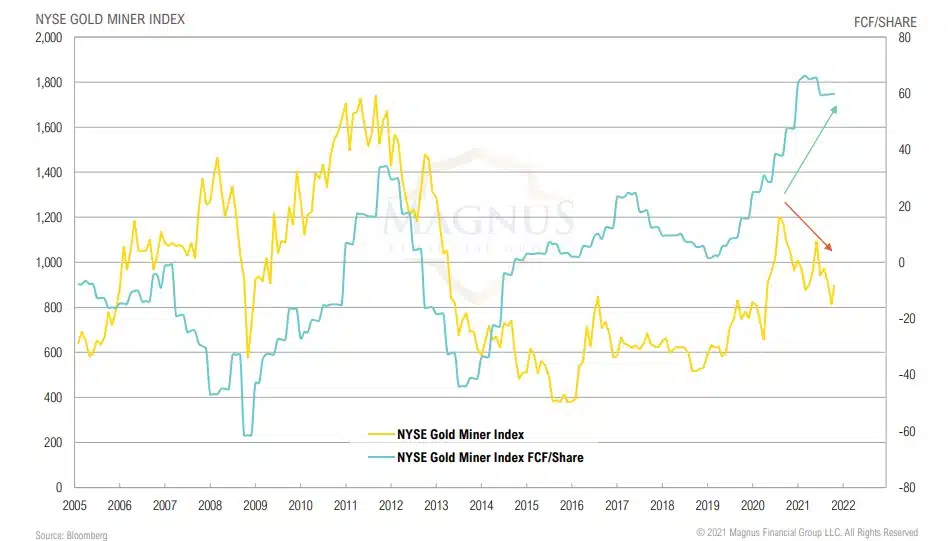
GOLD MINER FUNDAMENTALS
Gold miner performance has diverged from fundamentals, producing attractive FCF/share and higher FCF yields than the S&P 500
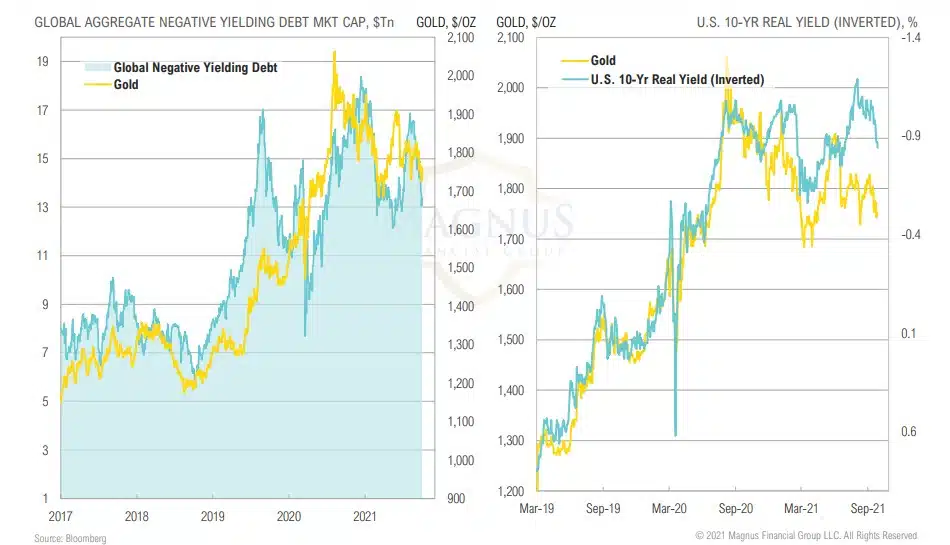
GOLD VS. NEGATIVE YIELDING DEBT & REAL YIELDS
Real yields rose modestly, and aggregate amount of global negative yielding debt fell in September
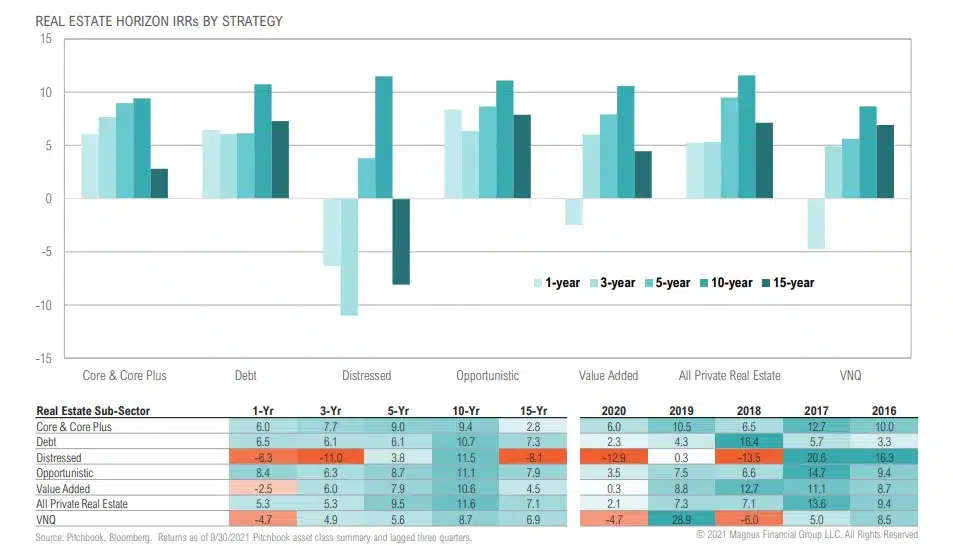
PRIVATE REAL ESTATE PERFORMANCE
Longer-term (lagged) returns for various private real estate markets show the impact of going-in cap rates on subsequent returns
OPPORTUNISTIC
“The odds of 1970s era inflation are] very, very unlikely. [We have] a central bank that is committed to price stability and has defined what price stability is and will use its tools to keep us around 2% inflation. I don’t expect anything like that to happen.”
– Jerome Powell, Federal Reserve Chairman, June 2021
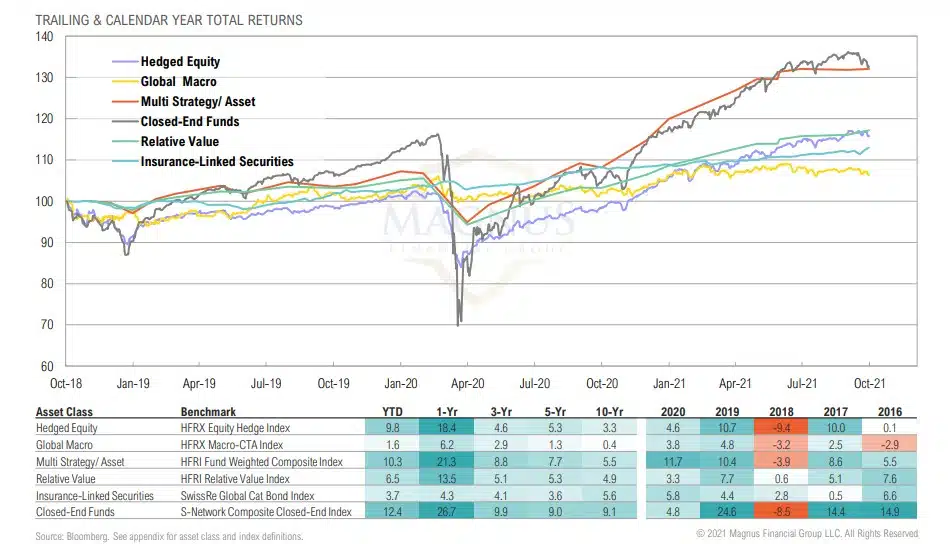
MARKET RETURNS SUMMARY
Closed-end funds continued to benefit from broad market gains and narrowing discounts, other asset classes more mixed
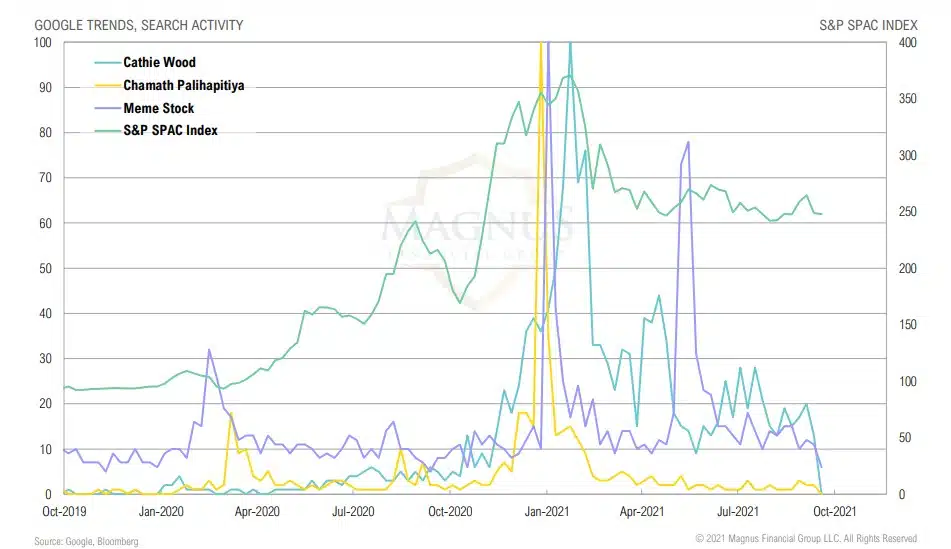
RETAIL MANIA
Retail mania has mostly faded for now
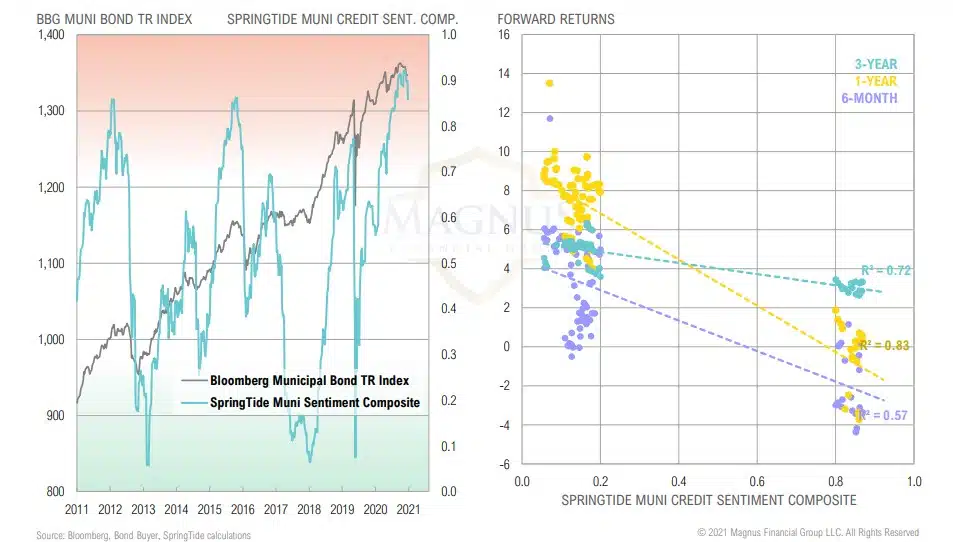
OPP MUNI CREDIT
Muni credit sentiment remains elevated, historically associated with lowerthan-average forward returns
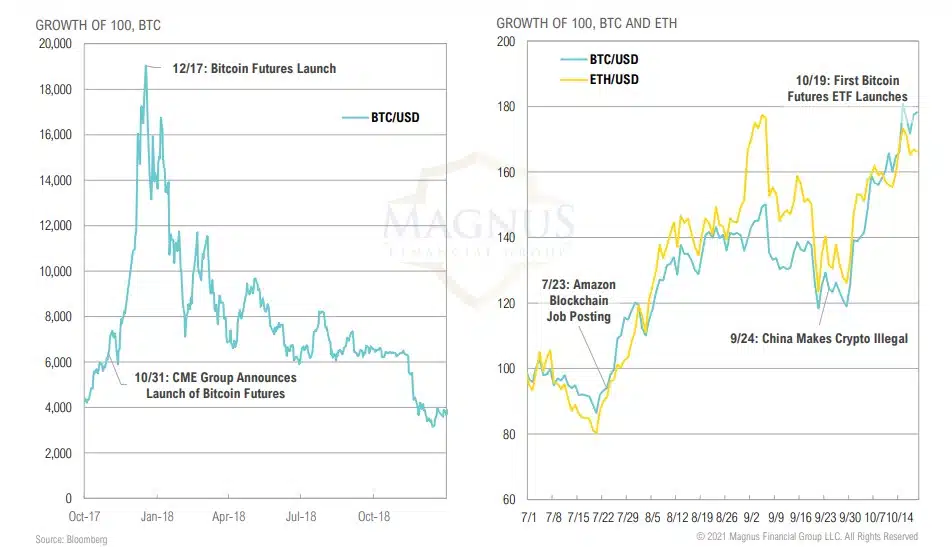
CRYPTOCURRENCIES
Crypto bull rally: buy the hype or sell the news?
ASSET ALLOCATION
“Asset allocation is the tool that you use to determine the risk and return characteristics of your portfolio. It’s overwhelmingly important in terms of the results you achieve. In fact, studies show that asset allocation is responsible for more than 100 percent of the positive returns generated by investors.”
– David F. Swensen, American investor and endowment fund manager
CMEs
Expected 10-year returns for most risky assets rose as valuations declined and spreads widened modestly
Longer-term return expectations held relatively stable as the mean reversion of higher valuations is distributed over a longer holding period