Magnus documents: Form ADV  | Form CRS | Privacy Policy

Market Outlook: Halftime – Q3, 2026

“I would start with the fact that I am probably more constructive on the consumer than what one would glean from reading the headlines of news publications.”

John Rainey, Walmart CFO

“And you talk about the S&P at all time highs. Corporate earnings in America are at all time highs. It’s unbelievable the earnings growth over the course of just the last 12 months, right? So, there is a technological revolution happening of which AI is a component of the story. But it’s just a piece”

Ken Griffin, Citadel Founder

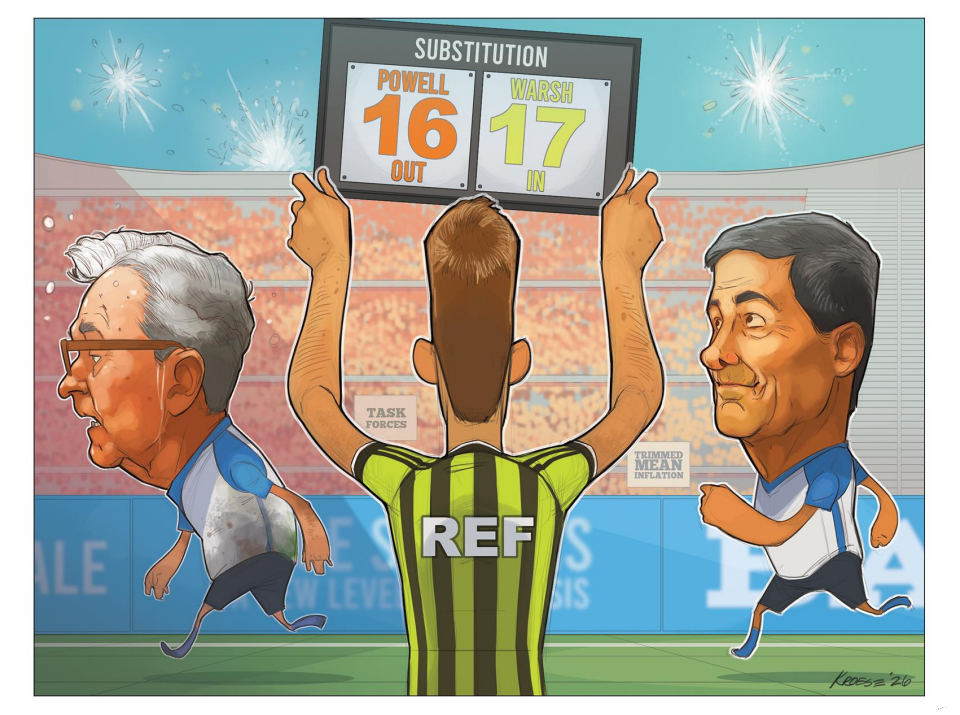
Cartoon

Halftime

Summary

A concise review of the prior quarter, portfolio positioning and rationale, and an outline of the key themes and asset allocation priorities for the quarter ahead.

Market Commentary

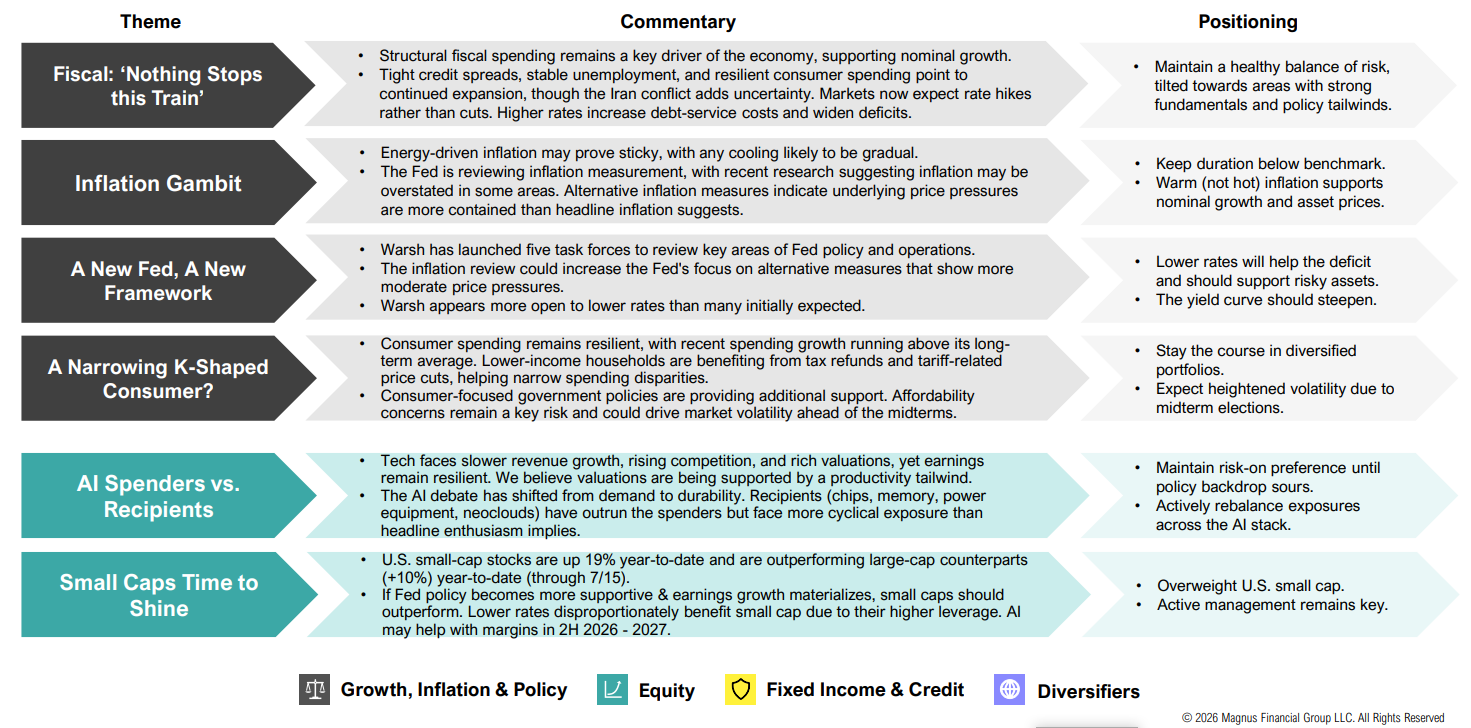
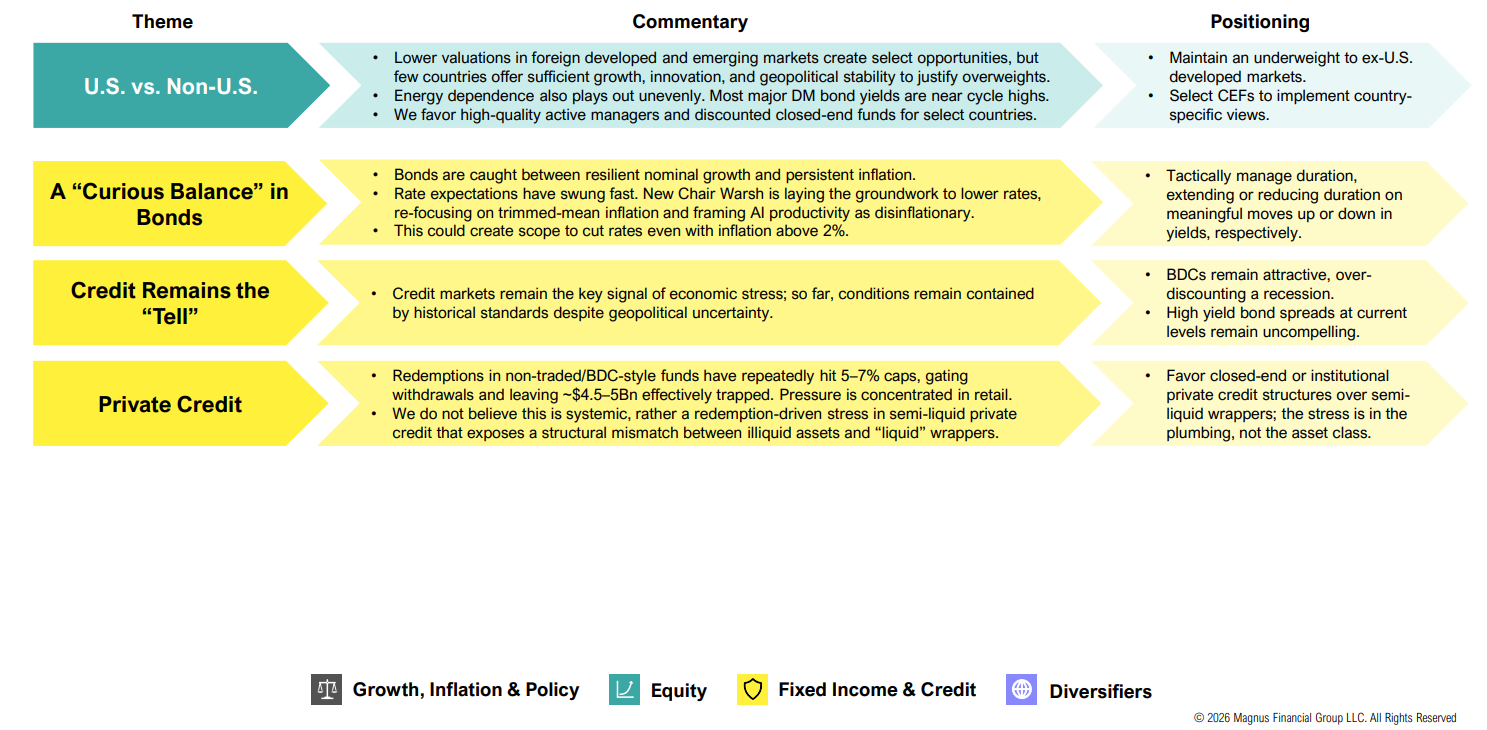
Positioning

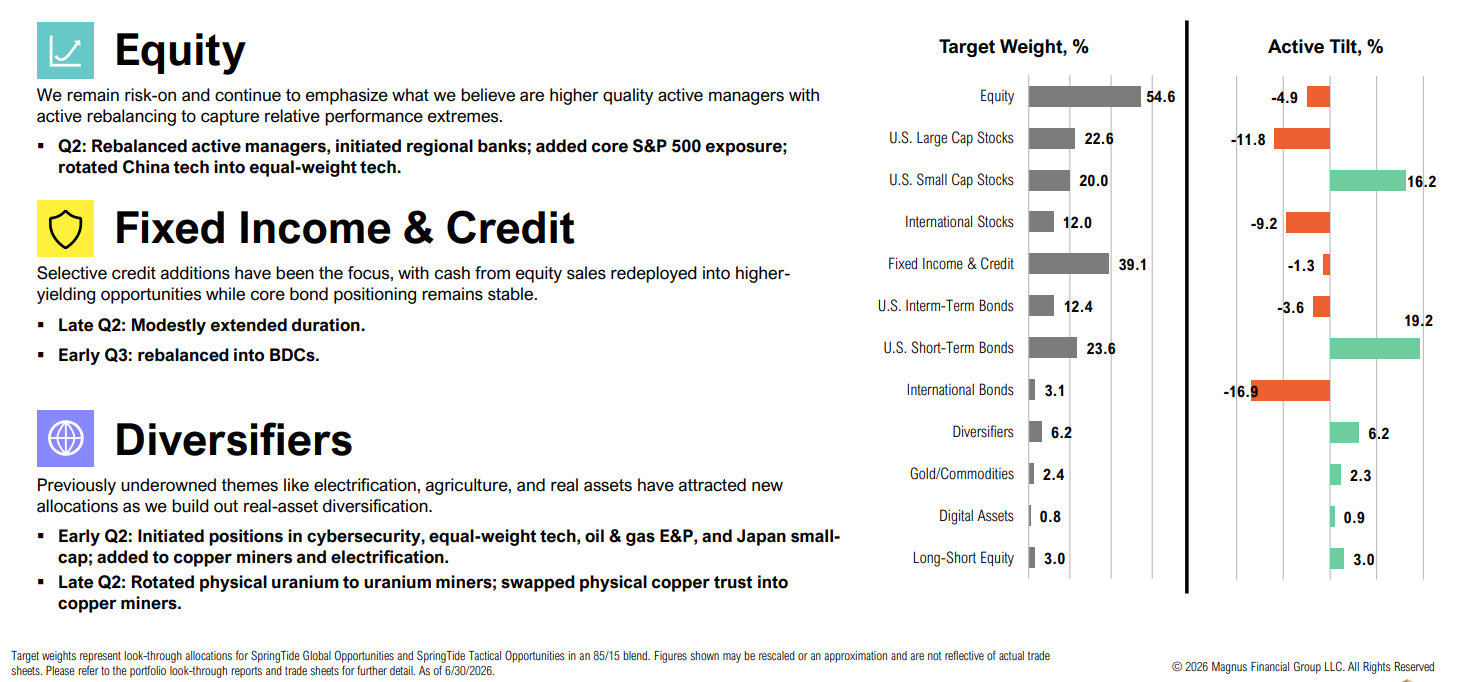
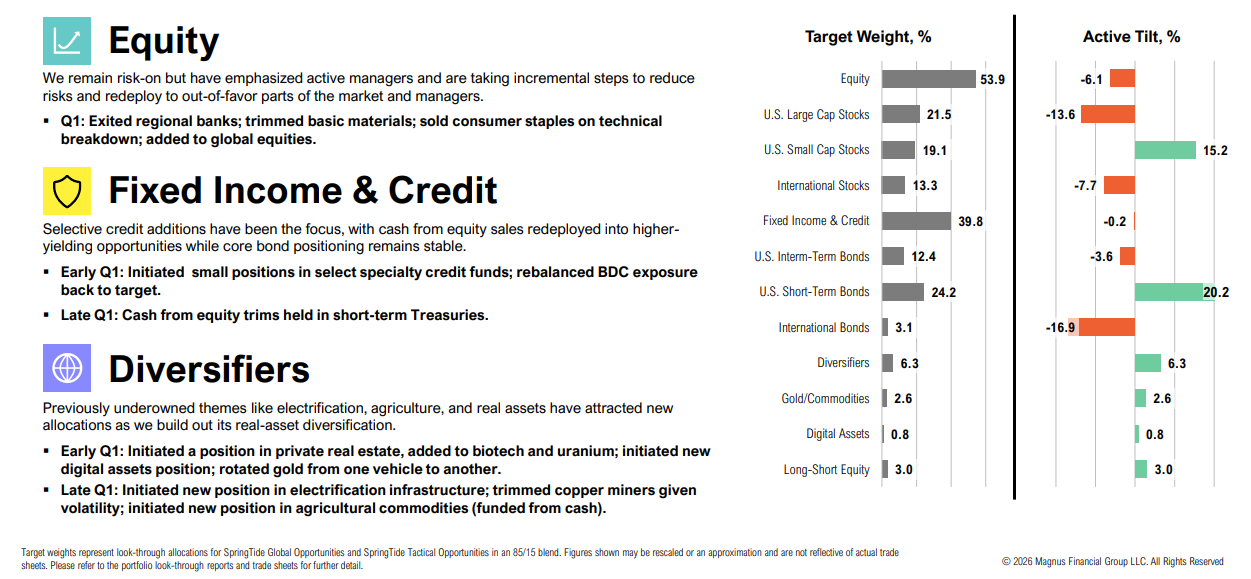
Portfolio allocation chart with target weights and tilts

Growth, Inflation & Policy

Recent energy-driven inflation pressures point to possibly slower and more uneven disinflation than previously expected. While inflation is unlikely to spiral given softening labor conditions and shelter disinflation, monetary policy is likely to remain restrictive for longer, with easing delayed and less aggressive than earlier 2026 expectations suggested.

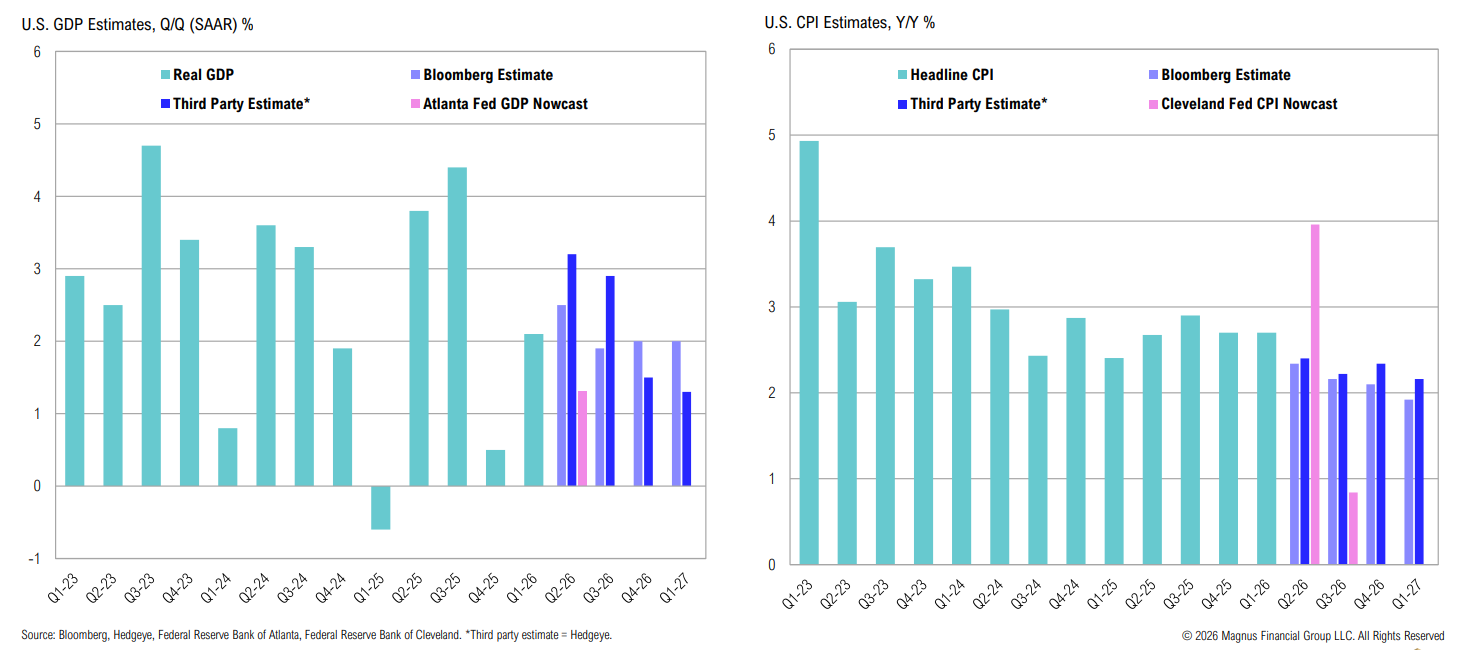
Economic Growth

The U.S. economy is expected to grow around 2% through Q1’27 with inflation expected to roll over (but remain >2%) over the same period
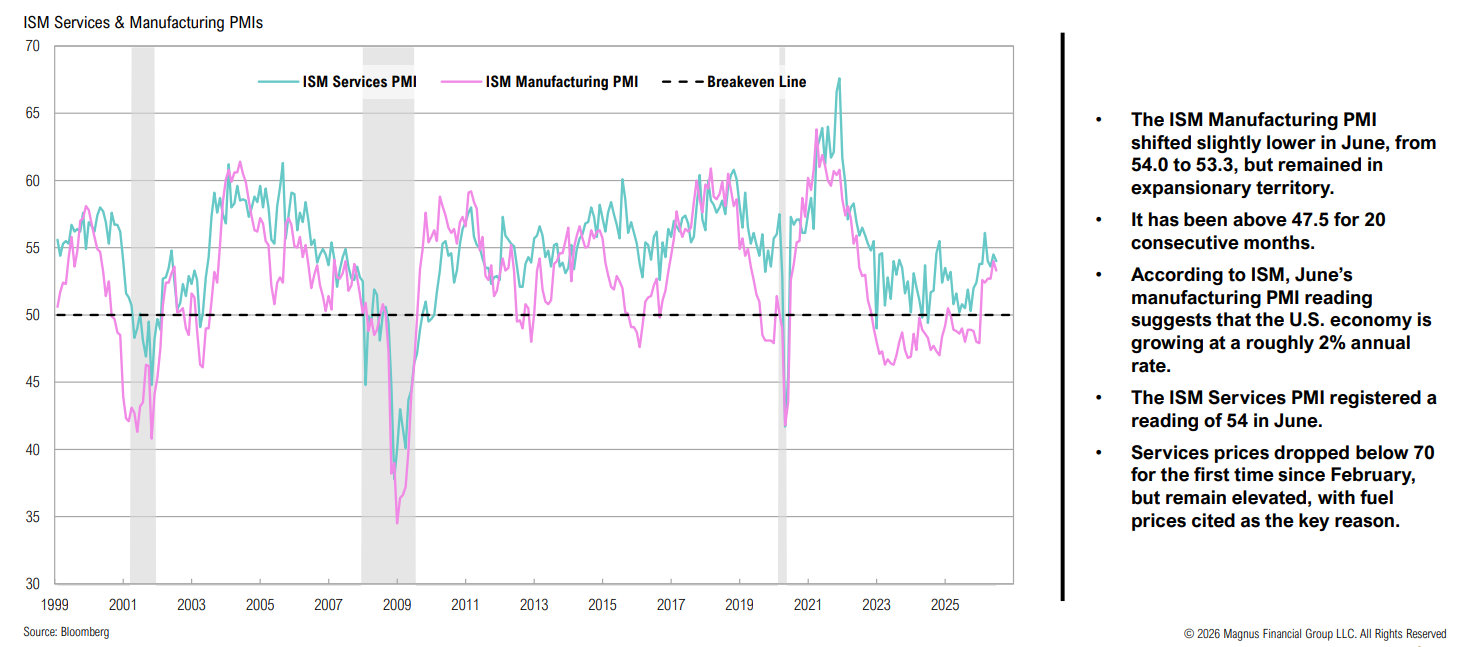
ISM PMIs remain in expansionary territory
“The rapid expansion of AI data centers has created an extraordinary surge in demand for memory and storage. We have never seen a component price increase this much, this quickly. We have shielded our customers from these increases so far, but we have now reached a point where we need to begin raising prices on a number of products, including today’s increases for iPad and Mac.”

Apple

Energy & Inflation

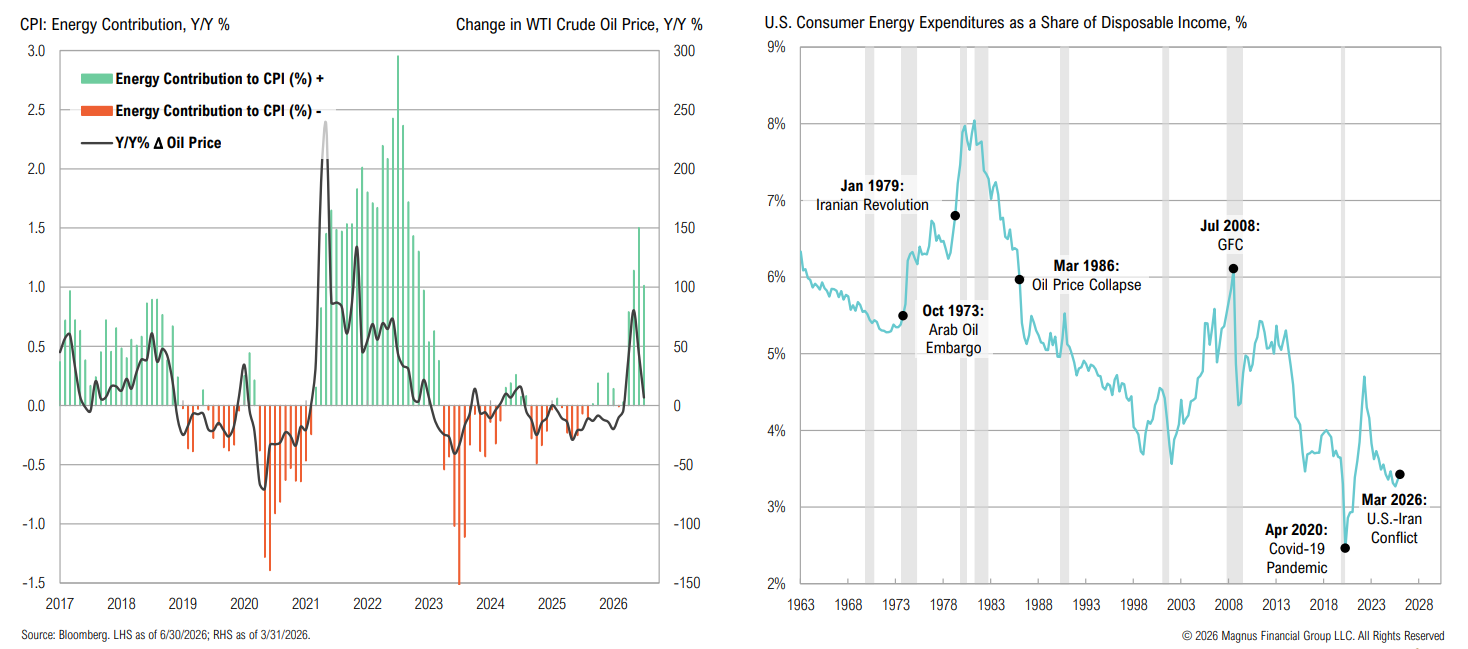
Energy prices have jumped, driving a reacceleration in CPI; before the U.S.-Iran conflict, U.S. household energy spending was near a record low at just 3.4% of disposable income
U.S Consumer

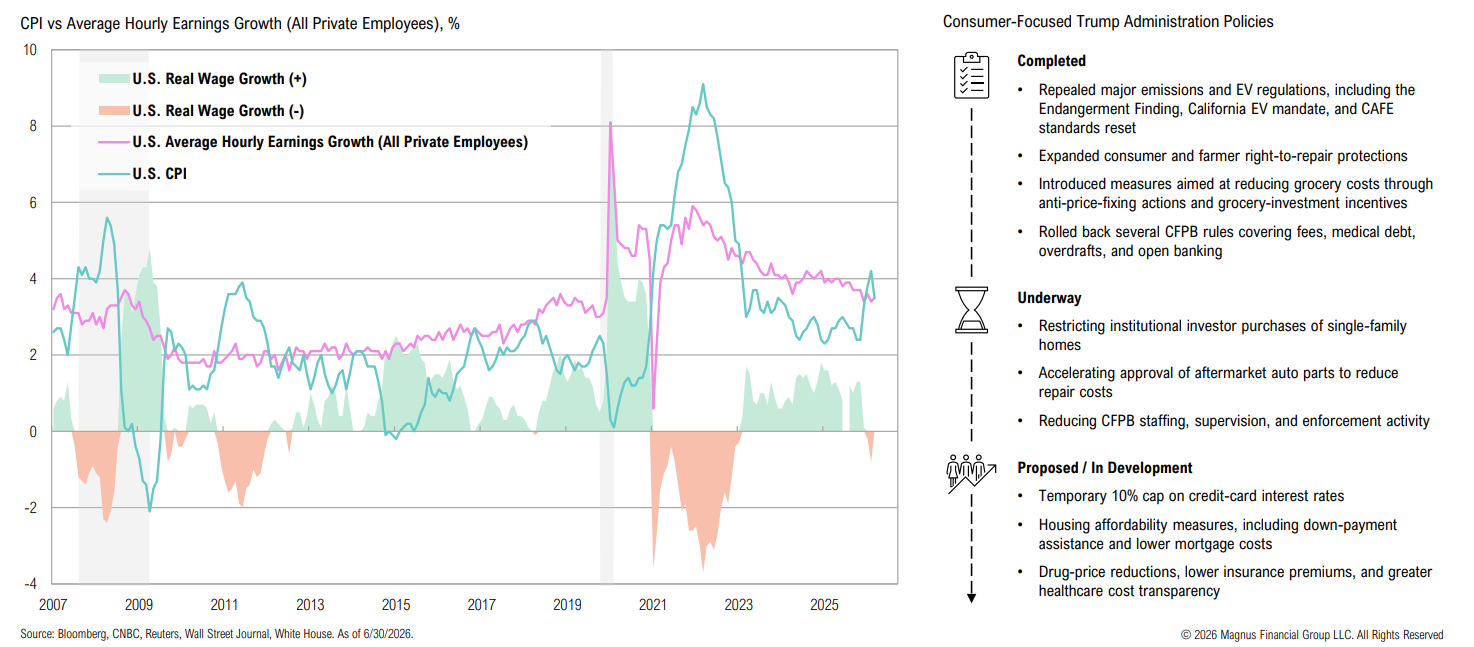
Wage growth is falling behind CPI; the Trump administration is focusing on several consumer-related policies to help alleviate pressure on lower-income HHs
U.S. Tax Refunds

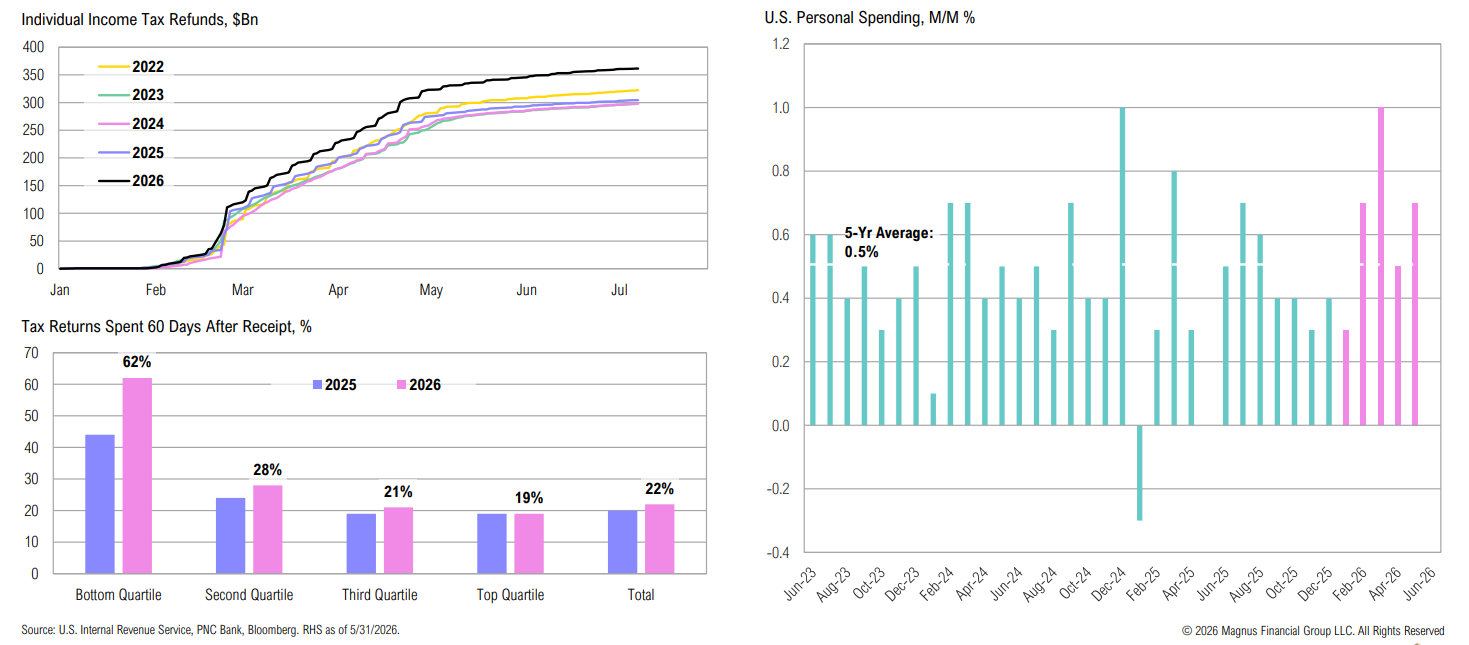
Larger and faster-spent tax refunds, especially among lower income households, may be fueling the recent pickup in personal spending
Labor Market

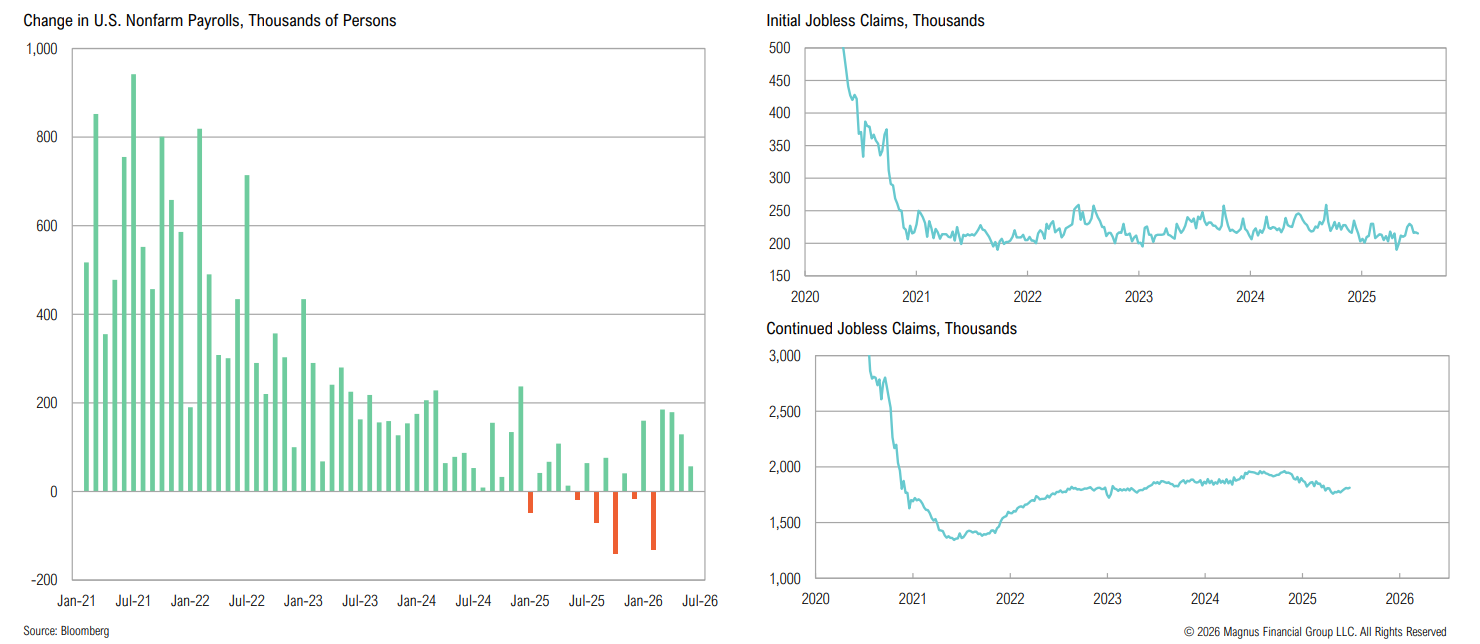
While there is little evidence yet, a rollover in job openings alongside rising jobless claims would signal the kind of labor market weakness that could enable the Fed to cut rates
Fed Policy

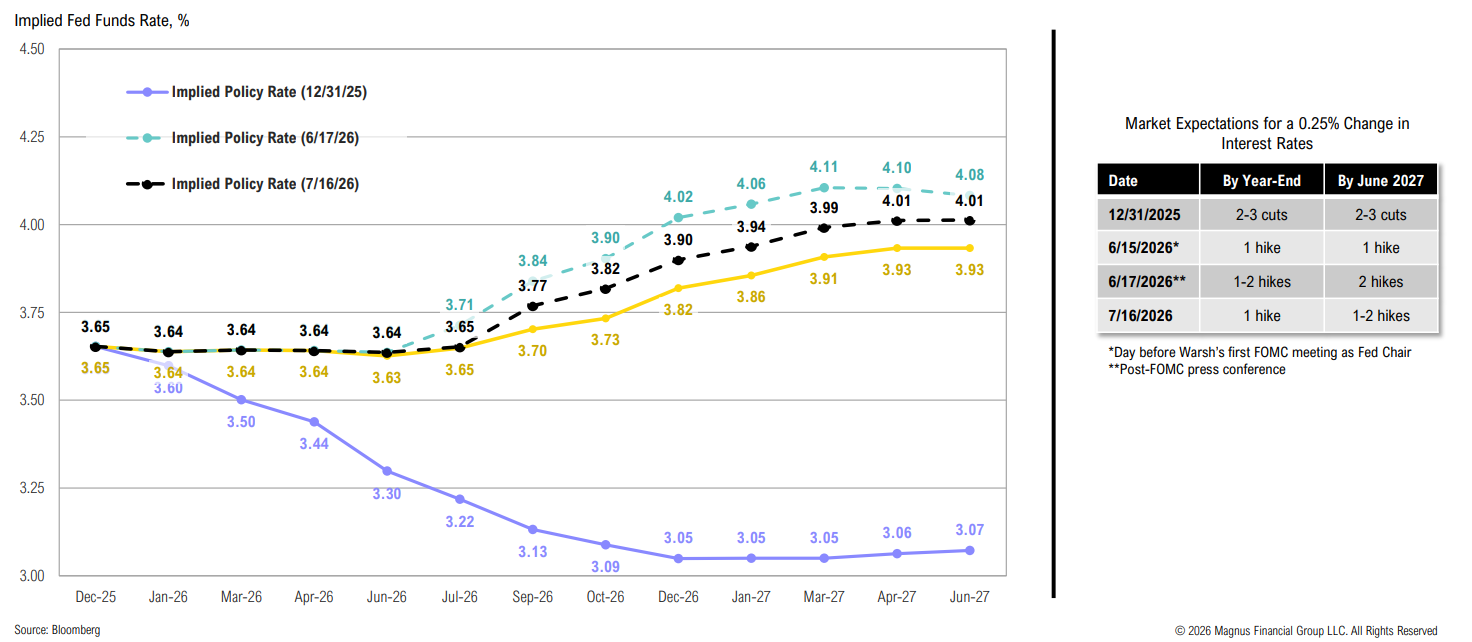
Rapid repricing of the path for interest rates reflects inflationary pressures stemming from the Iran conflict and the continued resilience of the U.S. economy
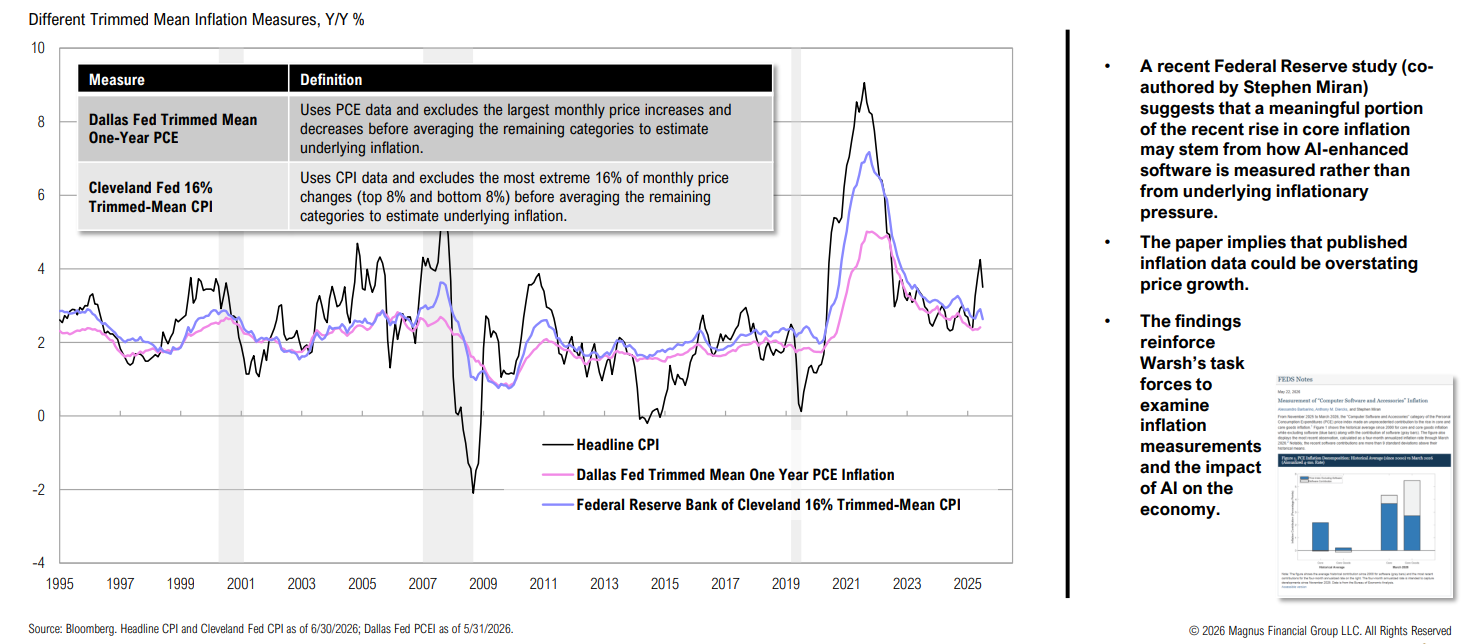
Trimmed mean inflation measures suggest underlying inflation pressures remain more contained than headline readings imply
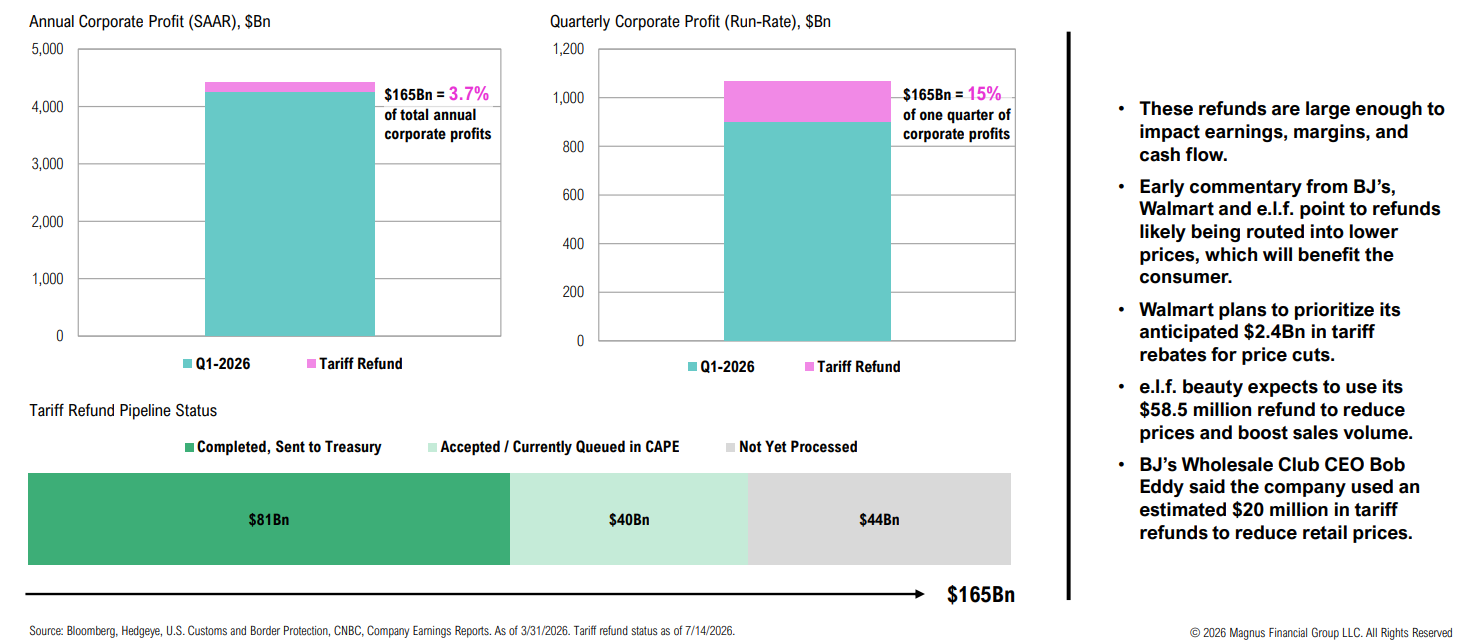
Tariff Refunds

An estimated $165Bn in tariff revenue is expected to be refunded
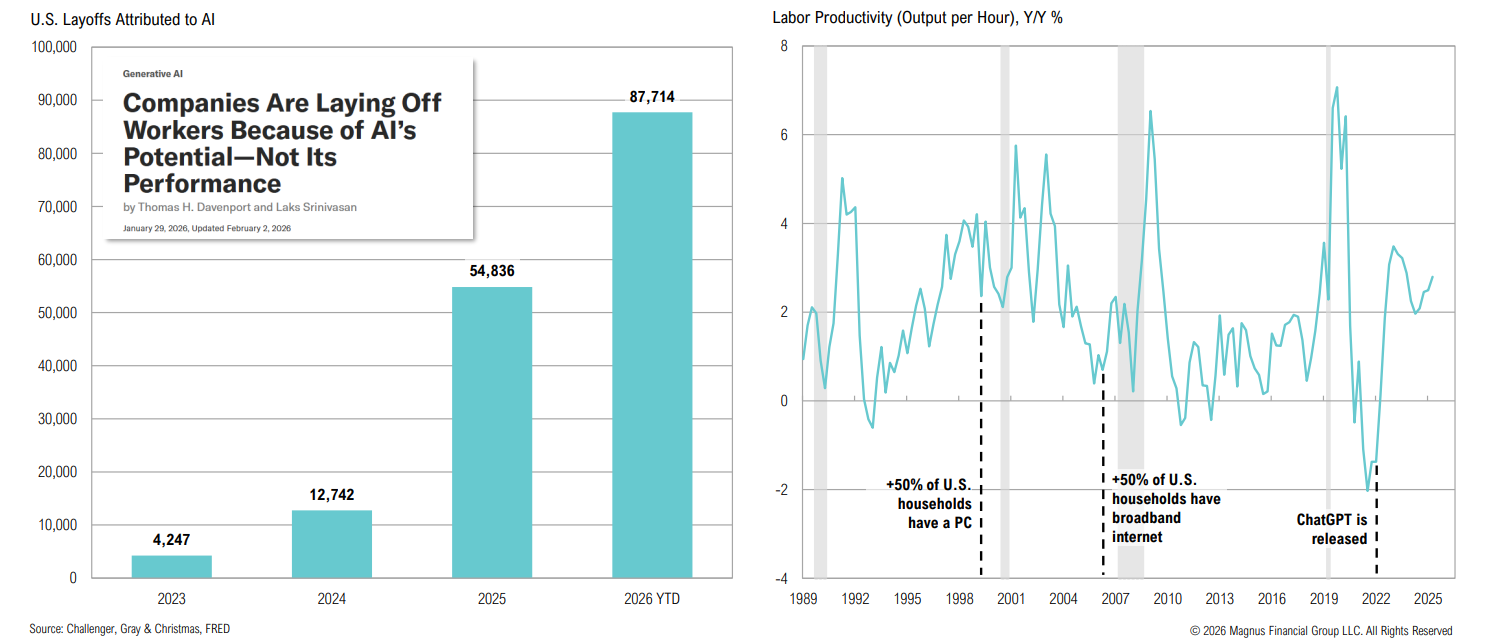
AI Productivity

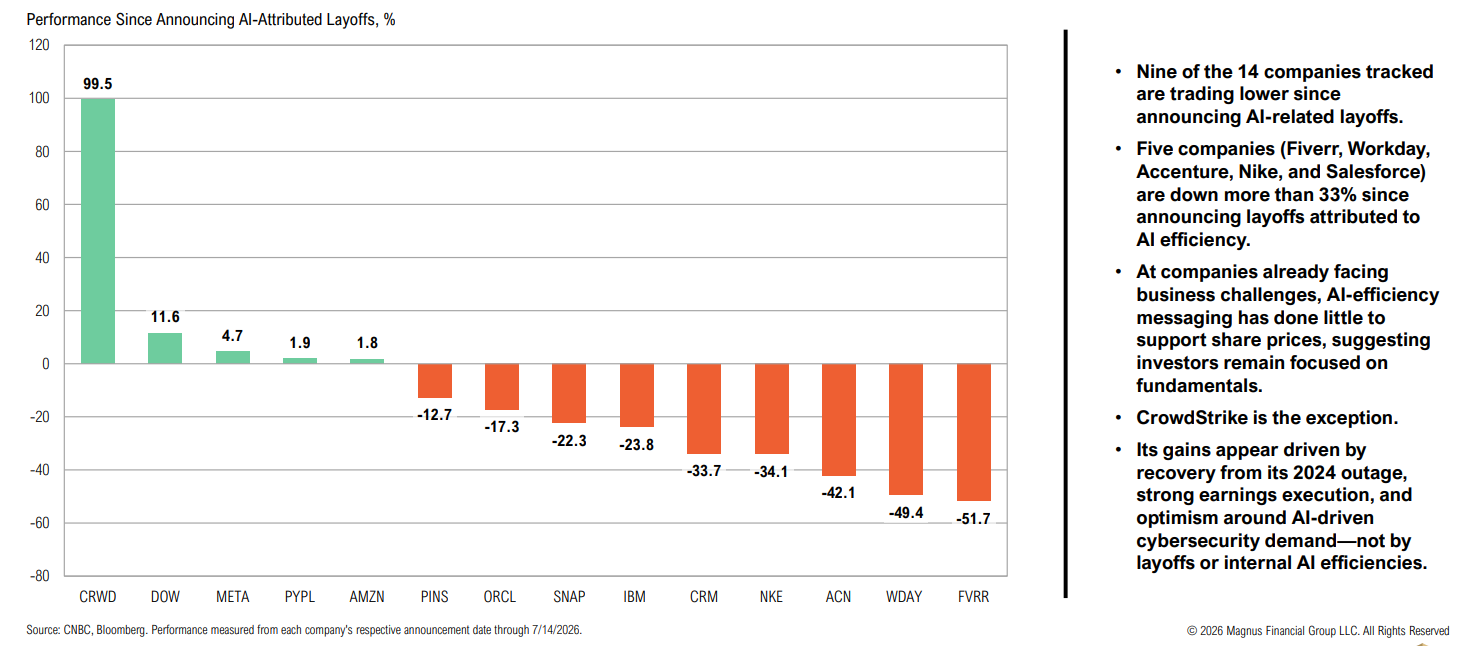
AI-attributed layoffs are accelerating, but “AI washing” is part of it; aggregate nonfarm productivity data doesn’t yet show a sustained increase
Evidence of “AI washing”? AI-efficiency messaging has not offset weak fundamentals at companies like Nike, Workday, and Accenture
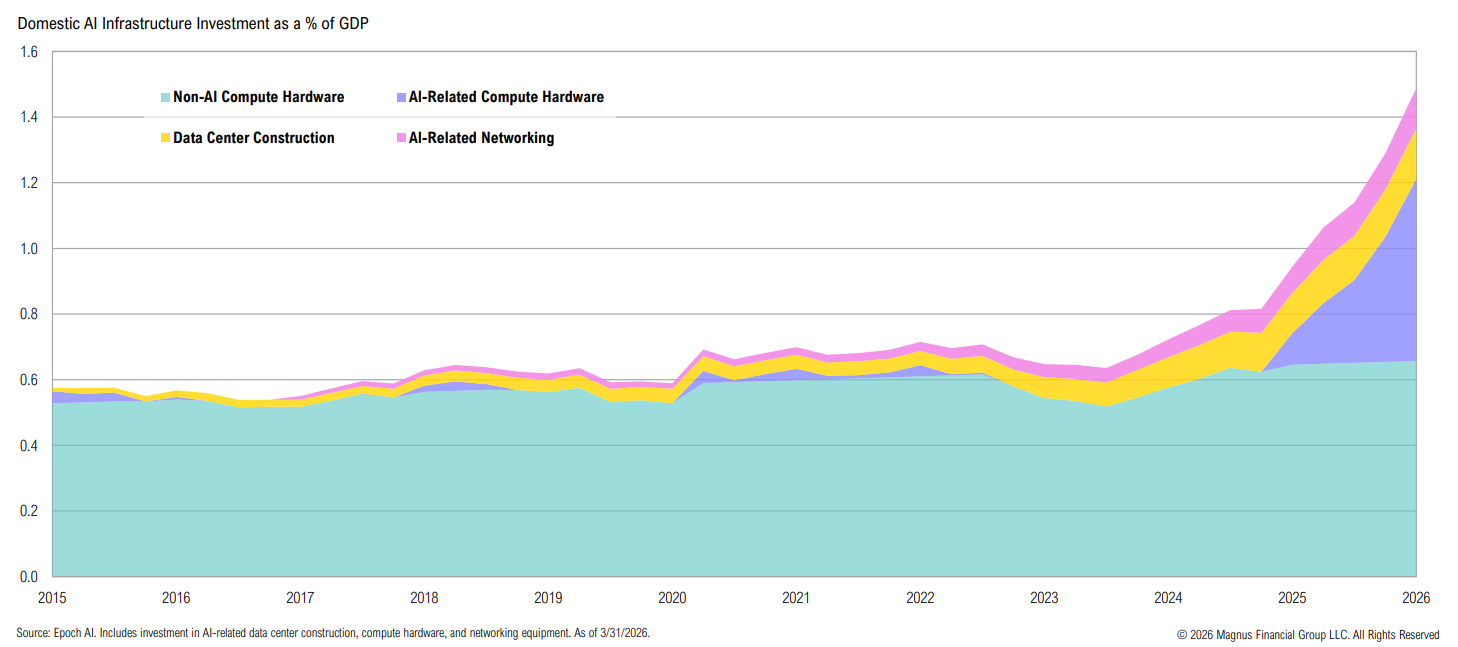
AI & GDP Growth

Since 2023, AI infrastructure has doubled computing’s share of U.S. GDP
Equity

U.S. corporate earnings remain resilient, supported by continued AI-related investment. Valuations for U.S. large-cap stocks remain elevated, while small caps have staged a rebound. Both small- and large-cap performance continues to be underpinned by constructive forward earnings expectations.


AI

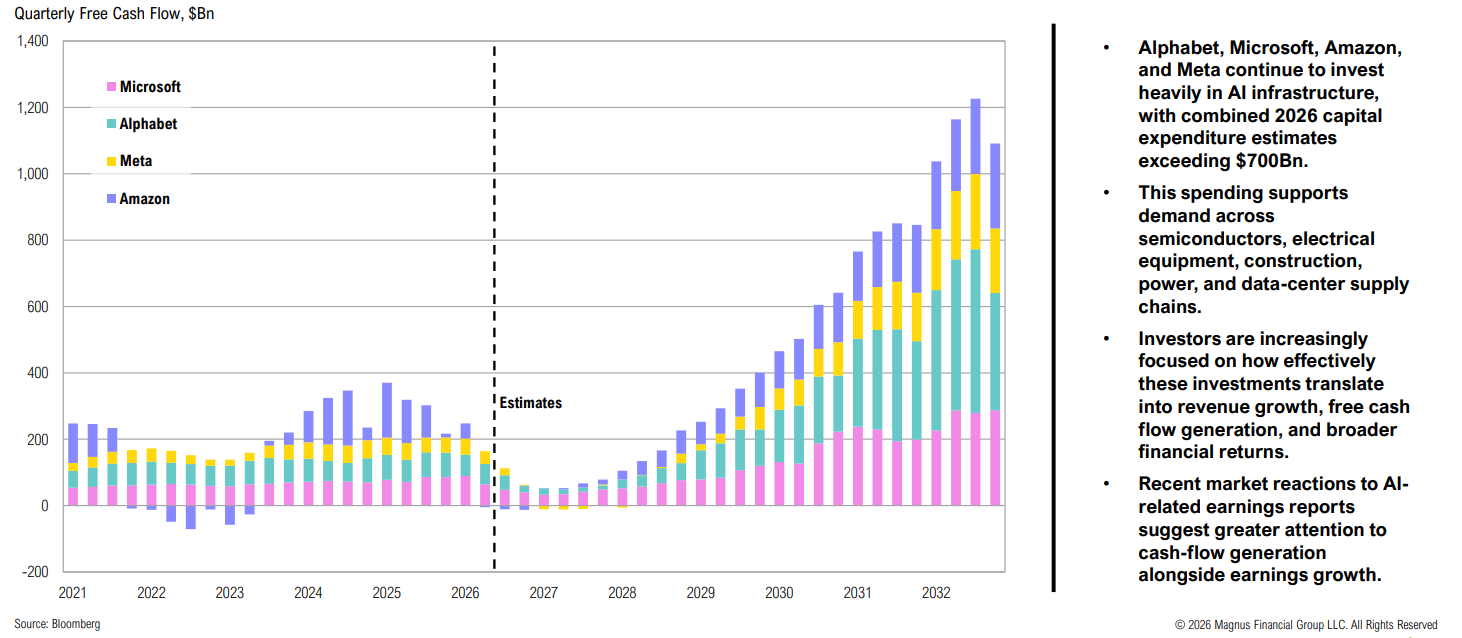
2027 hyperscaler capex is expected to exceed 2026 by nearly $200Bn; cumulative AI-related spend is expected to reach several trillion dollars over the next 5 years
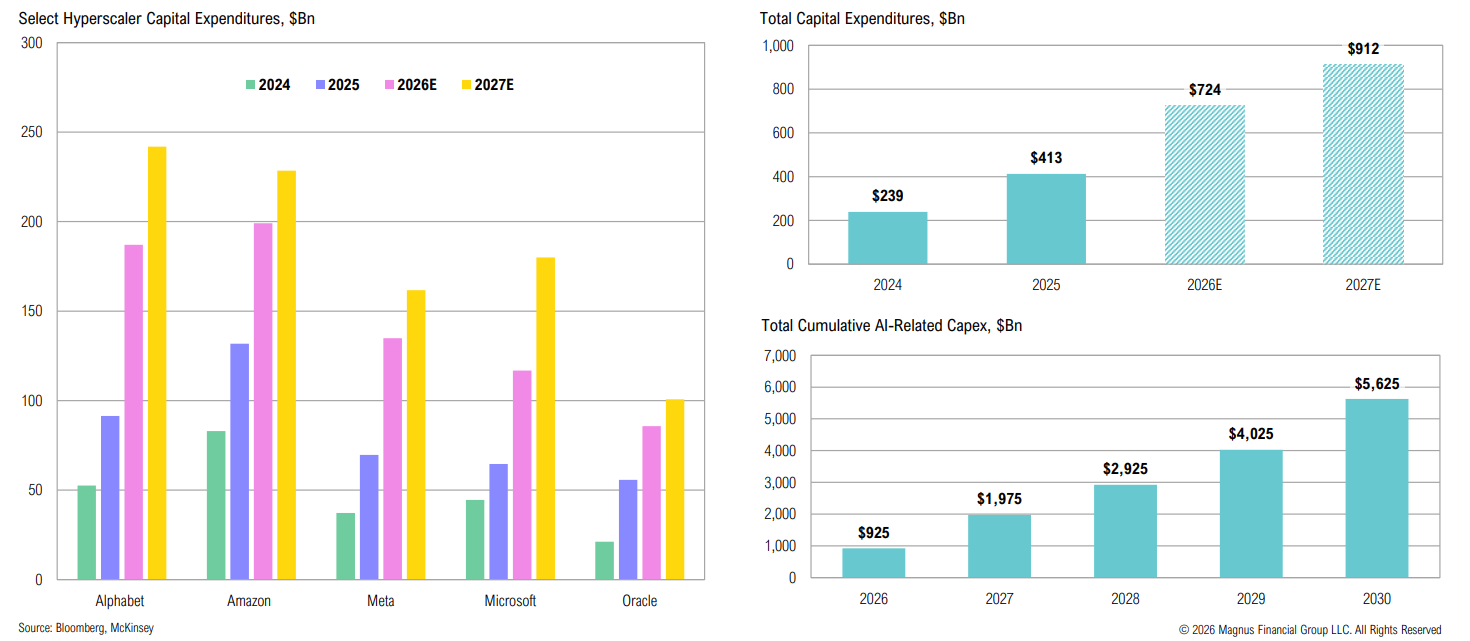
 

Free cash flow of several hyperscalers is expected to dwindle in the coming quarters as capex intensifies, before accelerating in 2029
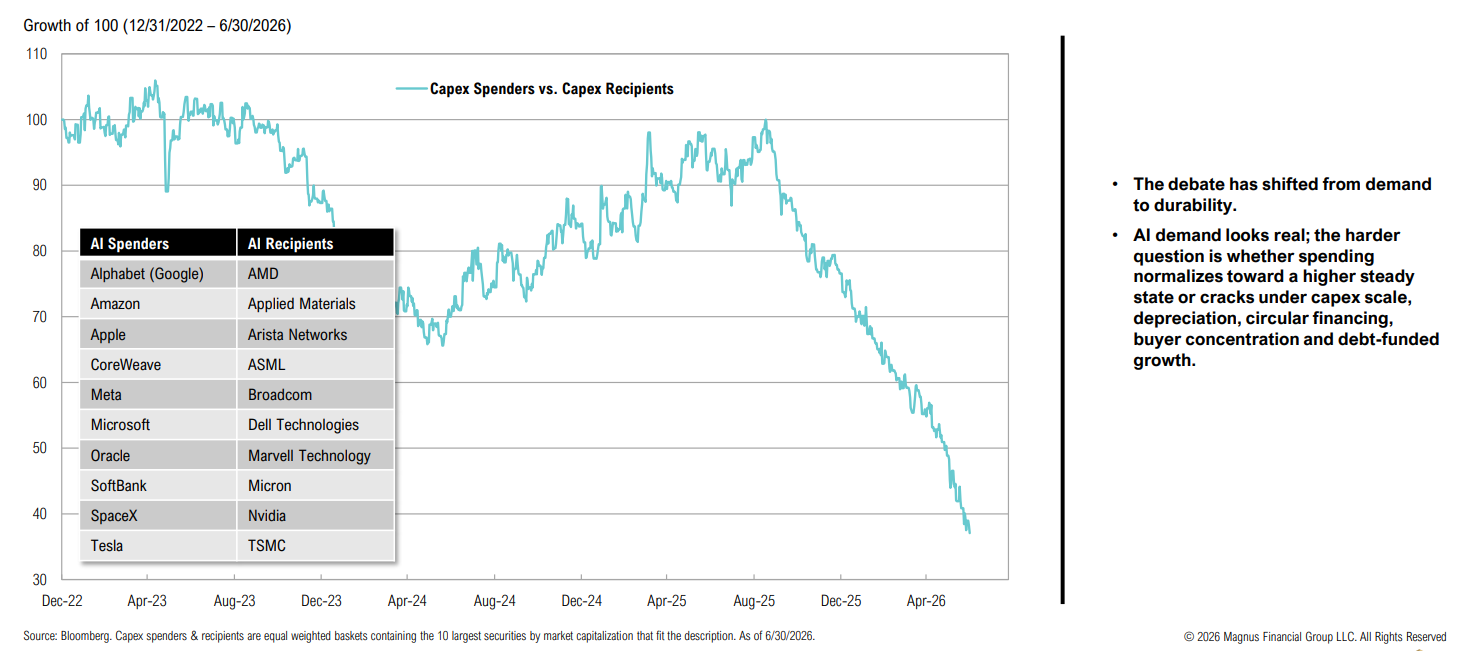
The recipients of AI capex have been outperforming capex spenders
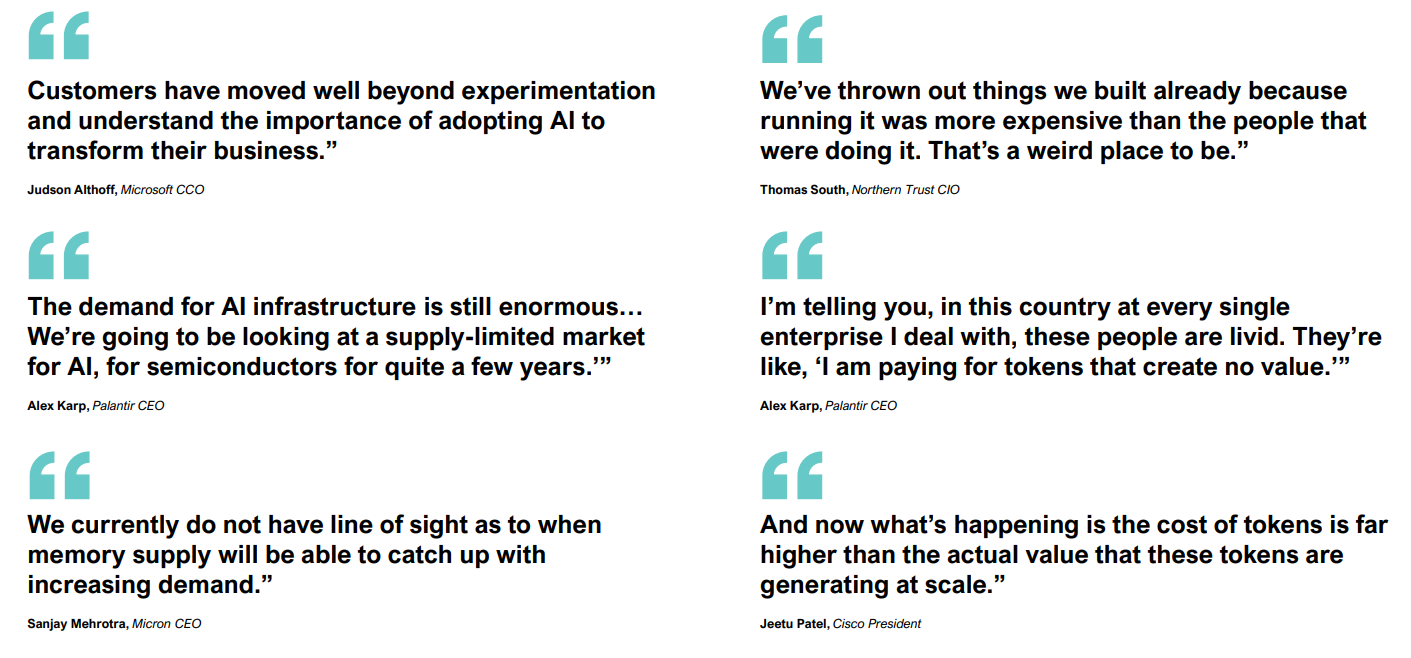
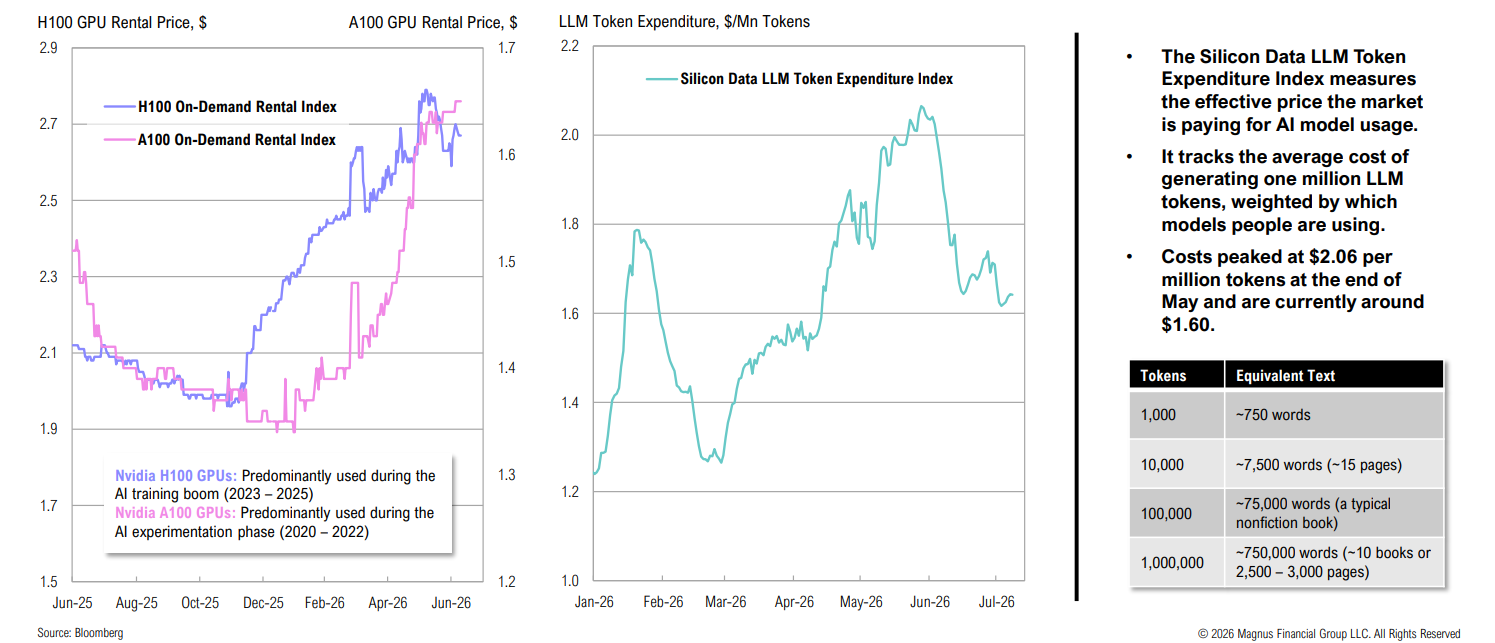
Elevated prices across older chips suggest AI compute demand remains supply-constrained, even as token costs decline
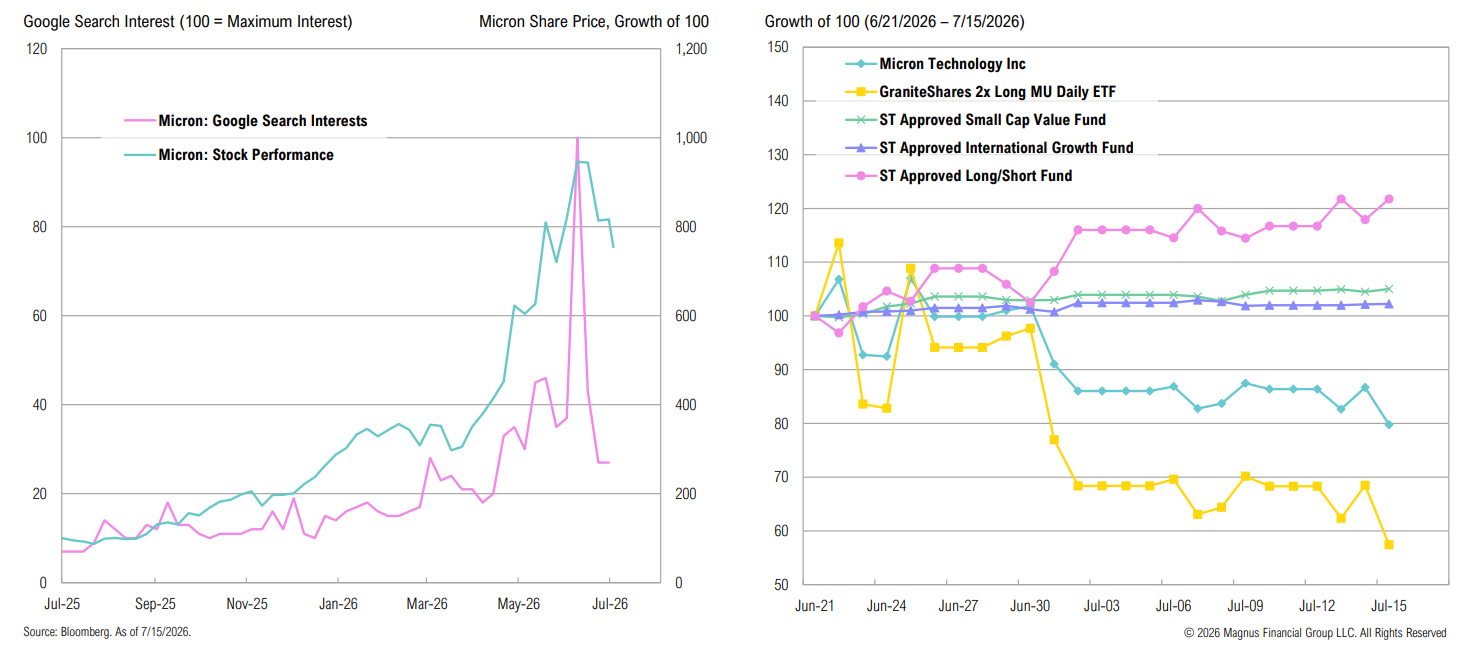
Case study: Micron v Cisco

U.S. small cap earnings and sales growth estimates are expected to stair-step higher and remain well above levels seen over the past two years through Q4’27
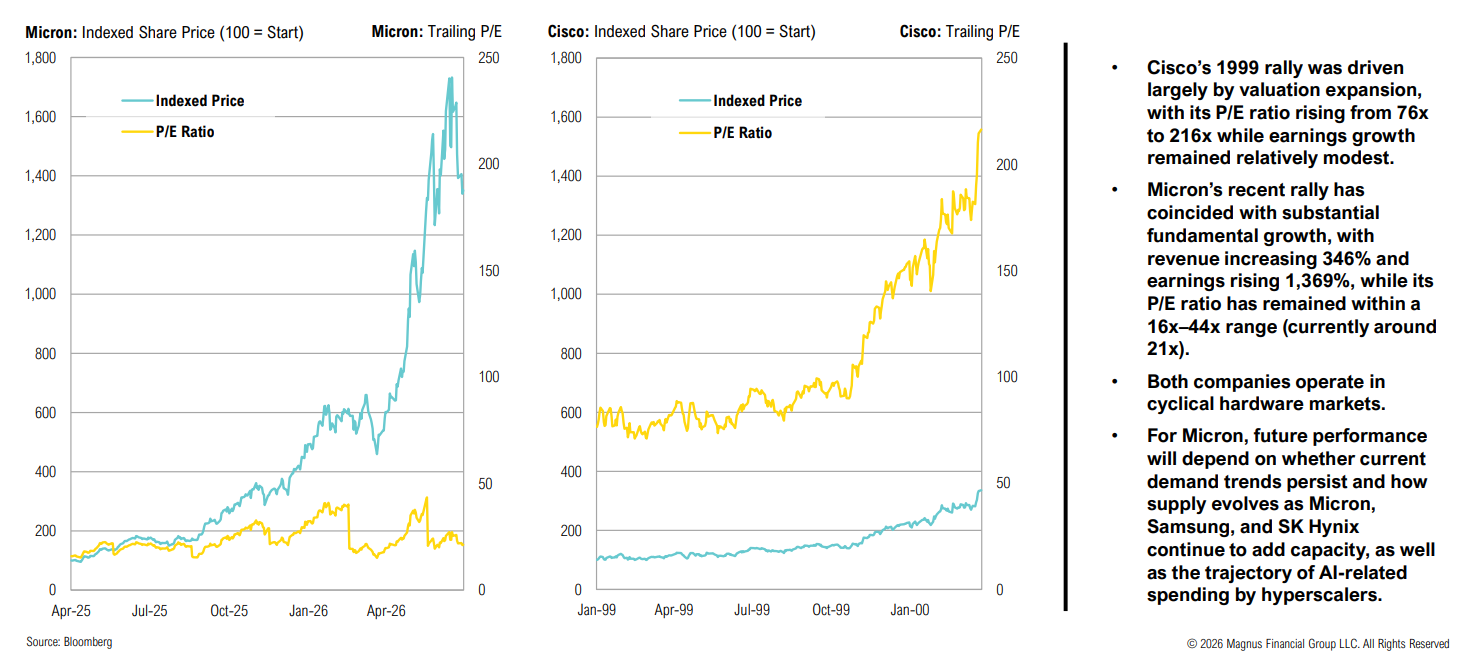
A reminder that by the time everyone is talking about it, it’s usually all priced in; rebalancing diversified portfolios is still the best way to play this in our view
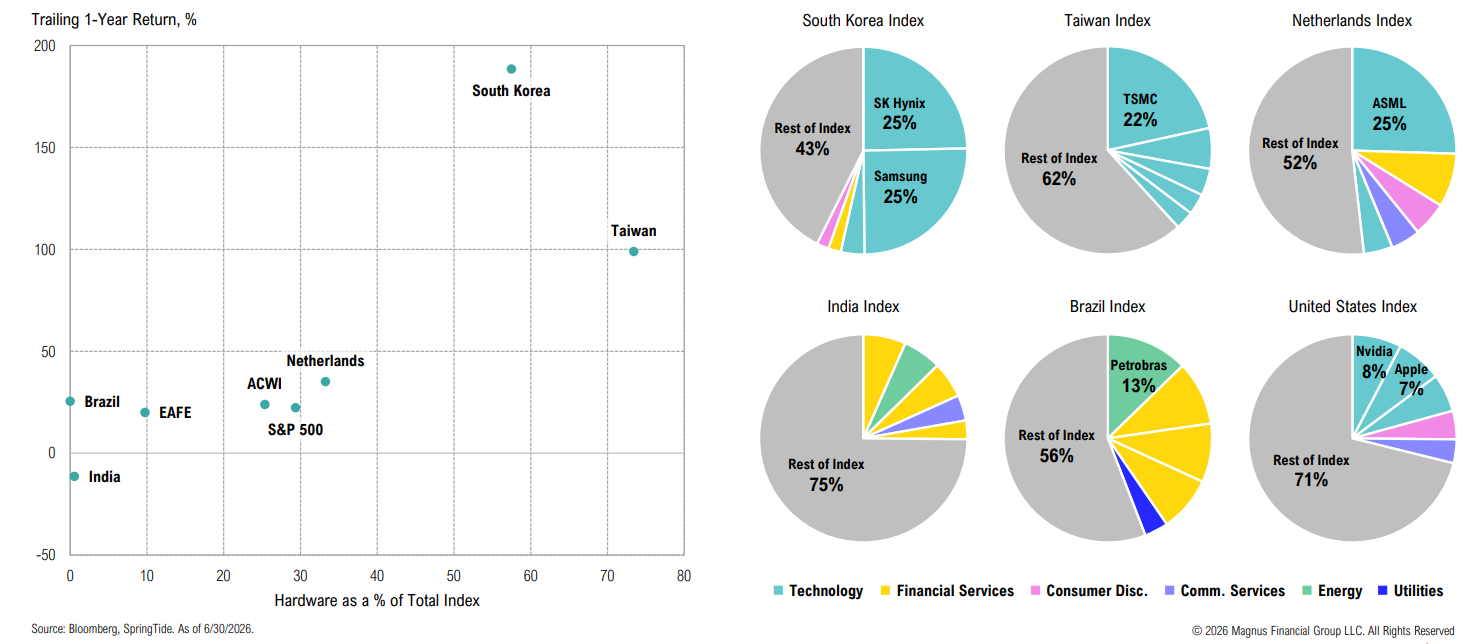
Hardware-driven outperformance in Korea and Taiwan is concentrated in just a handful of companies, unlike more diversified markets such as the U.S.
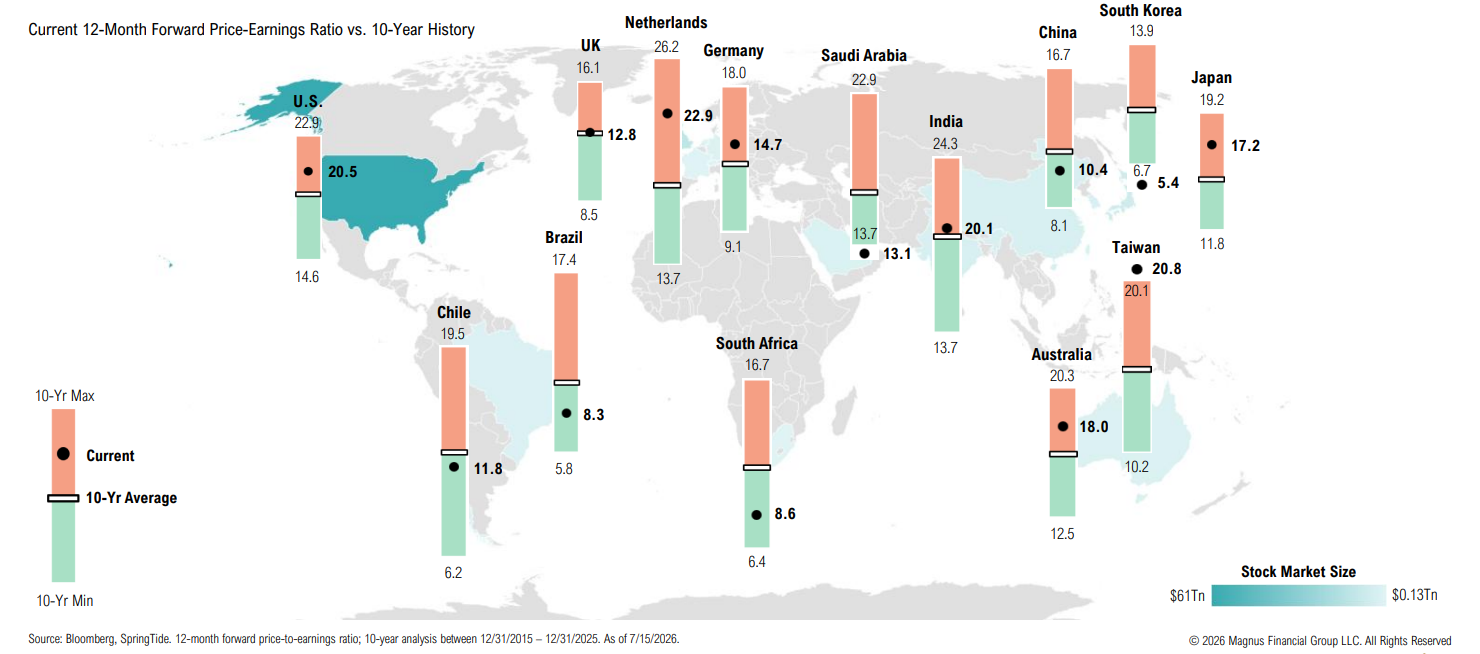
Global Valuations

While U.S. valuations remain elevated, parts of Europe, Asia and emerging markets show value
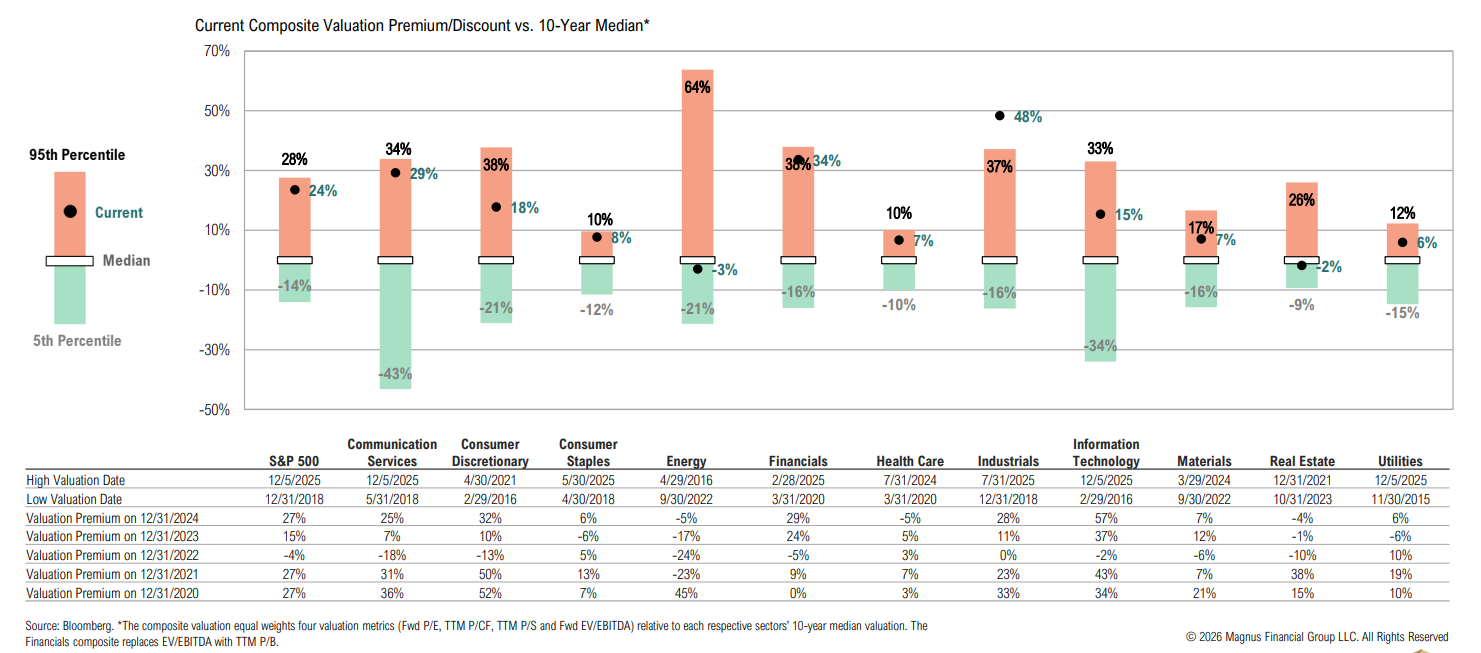
U.S. Large-Cap Valuation

S&P 500 composite valuations are elevated but below extreme levels; energy and real estate are the only sectors showing some value
U.S. Large-Cap Earnings Growth

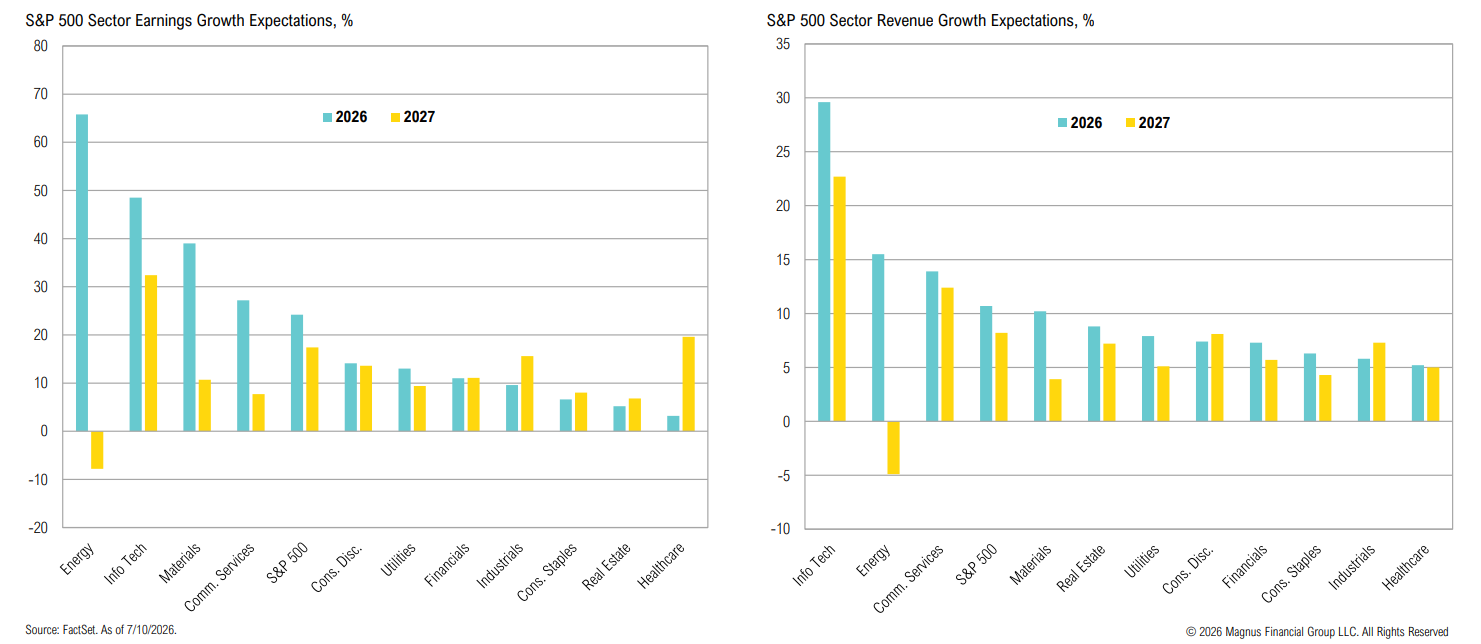
Earnings and revenue growth are expected to broaden in 2027, with leadership becoming less concentrated across sectors
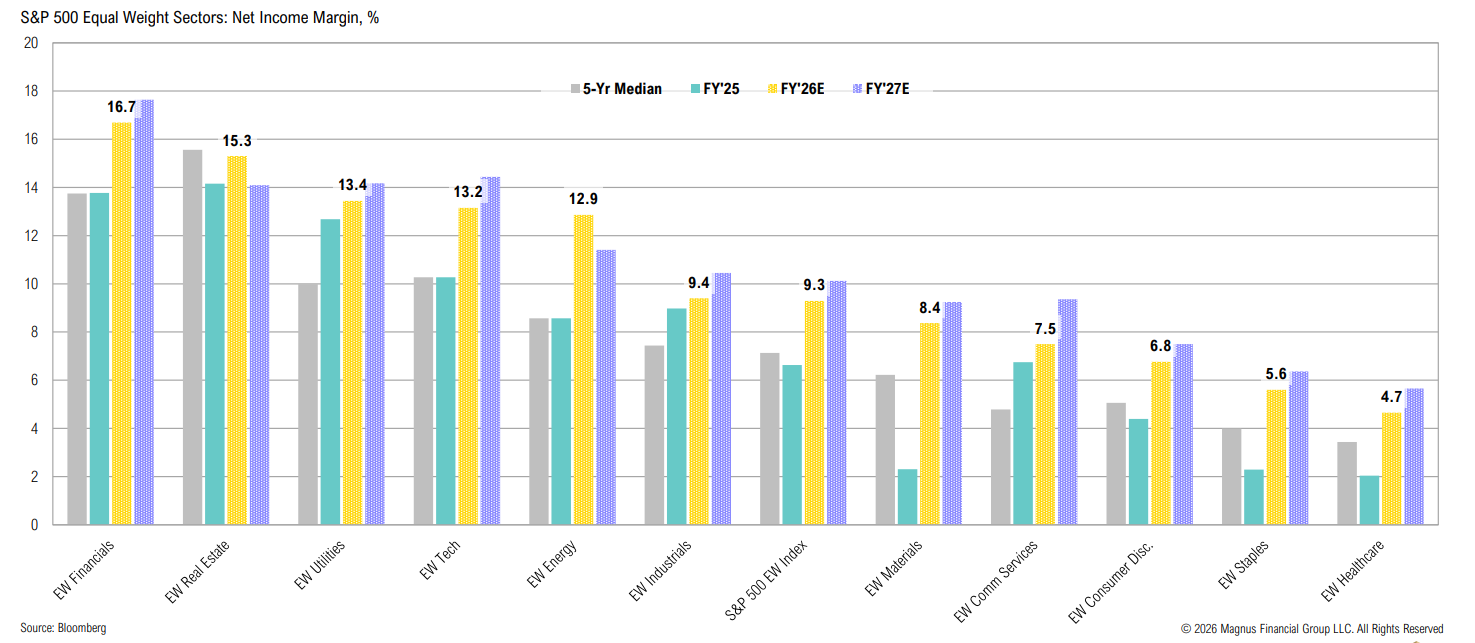
All equal-weighted S&P 500 sectors are expected to see margin expansion in 2026, suggesting a broadening earnings expansion that extends beyond mega-cap tech
IPO Activity

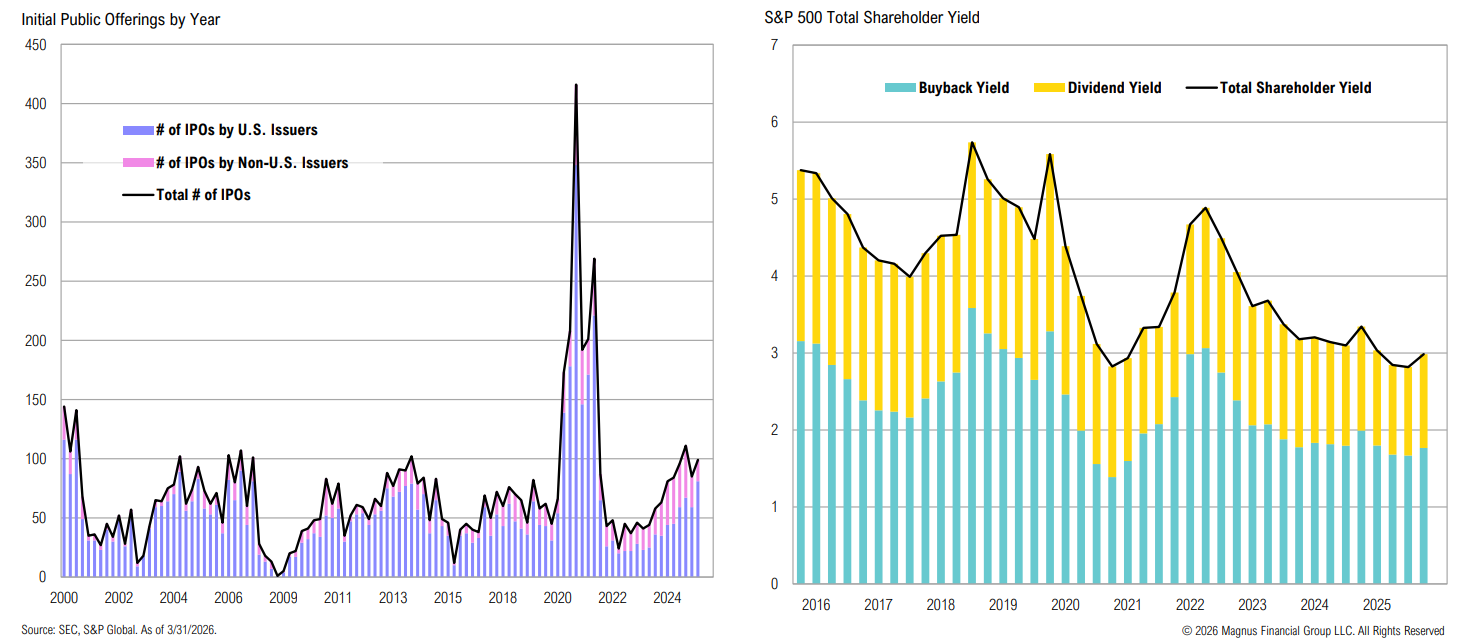
Liquidity drain: Rising IPO activity is absorbing stock market liquidity; the AI buildout is expected to drive dividend and buyback yields lower, reducing a key source of liquidity
Fixed Income & Credit

The yield curve shifted higher (particularly on the short end), driven by elevated inflation expectations and amplified by the Iran-driven energy price shock. Credit spreads remain contained relative to history, suggesting continued economic resilience and markets still comfortable with current levels of fiscal spending.

Corporate Debt

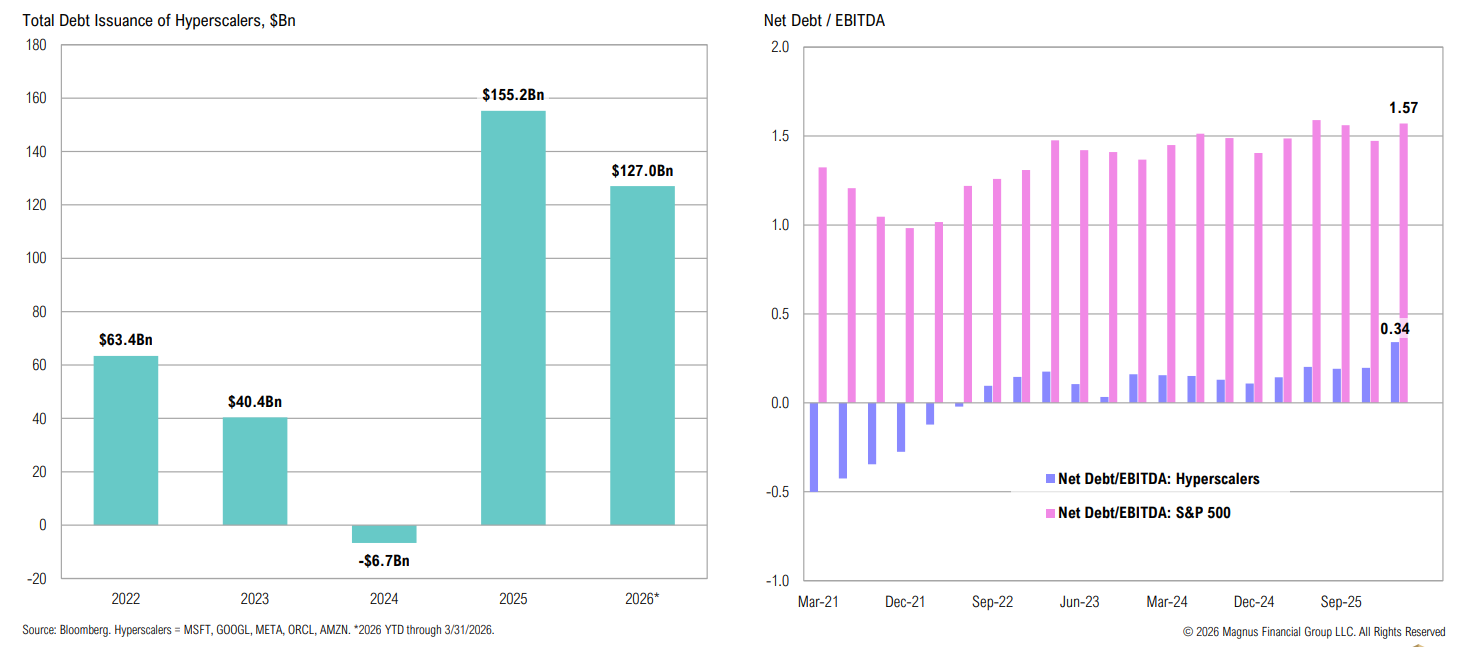
Hyperscalers raised $155Bn of debt in 2025 and a further $127Bn in Q126; despite the sharp increase in issuance, net debt/EBITDA remains ~80% below the S&P 500
Global Bonds

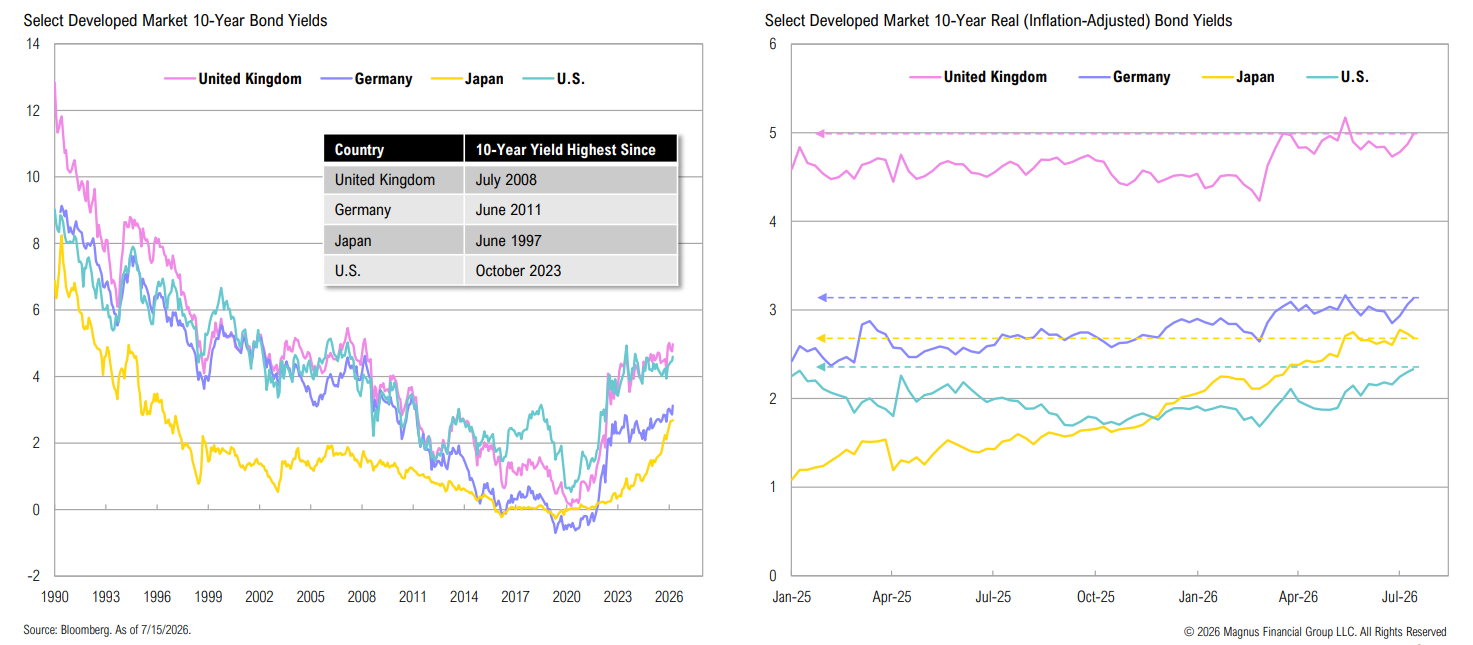
Most major DM bond yields are at the highest level since the late 1990s/mid-2000s; the 10-year Treasury yield is the only one at the same level today than at the start of 2025
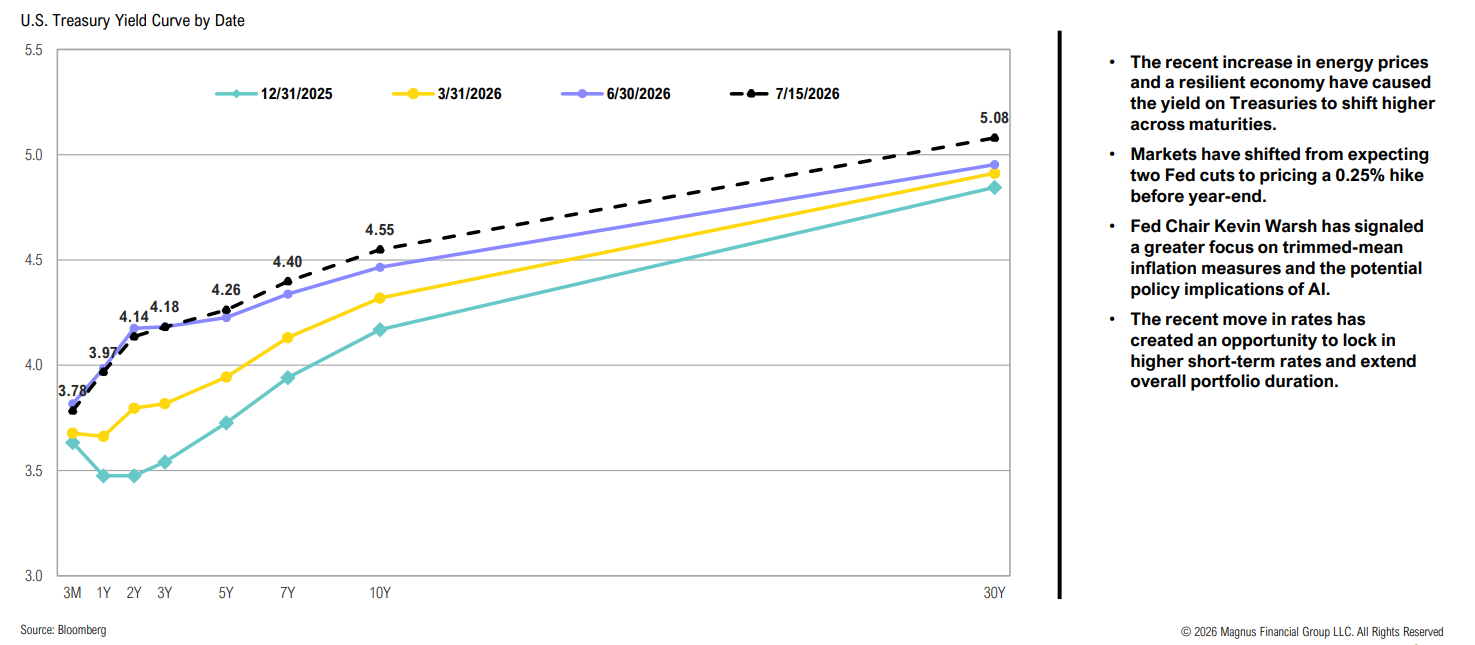
U.S. Treasury Yields

Treasury yields have shifted higher, especially at the short end
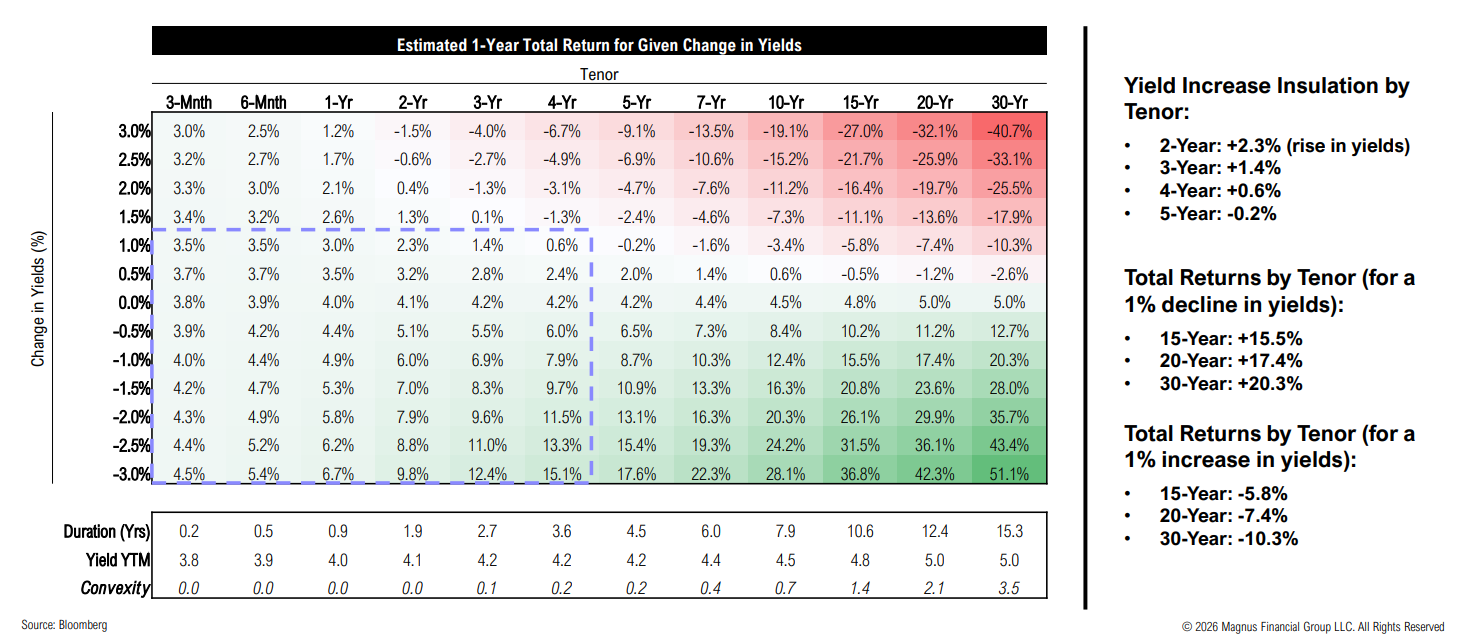
 U.S. Treasury Return Matrix

3-year Treasuries will generate positive returns even with yields rising over 1%,
while 30-year Treasuries would lose ~10% (but earn 20% if yields dropped 1%)
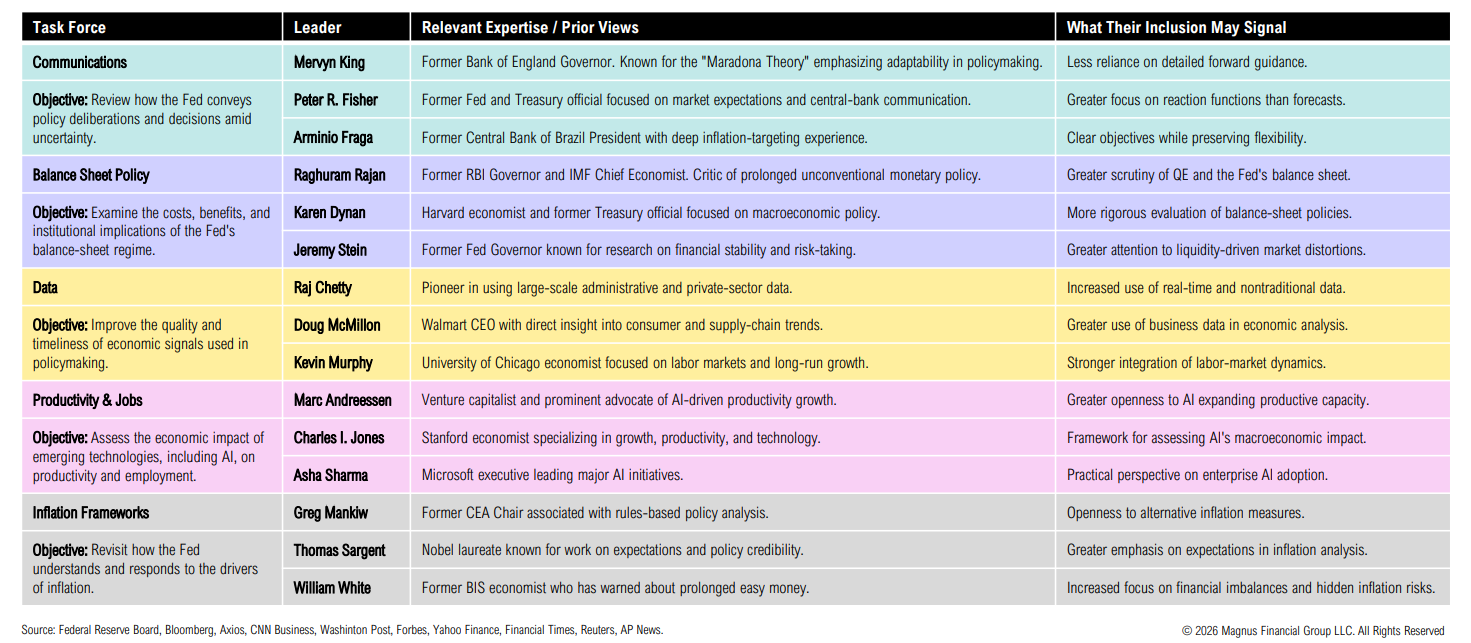
Fed Policy

On July 9, Warsh announced the leaders of five task forces; most appointees are respected industry outsiders rather than current Fed insiders
Diversifiers

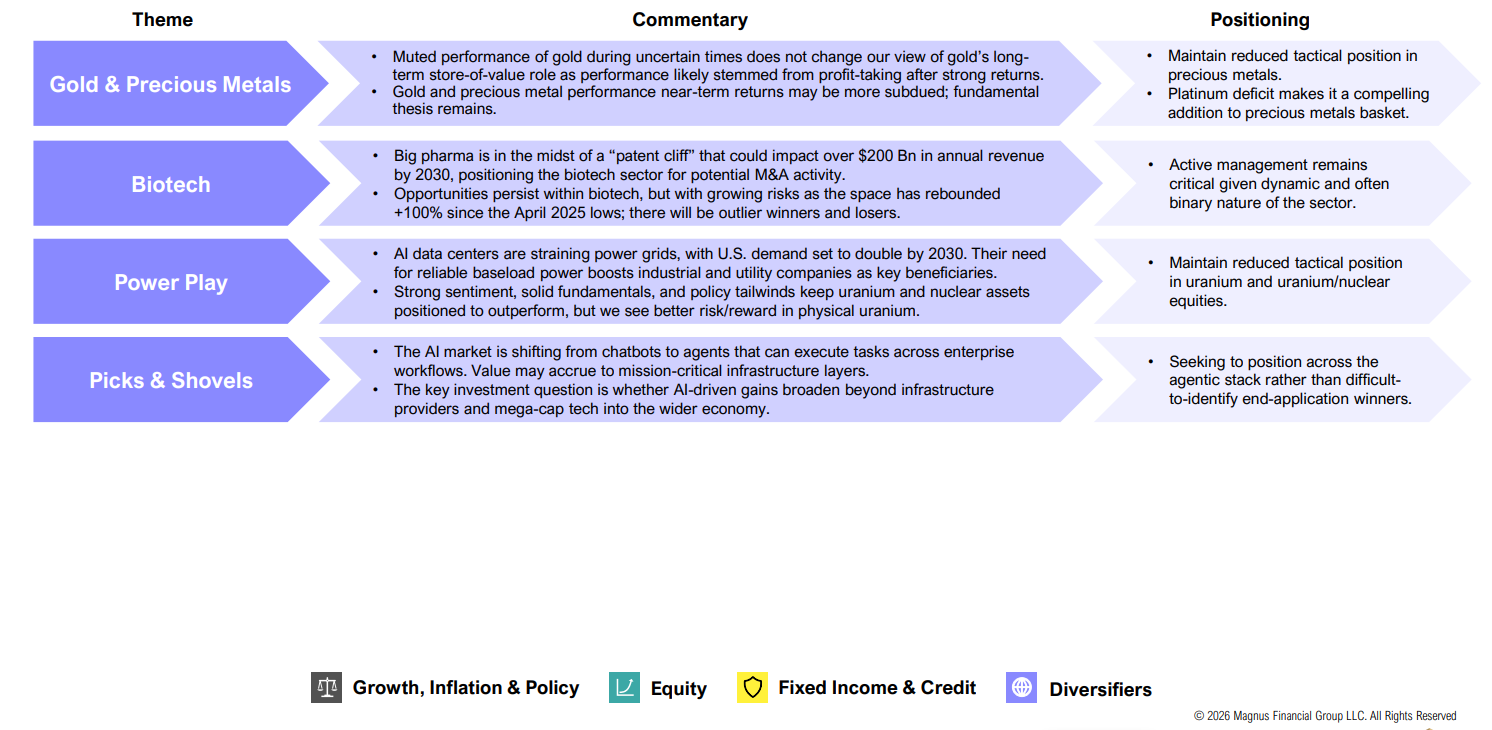
Strong fundamentals and favorable policy developments continue to support the outlook for uranium and nuclear assets. We continue to see opportunities in biotech, discounted closedend funds, and select countries and sectors. Recent private credit concerns are creating opportunities in select BDCs.


Biotech

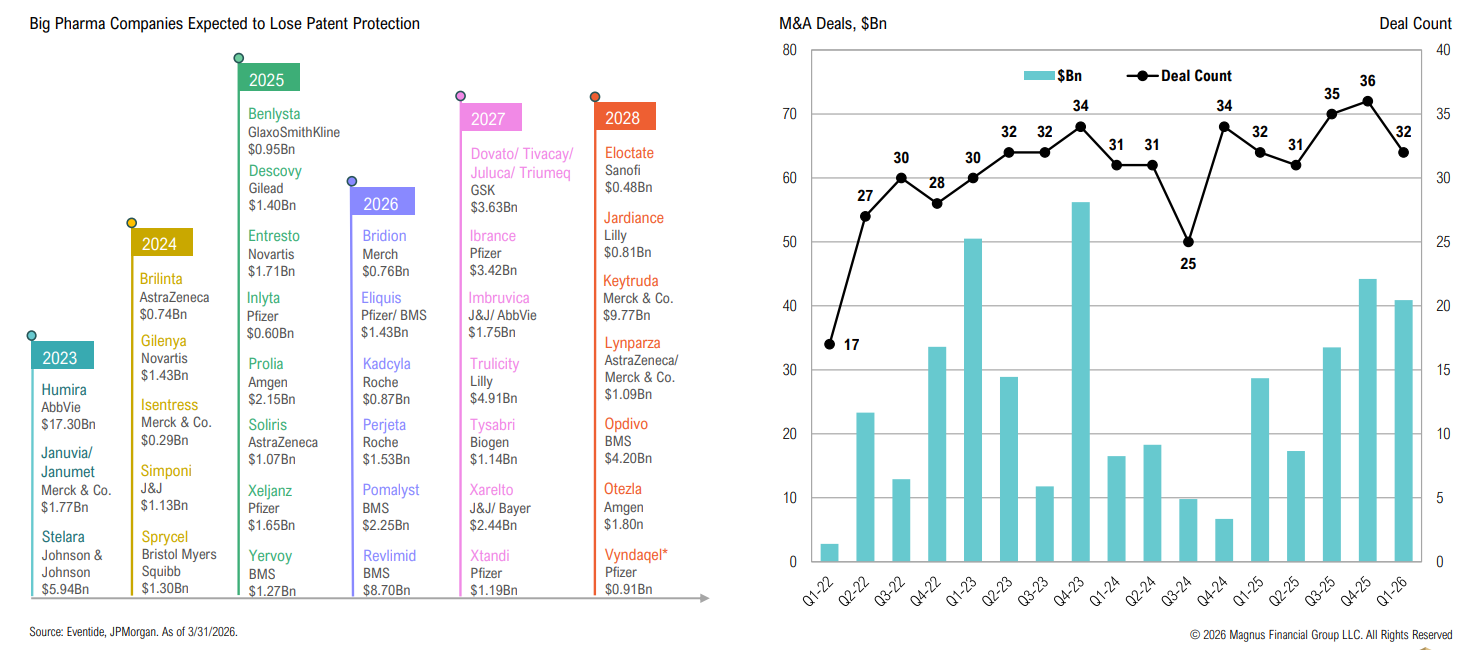
Big pharma’s patent cliff is accelerating, with roughly $200Bn in annual revenue at risk by 2030, supporting continued M&A activity that has reaccelerated in recent quarters
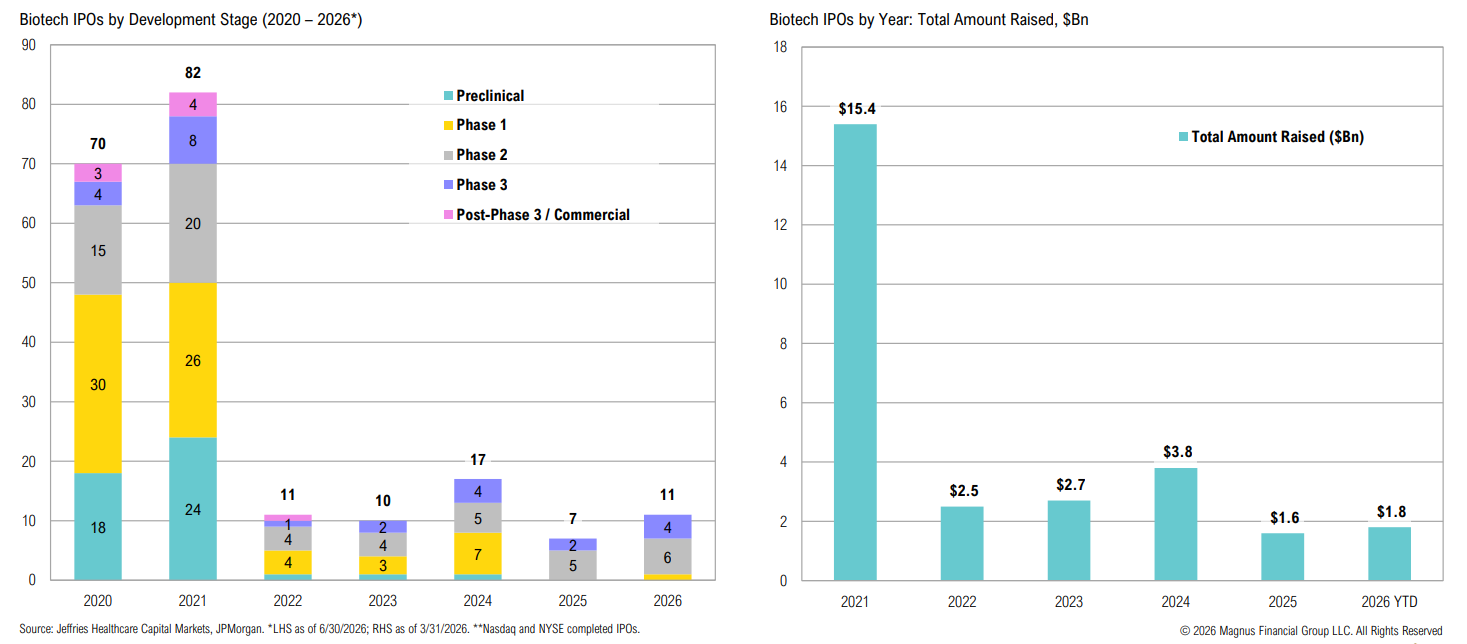
YTD, biopharma IPO listings are mostly comprised of later-stage assets (Phase 2/3); 2026 IPOs by dollar-value already exceed 2025 levels
Power Play

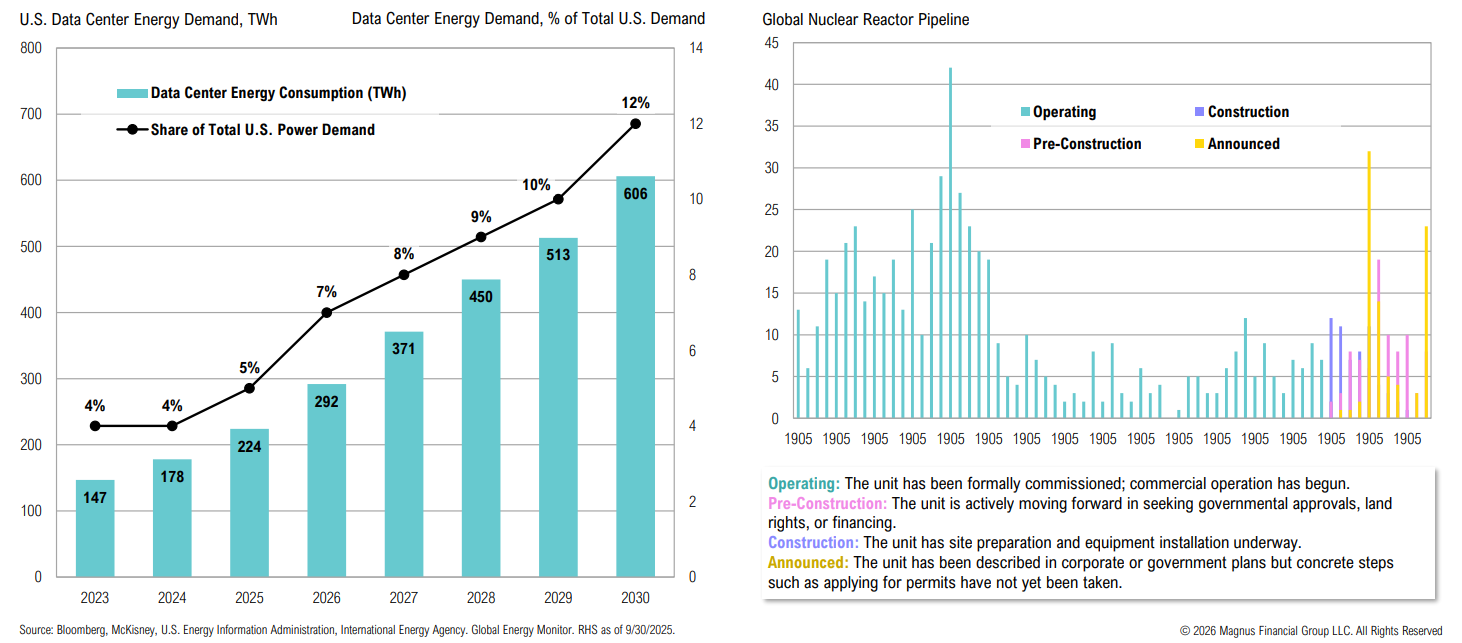
Data centers are expected to drive U.S. power demand; policy and rapidly rising demand for consistent energy output are leading to a nuclear renaissance
Real Estate

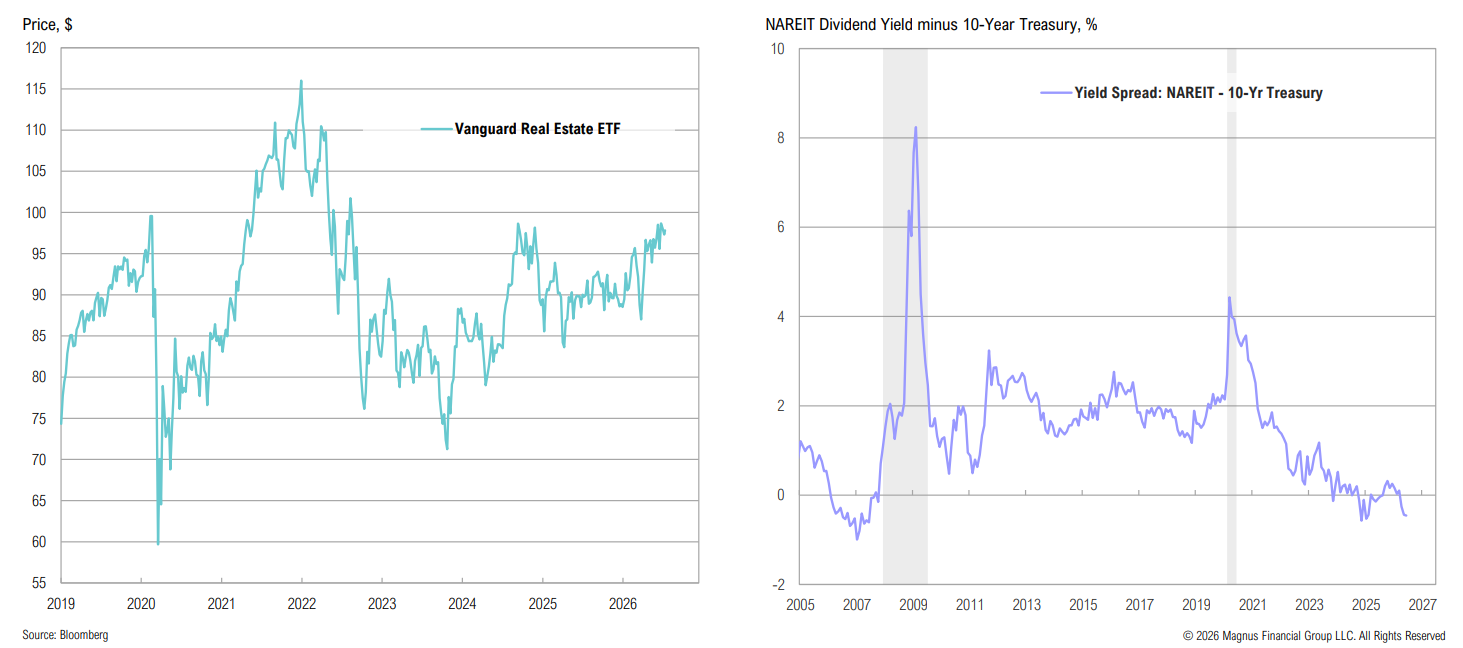
U.S.-listed real estate is still trading at pre-COVID price levels; despite this, REITs remain unattractive relative to Treasuries
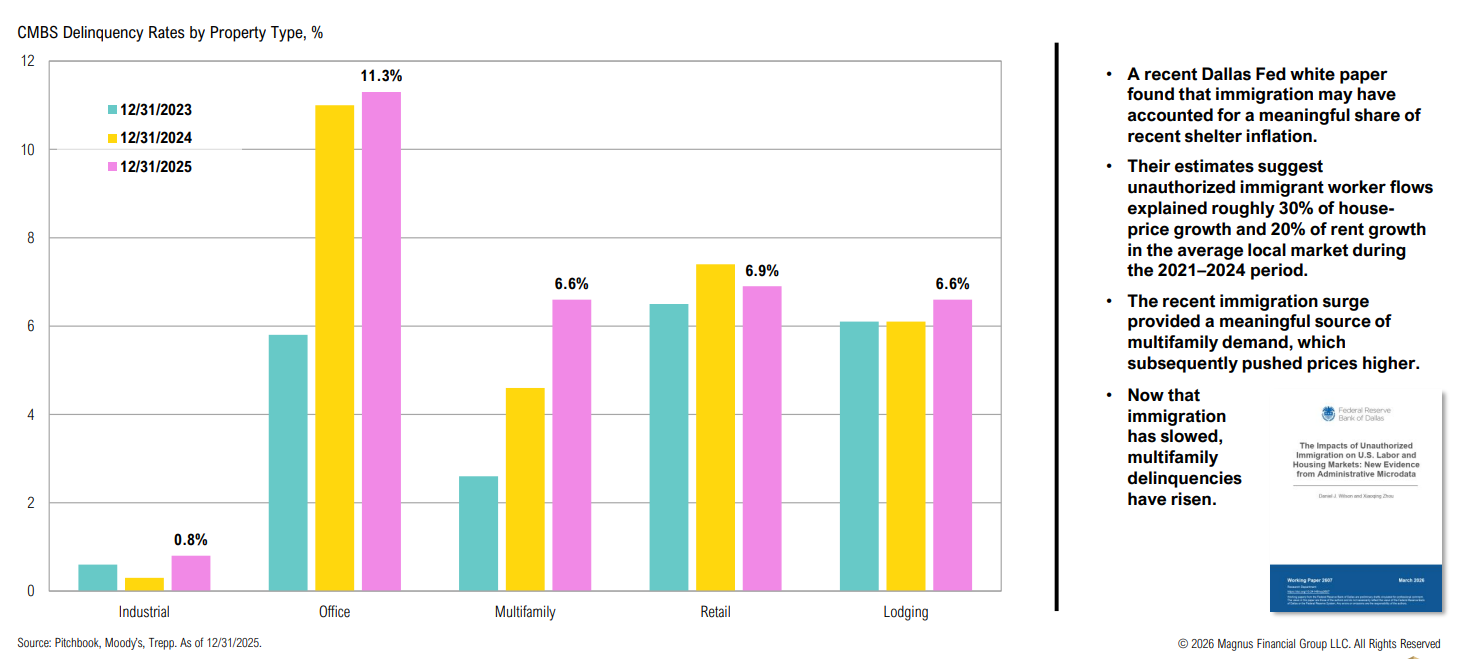
The immigration surge was a meaningful driver of housing demand and shelter inflation from 2021–2024; slower immigration could ease rent prices but increase multifamily stress
Energy

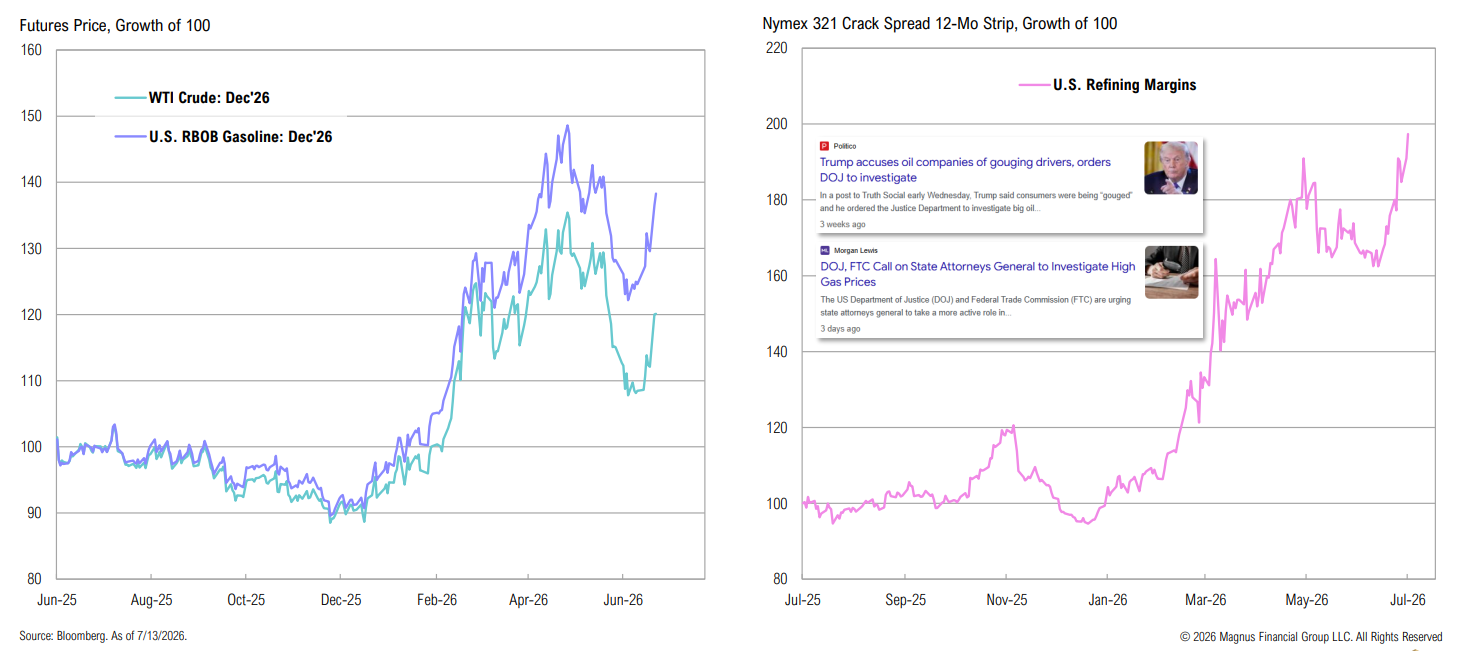
Gasoline prices remain higher than the increase in crude prices would suggest, driven by elevated refining margins; President Trump has ordered the DOJ to investigate potential price gouging
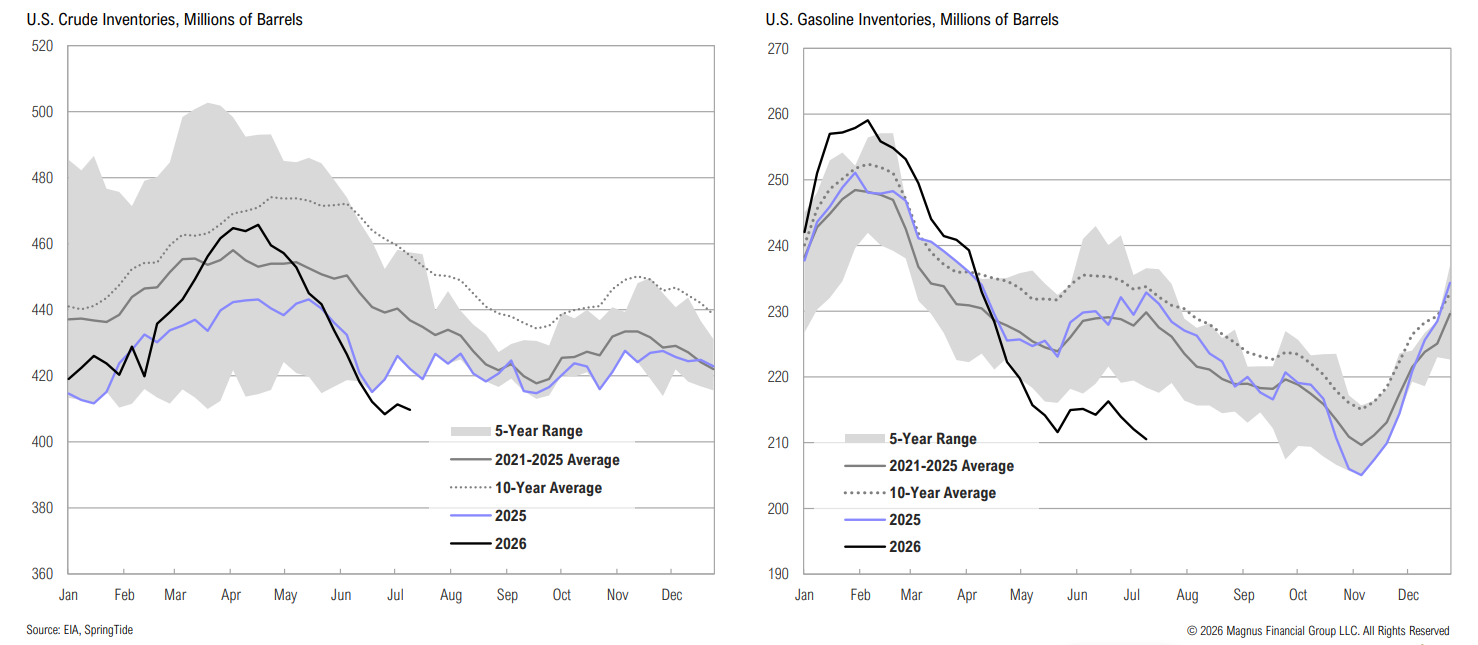
U.S. crude oil and gasoline inventories remain historically low; replenishment needs may keep prices above pre-conflict levels
Stablecoins

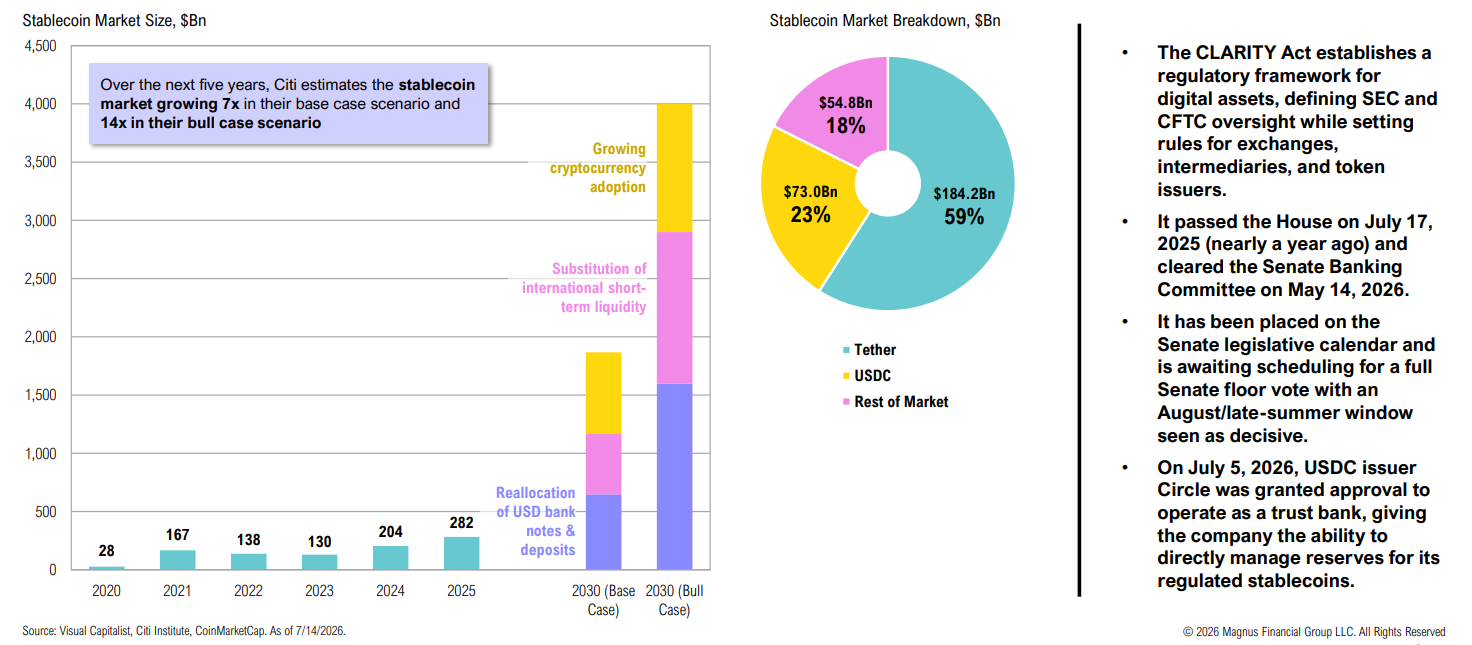
The CLARITY Act is awaiting scheduling for a full Senate floor vote, likely latesummer; on July 5, Circle was granted approval to operate as a trust bank
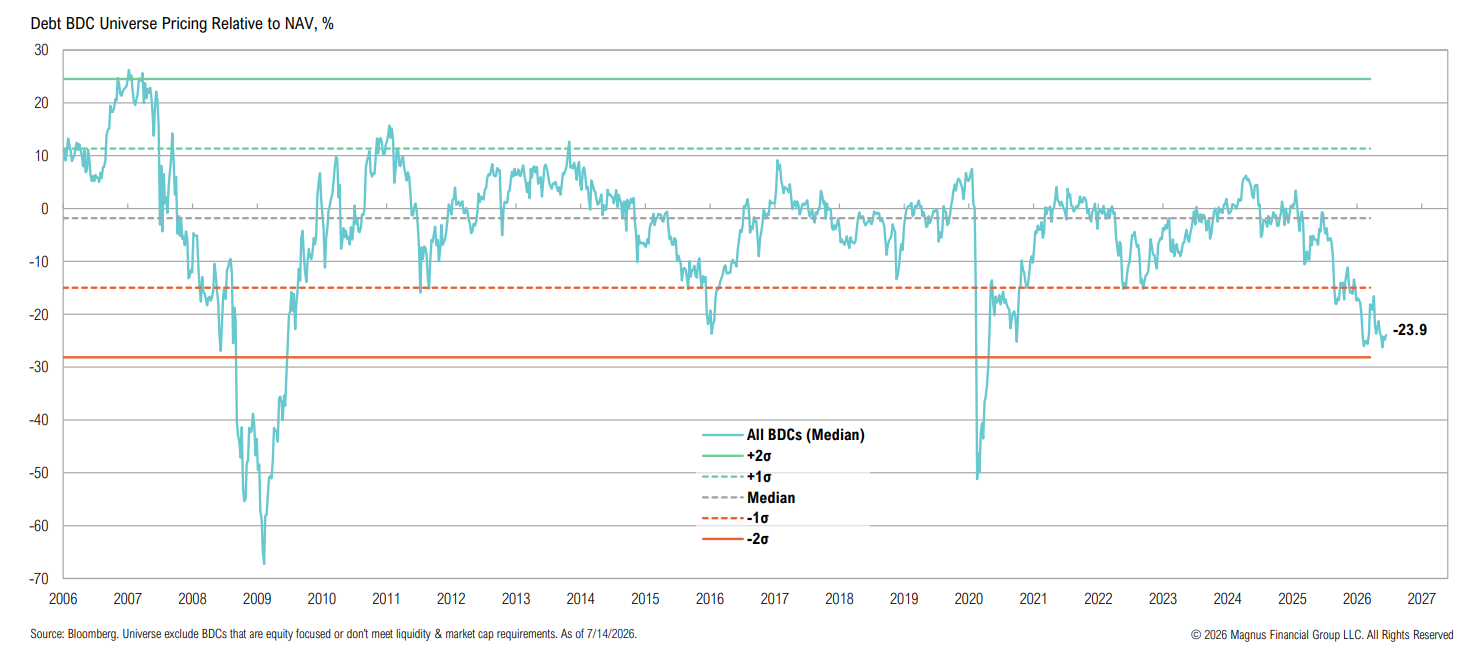
BDCs

The broad BDC universe is currently trading near a 2 standard deviation discount
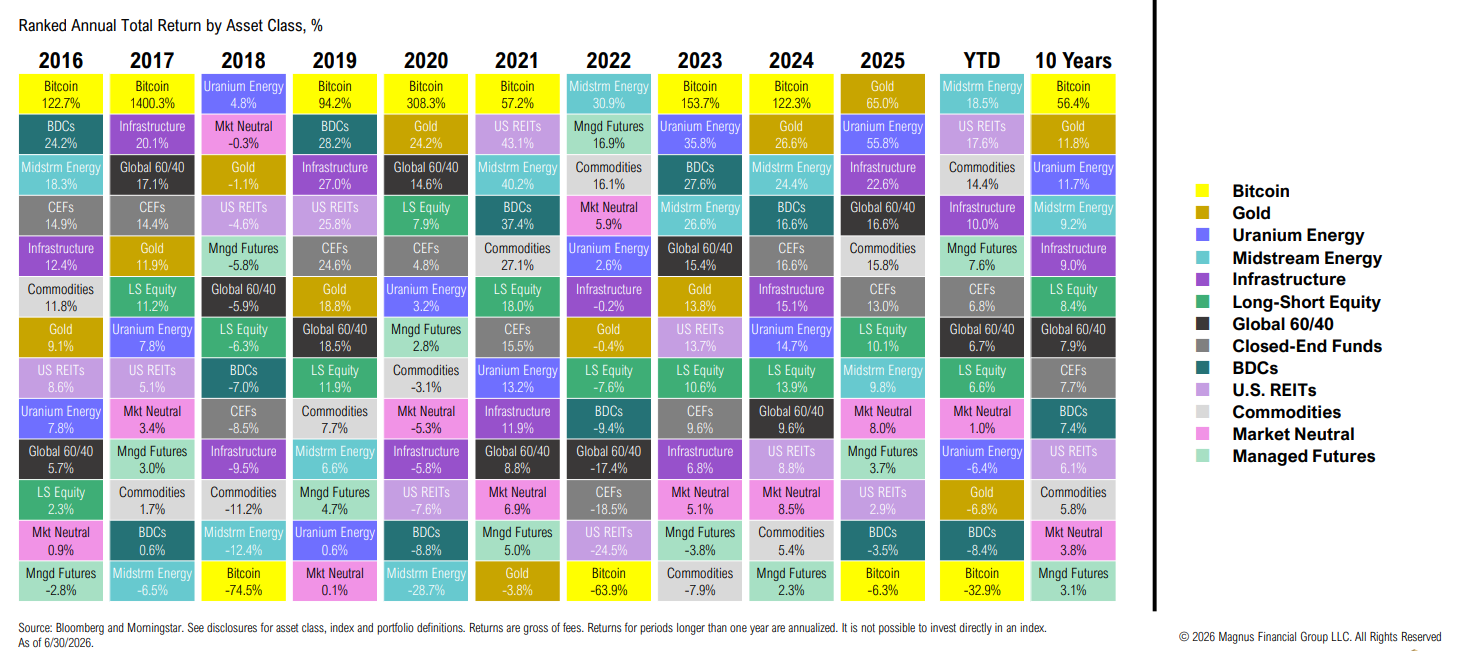
Quilt

Perspective on diversifiers performance cycles
Appendix

Supporting materials, including Capital Market Expectations and additional research referenced throughout the Market Outlook.


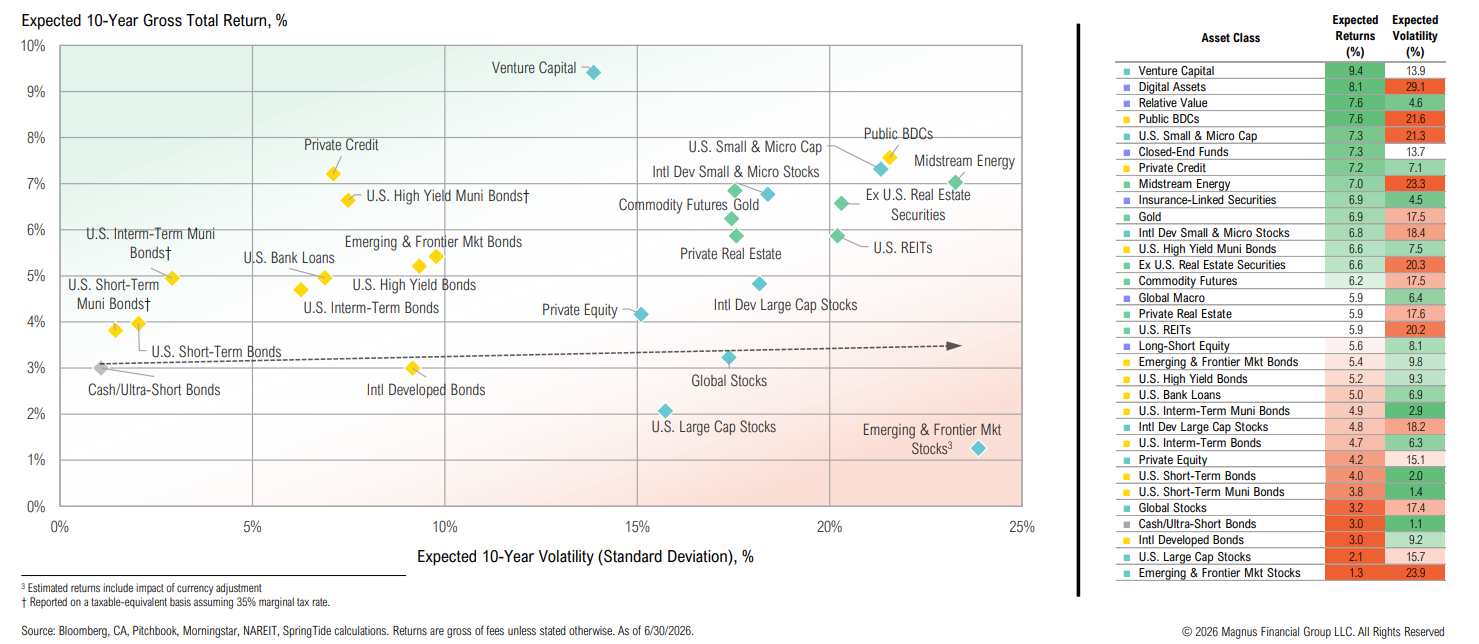
CMEs

With global valuations broadly stretched across asset classes, longer-term return assumptions have declined
Share it :
Disclaimer

Magnus Financial Group LLC (“Magnus”) did not produce and bears no responsibility for any part of this report whatsoever, including but not limited to any microeconomic views, inaccuracies or any errors or omissions. Research and data used in the presentation have come from third-party sources that Magnus has not independently verified presentation and the opinions expressed are not by Magnus or its employees and are current only as of the time made and are subject to change without notice.

This report may include estimates, projections or other forward-looking statements, however, due to numerous factors, actual events may differ substantially from those presented. The graphs and tables making up this report have been based on unaudited, third-party data and performance information provided to us by one or more commercial databases. Except for the historical information contained in this report, certain matters are forward looking statements or projections that are dependent upon risks and uncertainties, including but not limited to factors and considerations such as general market volatility, global economic risk, geopolitical risk, currency risk and other country-specific factors, fiscal and monetary policy, the level of interest rates, security-specific risks, and historical market segment or sector performance relationships as they relate to the business and economic cycle.

Additionally, please be aware that past performance is not a guide to the future performance of any manager or strategy, and that the performance results and historical information provided displayed herein may have been adversely or favorably impacted by events and economic conditions that will not prevail in the future. Therefore, it should not be inferred that these results are indicative of the future performance of any strategy, index, fund, manager or group of managers. Index benchmarks contained in this report are provided so that performance can be compared with the performance of well-known and widely recognized indices. Index results assume the re-investment of all dividends and interest and do not reflect any management fees, transaction costs or expenses.

The information provided is not intended to be, and should not be construed as, investment, legal or tax advice nor should such information contained herein be construed as a recommendation or advice to purchase or sell any security, investment, or portfolio allocation. An investor should consult with their financial advisor to determine the appropriate investment strategies and investment vehicles. Investment decisions should be made based on the investor’s specific financial needs and objectives, goals, time horizon and risk tolerance. This presentation makes no implied or express recommendations concerning the way any client’s accounts should or would be handled, as appropriate investment decisions depend upon the client’s specific investment objectives.

Investment advisory services offered through Magnus; securities offered through third party custodial relationships. More information about Magnus can be found on its Form ADV at www.adviserinfo.sec.gov.

Terms of Use
This report is intended solely for the use of its recipient. There is a fee associated with the access to this report and the information and materials presented herein. Re-distribution or republication of this report and its contents are prohibited. Expert use is implied.
Definitions

Asset class performance was measured using the following benchmarks: U.S. Large Cap Stocks: S&P 500 TR Index; U.S. Small & Micro Cap: Russell 2000 TR Index; Intl Dev Large Cap Stocks: MSCI EAFE GR Index; Emerging & Frontier Market Stocks: MSCI Emerging Markets GR Index; U.S. Intermediate-Term Muni Bonds: Bloomberg Barclays 1-10 (1-12 Yr) Muni Bond TR Index; U.S. Intermediate-Term Bonds: Bloomberg Barclays U.S. Aggregate Bond TR Index; U.S. High Yield Bonds: Bloomberg Barclays U.S. Corporate High Yield TR Index; U.S. Bank Loans: S&P/LSTA U.S. Leveraged Loan Index; Intl Developed Bonds: Bloomberg Barclays Global Aggregate ex-U.S. Index; Emerging & Frontier Market Bonds: JPMorgan EMBI Global Diversified TR Index; U.S. REITs: MSCI U.S. REIT GR Index, Ex U.S. Real Estate Securities: S&P Global Ex-U.S. Property TR Index; Commodity Futures: Bloomberg Commodity TR Index; Midstream Energy: Alerian MLP TR Index; Gold: LBMA Gold Price, U.S. 60/40: 60% S&P 500 TR Index; 40% Bloomberg Barclays U.S. Aggregate Bond TR Index; Global 60/40: 60% MSCI ACWI GR Index; 40% Bloomberg Barclays Global Aggregate Bond TR Index.

Contact Us

    You are now leaving the Magnus Financial Group Website and will be entering the Charles Schwab & Co., Inc. (“Schwab”) Website.

    Schwab is a registered broker-dealer, and is not affiliated with Magnus Financial Group or any advisor(s) whose name(s) appears on this Website. Magnus Financial Group is/are independently owned and operated. Schwab neither endorses nor recommends Magnus Financial Group. Regardless of any referral or recommendation, Schwab does not endorse or recommend the investment strategy of any advisor. Schwab has agreements with Magnus Financial Group under which Schwab provides Magnus Financial Group with services related to your account. Schwab does not review the Magnus Financial Group Website(s), and makes no representation regarding the content of the Website(s). The information contained in the Magnus Financial Group Website should not be considered to be either a recommendation by Schwab or a solicitation of any offer to purchase or sell any securities.